- Qualcomm Launches Snapdragon 4 Gen 2 Mobile Platform
- AMD Launches Ryzen PRO 7000 Series Mobile & Desktop Platform
- Intel Launches Sleek Single-Slot Arc Pro A60 Workstation Graphics Card
- NVIDIA Announces Latest Ada Lovelace Additions: GeForce RTX 4060 Ti & RTX 4060
- Maxon Redshift With AMD Radeon GPU Rendering Support Now Available
Social & RSS Feeds
Latest Videos


Latest News
ADATA Ultimate SU800 512GB SSD Review
by Robert Tanner on May 25, 2017 in Storage
ADATA is a well-known flash storage company that offers the most prolific range of SSD models currently available on the market. While this makes it hard to determine which SSD is best for you, it also guarantees there’s a model at practically every price point. Is the midrange SU800 that offers better endurance and performance consistency worth the increase in price over budget models? We find out.
Page 2 – Test Suite, PC Mark, Iometer & AS SSD
Benchmark Programs
Futuremark PCMark 08: Normal settings are used including the default setting of three runs. This gives us an extended test that takes roughly 45 minutes to complete, resulting in a sustained load that will thermally challenge drives. The free (demo) version is available on Steam for public use.
AS SSD: This handy little utility was custom-written for solid-state drives. We selected this program as by default it utilizes incompressible data and bypasses the Windows cache. This is another free program anyone can use to quickly test or verify normal performance of an SSD, available here.
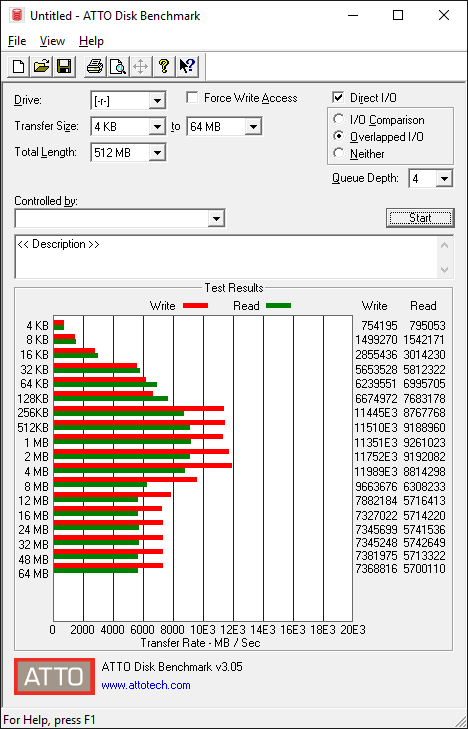
ATTO: The bar graphs generated by this utility provide a huge amount of data in a condensed format. It is extremely handy for detecting problematic file sizes, performance bottlenecks, or simply inconsistent performance. Though this is significantly less of a problem today as solid-state drives have matured, it is an essential tool of any benchmark kit.
RoboCopy: This is Windows’ command-line utility included in most versions of Windows and provides for features beyond the default file copy handling of Windows Explorer. More information is available here. Windows Defender is also disabled to prevent bottlenecking the folder copy. We utilize a 9.81GB Movie file, and also a 1.6GB Folder with 11,511 files across 449 subfolders.
RAMdrive: Primo Software’s Ramdisk utility is a handy, convenient way to create a 12GB direct-IO ramdisk, meaning no indexing or caching is utilized and removes any bottlenecks associated with another storage device. File performance varies by I/O size but exceeds 6GB/s above 16KB IOPS.
dBpoweramp R15.3: We convert 500 FLAC encoded music files (14.4GB) into Apple Lossless encoded files for playback on Apple devices. As no lossy compression is taking place, this minimizes the CPU workload while maximizing the amount of data written to the destination drive. Unfortunately this test would show more variance in results for systems with greater than four cores as dBpoweramp will fully load any size processor.
IOmeter – The most powerful piece of storage testing software freely available, IOmeter allows the creation of practically any kind of test workload. We first utilize it to dirty every new SSD before we test the basics of every solid-sate drive, namely random 4K read and writes, as well as 2MB sequential read and write performance.
Footnote – Disk I/O Tracing
If you are still reading our benchmark profile, thank you! It is not easy to devise tests that can tax a modern solid-state drive so if you have any suggestions or know of any software that you would like to see added to our test regimen, please let us know. We are especially eager to add disk I/O trace recording and playback to replace the batch file testing we utilized in past storage reviews. We are still looking into how to make this possible, so if you know of a piece of software that is free or doesn’t cost a few grand please do drop us a note!
Futuremark PCMark 8
| ADATA SU800 | ADATA SP550 | Transcend SSD370S | Kingston Predator | Samsung 950 PRO (Samsung NVMe) | |
| World of Warcraft | 58s | 59s | 58s | 58s | 57s |
| Battlefield 3 | 133s | 134s | 133s | 133s | 131s |
| Photoshop Light | 114s | 114s | 114s | 112s | 110s |
| Photoshop Heavy | 360s | 374s | 360s | 355s | 351s |
| Adobe InDesign | 57s | 60s | 57s | 57s | 55s |
| Adobe After Effects | 71s | 71s | 71s | 71s | 70s |
| Adobe Illustrator | 72s | 72s | 72s | 72s | 71s |
| Microsoft Word | 28s | 28s | 28s | 28s | 28s |
| Microsoft Excel | 9s | 9s | 9s | 9s | 9s |
| Microsoft PowerPoint | 9s | 9s | 9s | 9s | 9s |
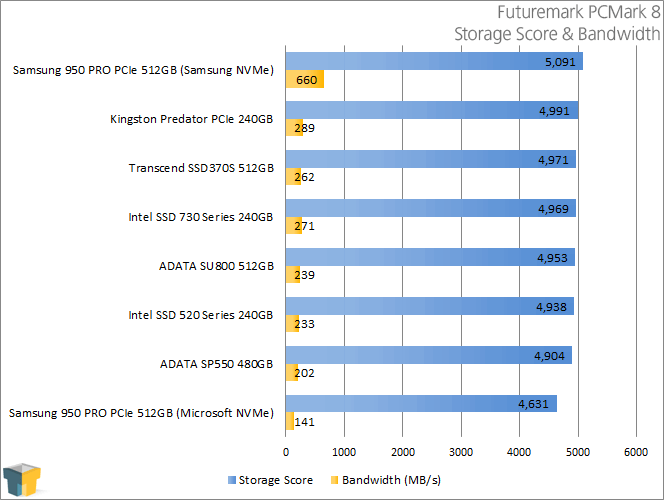
The SU800 kicks off by exceeding the venerable old Intel 520 in both bandwidth and overall storage score, delivering 37MB/s higher bandwidth than the budget SP550 and 49 more points overall.
Iometer 2010 1.1.0
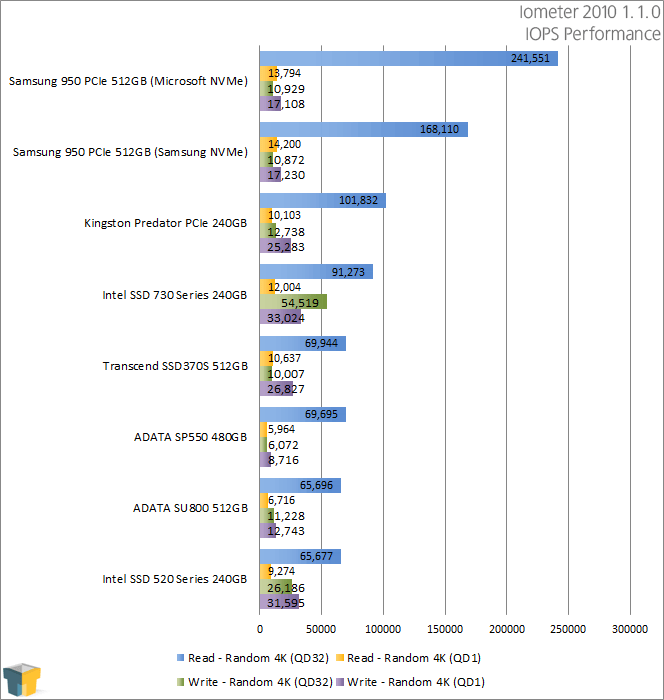
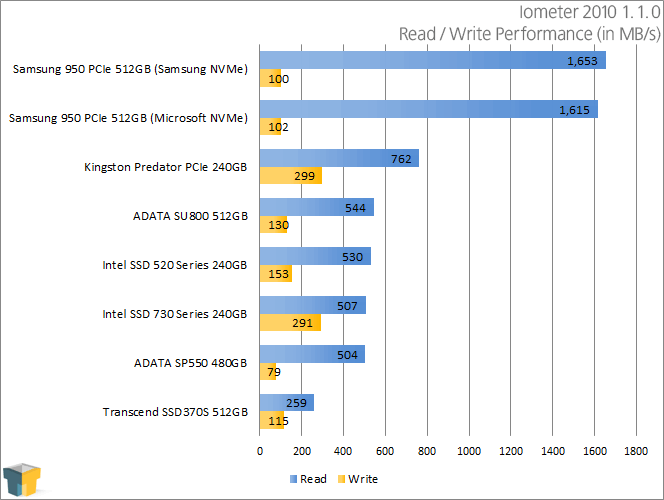
One thing to keep in mind is Iometer creates a test file that spans the entire size of the SSD. So it should come as no surprise that this effectively negates the SLC caching performance of the SP550. Because of this, the SU800 is able to easily exceed it in sustained write performance. The drive is even able to edge out both Intel drives here, making it the quickest SATA-based drive in our sequential read/write benchmarks.
For IOPS, the SU800 turned in not-quite double the Random 4K performance of the SP550 when using higher queue-depths, showing the drive is much more capable of extracting performance from parallel writes. However, even with a QD of one the drive offers 50% better random write IOPS than its budget SP550 cousin. Intel drives are optimized for random IOPS, so they swap positions with the SU800, which indicates the SU800 is optimized to favor sequential workloads.
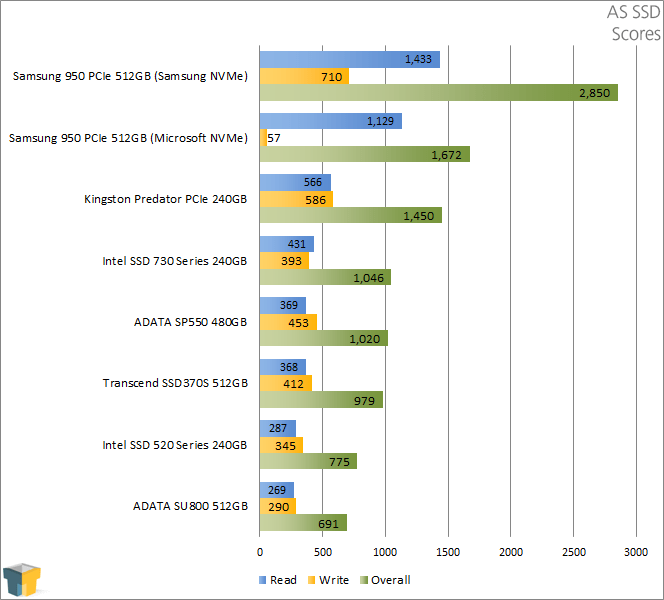
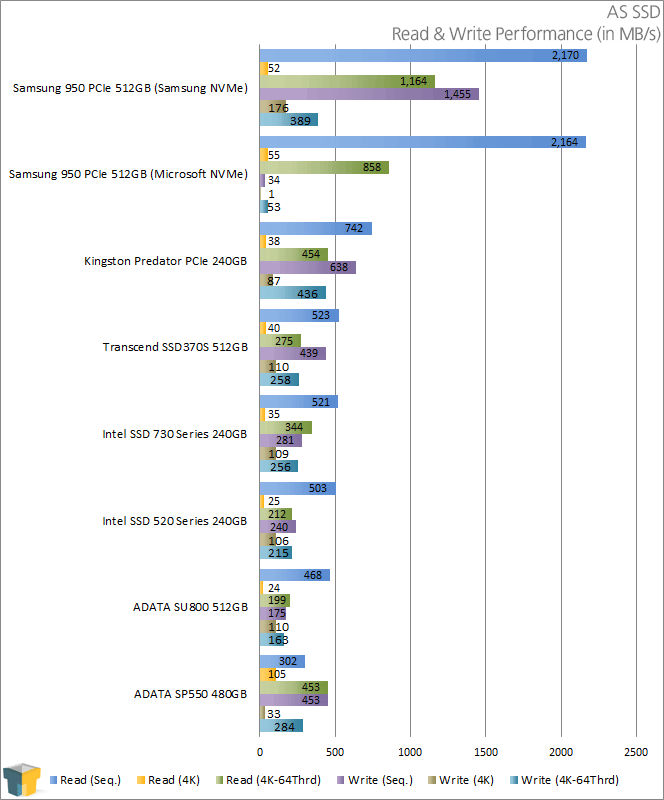
AS SSD
| AS SSD – Latencies | Read | Write |
| ADATA SP550 (480GB) | 0.035ms | 0.034ms |
| ADATA SU800 (512GB) | 0.032ms | 0.035ms |
| Intel 520 (240GB) | 0.110ms | 0.173ms |
| Intel 730 (240GB) | 0.032ms | 0.032ms |
| Kingston Predator (240GB) | 0.041ms | 0.047ms |
| Samsung 950 PRO (Microsoft NVMe) | 0.027ms | 2.670ms |
| Samsung 950 PRO (Samsung NVMe) | 0.023ms | 0.021ms |
| Transcend SSD370S (512GB) | 0.032ms | 0.035ms |
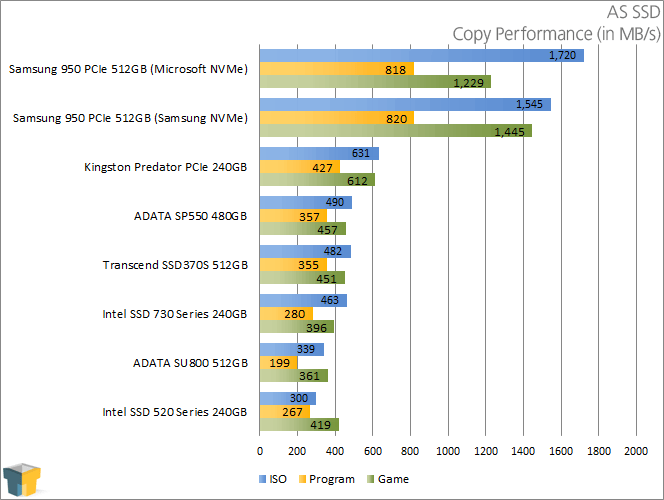
By default AS SSD uses a 1GB file for its test run, and that is what we utilized in our tests, though this can be modified. Results are mixed as the file fits easily within the SP550’s fast-write cache, though the SU800 is still able to deliver strong 4K random write performance at higher queue-depths. The SU800 does not fare much better in the copy tests either.

Support our efforts! With ad revenue at an all-time low for written websites, we're relying more than ever on reader support to help us continue putting so much effort into this type of content. You can support us by becoming a Patron, or by using our Amazon shopping affiliate links listed through our articles. Thanks for your support!