- Qualcomm Launches Snapdragon 4 Gen 2 Mobile Platform
- AMD Launches Ryzen PRO 7000 Series Mobile & Desktop Platform
- Intel Launches Sleek Single-Slot Arc Pro A60 Workstation Graphics Card
- NVIDIA Announces Latest Ada Lovelace Additions: GeForce RTX 4060 Ti & RTX 4060
- Maxon Redshift With AMD Radeon GPU Rendering Support Now Available
Social & RSS Feeds
Latest Videos


Latest News
ASUS Commando
by Greg King on April 19, 2007 in Motherboards
ASUS has been on a roll with their RoG line of motherboards. Their third installment, Commando, looks to impress enthusiasts with the help of Intels P965 chipset. How does this board stack up against others, and is it worthy of the Republic of Gamers name?
Page 7 – Test Platform and Benchmarks
|
|
In this review, and in all other motherboard reviews that this editor does, the following hardware will be used. As the number of motherboard we review continues to grow, our goal is to keep the numbers as constant as possible. Should hardware change, aside form the board being tested, we will run the tests again on each board being compared. Until we see a need to change the testing hardware though, we will keep the test setup the same in the hopes that the information is remains as congruent as possible.
- CPU: Intel Core 2 Duo E6600 @ 2.4GHz
- Motherboard: Asus Commando P965 motherboard
- Memory: Kingston DDR2 PC-9200 2GB at DDR2-800 4-4-4-12 1T (If possible)
- Video: ATi x1900 XTX
- Sound: Onboard HD Audio
- Storage: Western Digital Raptor 10K RPM 74GB (OS)
- PSU: Enermax Galaxy 850W
- Etcetera: Windows XP Professional w/ SP2
-
Compared Motherboards
- DFI Infinity 975X/G
- DFI ICFX3200-T2R/G
Throughout the tests, on all of the motherboards used in this review, we will be using a suite of benchmarks that we have not only used extensively in the past, but also feel to reflect directly upon the performance capabilities of the motherboards themselves.
Some are game benches where we use FRAPS to capture the rough average of frames per second and some are as synthetic as they come. All, when used correctly and fairly, should give us an order of performance between all three of the motherboards being tested in this review. The programs used/ran are:
- Super Pi (1, 4 and 8 million places)
- Cinebench
- Sciencemark
- Sandra 2007
- HD Tune
- PC Mark ‘05
- 3D Mark ‘06
- Gaming (Frames per Second average using FRAPS)
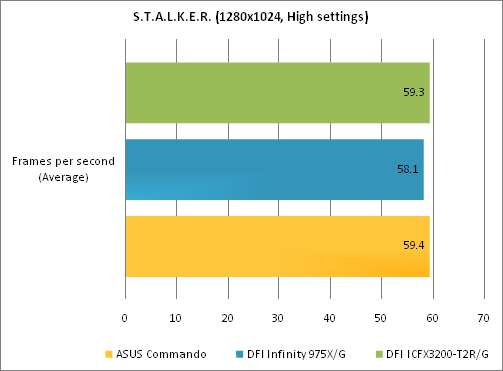
- S.T.A.L.K.E.R.
- Ghost Recon: Advanced Warfighter
- F.E.A.R.
Results
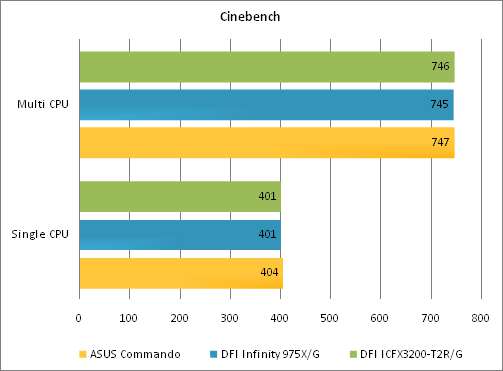
First up, in Cinebench, we can see that there is very little performance difference between the three boards in CPU performance but out of them all, the Commando comes out on top slightly.
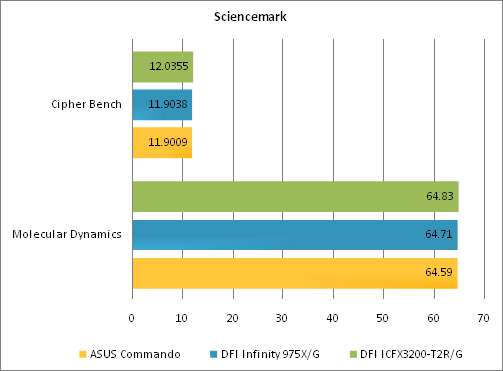
One of the staples in our benchmarking here at Techgage is Sciencemark. In Sciencemark, we run two individual and separate benchmarks. As the graph shows, there is very little difference between the three motherboards in both Molecular Dynamics and Cipher Bench alike.
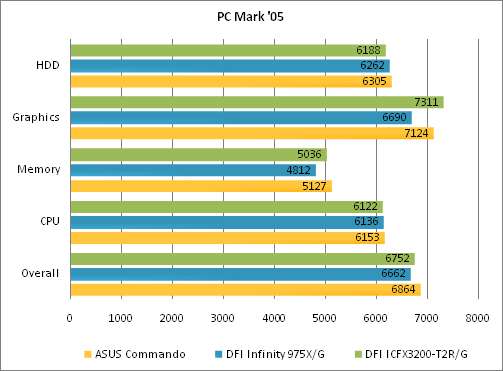
In PC Mark ’05, the contestants start to distance themselves from each other a bit more. In this benchmark, the program will test how the PC responds in various everyday activities. It does a good job of testing out each component of the system to give us an individual score for each. Since we are using the same hardware for every test, it should give us a rough idea of how each component us utilized by the motherboard. In this run, we ran everything at default settings and at the end, recorded the scores for the hard drive, graphics, memory and CPU tests. There is also an overall score that is produces that will be recorded as well.
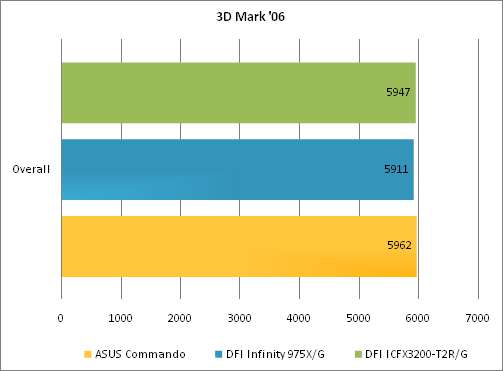
Another favorite of most benchmarkers is another Futuremark product, 3D Mark ’06. Being the latest offering from Futuremark, ’06 tests the PC in a gaming environment by not only stressing the video card, but the CPU as well. Again, since all of the hardware remains the same from motherboard to motherboard, this should give us a good picture of how the Commando uses each part of the system.
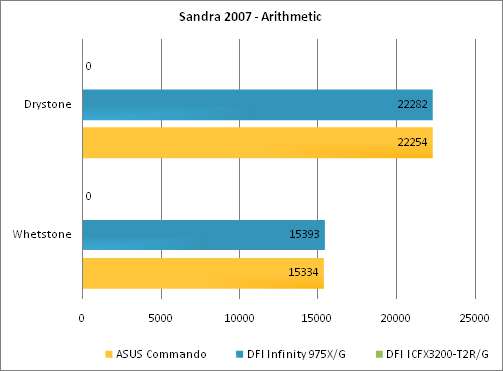
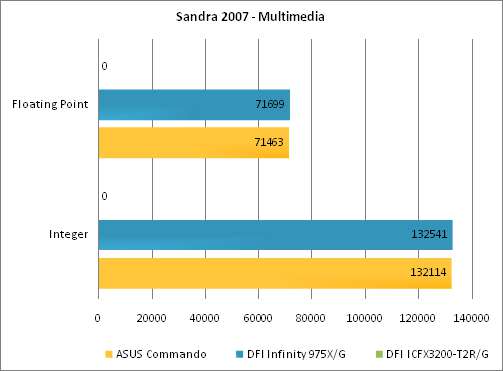
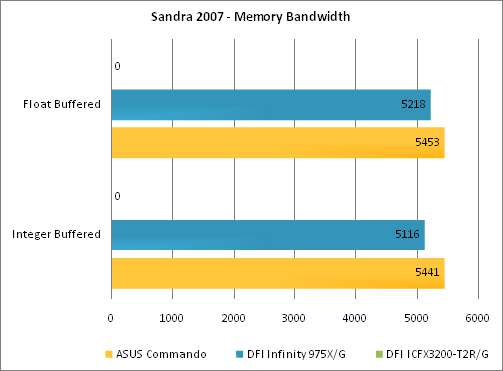
In Sandra, we can use the benchmarking suite to test out individual components. This ranges from a network connection to the bandwidth of our memory. For this review, we run the CPU arithmetic and Multimedia tests, as well as the memory bandwidth.
In this benchmark, we could not get the program to start up on the DFI ICFX3200. No matter what we tried, it would not open up. Because of that, only the Commando and the DFI Infinity will be represented on the graph.
Notice how the CPU and memory scores are almost even. There is a slight difference in the favor of the Commando.
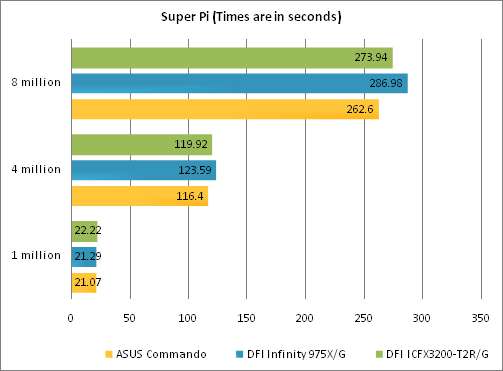
Ahh, the benchmarker’s perennial favorite, Super Pi. This is a fun little program that calculates the digits of Pi to a set amount. Super Pi is very dependant on memory bandwidth and raw CPU power and frequency. While all close at 1 million places, the Commando starts to pull ahead of the pack as the decimal places start to add up.
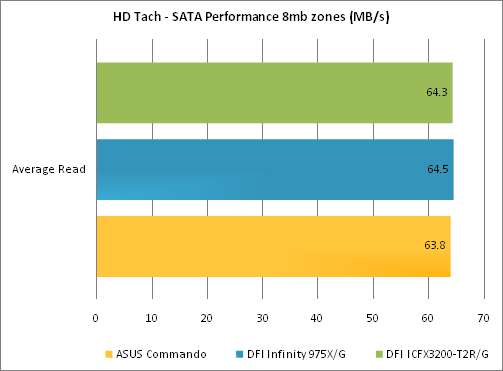
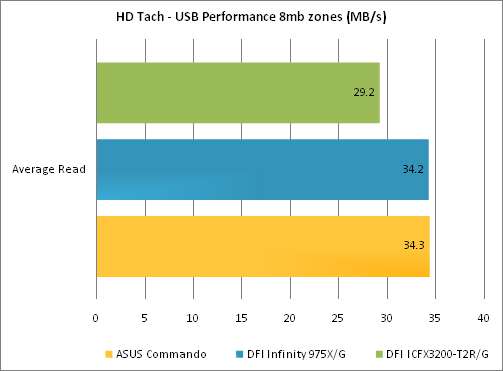
In our final benchmark, we will test the speed of a SATA hard drive and one that is connected over the USB port. This is something that affects us all and should give us a “real world” idea of media performance.
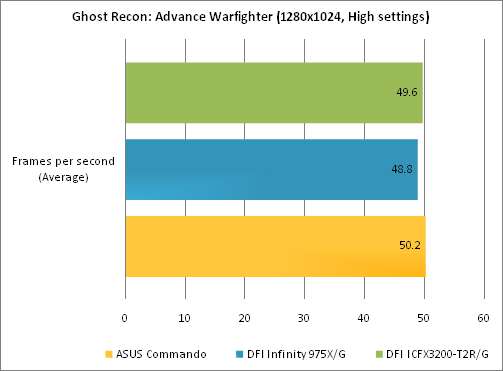
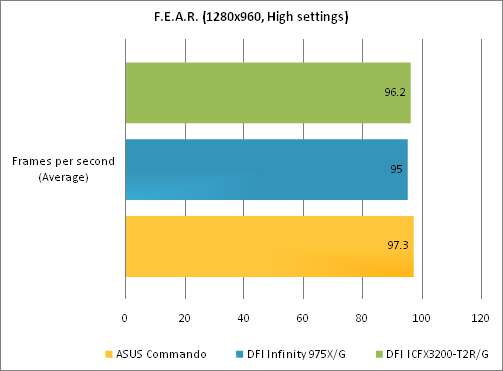
Now that we have all of that done and finished with, lets turn our attention to what most gamers are going to be interested in… games. For each of the three games used, a unified game save is used for each motherboard. As similar of a course throughout the level as possible is kept to keep the experiences in one run as similar to the experiences in the other runs. Each game’s FPS is recorded by FRAPS for a duration of 60 seconds and is repeated 2 more times. The average of the three runs, per game is recorded as the final performance number.
|
|

Support our efforts! With ad revenue at an all-time low for written websites, we're relying more than ever on reader support to help us continue putting so much effort into this type of content. You can support us by becoming a Patron, or by using our Amazon shopping affiliate links listed through our articles. Thanks for your support!