- Qualcomm Launches Snapdragon 4 Gen 2 Mobile Platform
- AMD Launches Ryzen PRO 7000 Series Mobile & Desktop Platform
- Intel Launches Sleek Single-Slot Arc Pro A60 Workstation Graphics Card
- NVIDIA Announces Latest Ada Lovelace Additions: GeForce RTX 4060 Ti & RTX 4060
- Maxon Redshift With AMD Radeon GPU Rendering Support Now Available
Social & RSS Feeds
Latest Videos


Latest News
Intel Core i7 Performance Preview
by Rob Williams on November 3, 2008 in Processors
With Core i7’s launch due in just a few weeks, there’s no better time than right now to take a hard look at its performance, which is what we’re taking care of today. In addition to our usual performance comparisons with last-gen CPUs, we’re also taking an in-depth look at both QPI and HyperThreading performance, and some of our results may surprise you.
Page 5 – SYSmark 2007 Preview
Synthetic benchmarks have typically been favored for performance testing, but the results they provide can be fairly abstract, and the methods they use to assign their scores can be dubious at times. By contrast, real-world application benchmarks provide performance metrics that apply directly to real-world usage, and we endeavor to apply both in our performance comparisons.
SYSmark 2007 Preview from BAPCo is a special case, because its synthetic scores are derived from tests in real-world applications. However, we still believe that synthetic benchmarking scores are best used to directly compare the performance of one piece of hardware to another, and not for developing an impression of real-world performance expectations. SYSmark is more useful than most synthetic benchmarking programs in our opinion, because its tests emulate tasks that people actually perform, in actual software programs that they are likely to use.
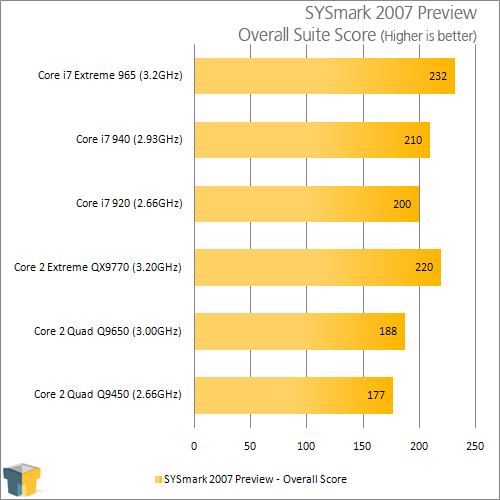
The benchmark is hands-free, using scripts to execute all of the real-world scenarios identically, such as video editing in Sony Vegas and image manipulation in Adobe Photoshop. At the conclusion of the suite of tests, five scores are delivered: an E-learning score, a Video Creation score, a Productivity score, and a 3D Performance score, as well as an aggregated ‘Overall’ score. These scores can still be fairly abstract, and are most useful for direct comparisons between test systems.
A quick note on methodology: SYSmark 2007 requires a clean install of Windows Vista 32-bit to run optimally. Before any testing is conducted, the hard drive is first wiped clean, and then a fresh Windows installation is conducted, then lastly, the necessary hardware drivers are installed. The ‘Three Iterations’ test suite is run, with the ‘Conditioning Run’ setting enabled. Then the results from the three runs are averaged and rounded up or down to the next whole number.
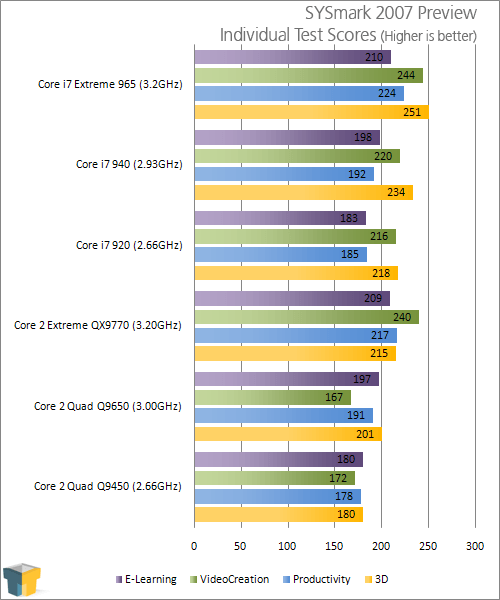
So far, there isn’t really a clear sign of just how much better Core i7 is, except with regards to 3D rendering. There, the differences are rather significant, to say the least. Can we expect similar results with real-world 3D applications? We’re taking care of that next.

Support our efforts! With ad revenue at an all-time low for written websites, we're relying more than ever on reader support to help us continue putting so much effort into this type of content. You can support us by becoming a Patron, or by using our Amazon shopping affiliate links listed through our articles. Thanks for your support!

Rob Williams
Rob founded Techgage in 2005 to be an 'Advocate of the consumer', focusing on fair reviews and keeping people apprised of news in the tech world. Catering to both enthusiasts and businesses alike; from desktop gaming to professional workstations, and all the supporting software.


