- Qualcomm Launches Snapdragon 4 Gen 2 Mobile Platform
- AMD Launches Ryzen PRO 7000 Series Mobile & Desktop Platform
- Intel Launches Sleek Single-Slot Arc Pro A60 Workstation Graphics Card
- NVIDIA Announces Latest Ada Lovelace Additions: GeForce RTX 4060 Ti & RTX 4060
- Maxon Redshift With AMD Radeon GPU Rendering Support Now Available
Social & RSS Feeds
Latest Videos


Latest News
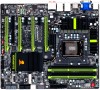
GIGABYTE G1.Sniper 3 Motherboard Review
by Rob Williams on May 3, 2013 in Motherboards
The motherboard market is loaded with options targeted squarely at overclockers and the general enthusiast, but finding a board – much less an entire series – dedicated to gamers is difficult. GIGABYTE realized that back in 2011, and thus its G1 series was born. In this article, we’re taking a look at the company’s current Z77 offering, the G1.Sniper 3.
Page 4 – Performance Testing
From a performance perspective, we feel that motherboard benchmarking is useless. It’s the motherboard’s job to allow all of the installed hardware to operate at its full potential, so in theory, a $100 option shouldn’t be much (or any) slower than a $300 one. The differences in price instead come down to the quality of the onboard components and other features.
So why do it at all, then? We still perform benchmarks because it’s important to make sure that the board we’re dealing with doesn’t lack in one particular area versus the rest. If board A performs 2% slower than board B in PCMark 7, for example, that’s of no concern to us – random variance is a fact of life with benchmarking. However, if one board consistently performs weaker than the rest, that’s worthy of note – it could suggest that weaker components have been used which do not allow the hardware to operate at its full potential.
Please bare this all in mind when perusing our results. Just because a board under-performs in a single test, it doesn’t mean anything in regards to its quality as a whole. Our ultimate goal here is to make sure that each board we test performs as we’d expect across the gamut of scenarios we pit them against.
| Intel LGA1155 Test System | |
| Processors | Intel Core i7-3770K – Quad-Core, 3.50GHz, Default Voltage |
| Motherboard | ASUS P8Z77-V DELUXE (BIOS: ‘1401’ 07/30/2012) GIGABYTE G1.Sniper 3 (BIOS: ‘F8j’ 02/20/2013) GIGABYTE Z77X-UD5H (BIOS: ‘F14’ 08/23/2012) Intel DZ77GA-70K (BIOS: ‘0049’ 07/13/2012) MSI Z77A-GD55 (BIOS: ‘1.5’ 07/17/2012) |
| Memory | Kingston HyperX Genesis 4x4GB – DDR3-1600 8-8-8-24 @ 1.65v |
| Graphics | AMD Radeon HD 7850 1GB (Catalyst 12.7 Driver) |
| Audio | On-Board Creative X-Fi Audio |
| Storage | Corsair Force F160 160GB Solid-State Drive (OS Drive) Kingston HyperX 240 Solid-State Drive (I/O Testing) |
| Power Supply | Corsair HX850W |
| Chassis | Corsair Obsidian 700D Full-Tower |
| Cooling | Corsair H70 Self-Contained Liquid Cooler |
| Et cetera | Windows 7 Professional 64-bit |
Let’s get on with it!
| BCLK Values | Result |
| ASUS P8Z77-V DELUXE | 100.0 MHz |
| GIGABYTE G1.Sniper 3 | 100.1 MHz |
| GIGABYTE Z77X-UD5H | 100.1 MHz |
| Intel DZ77GA-70K | 99.8 MHz |
| MSI Z77A-GD55 | 100.0 MHz |
All checks out – but let’s tackle something before going further. Both ASUS and GIGABYTE have mechanics in place where if the memory is adjusted at all, the CPU auto-overclocks. For a consumer, this is perfectly fine, and something I agree with (as long as the CPU’s not pegged to its max value, of course). This mechanic does however destroy our hopes of an apples-to-apples comparison, but as mentioned above, since we’re mainly comparing boards to make sure one doesn’t fall short in some regard, this is fine. So again, bare this in mind.
General System Performance
To take a look at the “overall” performance of our PC configuration, we rely on a simple Windows boot test (cold boot > usable desktop) and dual Futuremark suites; PCMark 7 and 3DMark 11. Please note that we’re using PCMark 7 1.0.4, not the recently-released 1.4.0 (which has resulted in score changes).
| Cold Boot to Desktop | Result |
| ASUS P8Z77-V DELUXE | 20.894s |
| GIGABYTE G1.Sniper 3 | 21.784s |
| GIGABYTE Z77X-UD5H | 23.647s |
| Intel DZ77GA-70K | 27.708s |
| MSI Z77A-GD55 | 22.604s |
| Lower results are better. | |
| PCMark 7 | Test 1 | Test 2 | Test 3 | Test 4 | Test 5 | Test 6 | Test 7 |
| ASUS P8Z77-V DELUXE | 23.07 | 8.49 | 95.66 | 12.34 | 19.98 | 21.95 | 5.43 |
| GIGABYTE G1.Sniper 3 | 23.05 | 8.455 | 95.98 | 12.43 | 19.06 | 22.61 | 5.39 |
| GIGABYTE Z77X-UD5H | 23.06 | 8.774 | 96.54 | 12.36 | 18.61 | 22.67 | 5.41 |
| Intel DZ77GA-70K | 23.08 | 8.154 | 89.89 | 11.71 | 20.22 | 21.51 | 5.4 |
| MSI Z77A-GD55 | 23.11 | 8.313 | 97.63 | 12.64 | 20.21 | 22.67 | 5.44 |
| (1) Video Playback (2) Video Transcoding (3) Gaming (Graphics) (4) Image Manipulation (5) Importing Pictures (6) Web Browsing (7) Windows Defender All results in MB/s; higher is better |
|||||||
| PCMark 7 Suite Scores | Result |
| ASUS P8Z77-V DELUXE | 5431 |
| GIGABYTE G1.Sniper 3 | 5443 |
| GIGABYTE Z77X-UD5H | 5461 |
| Intel DZ77GA-70K | 5323 |
| MSI Z77A-GD55 | 5506 |
| Higher results are better. | |
| Gaming | 3DMark 11 |
| ASUS P8Z77-V DELUXE | 5629 |
| GIGABYTE G1.Sniper 3 | 5432 |
| GIGABYTE Z77X-UD5H | 5567 |
| Intel DZ77GA-70K | 5599 |
| MSI Z77A-GD55 | 5562 |
| 3DMark results in points; higher is better. Left 4 Dead results in FPS; higher is better. | |
The G1.Sniper 3 placed second in our boot-time test, while it performed admirably everywhere else. Interestingly, GIGABYTE’s own Z77X-UD5H managed to eke out an additional 100 points in 3DMark 11 – interesting only because the G1.Sniper is the “gaming” board.
I/O Performance
To properly give the internal SATA 6Gbit/s a good workout, we turn to HD Tune and Iometer.
| HD Tune Pro 5 | Minimum | Average | Maximum | Latency |
| ASUS P8Z77-V DELUXE | 353.4 | 379.6 | 412.4 | 0.043ms |
| GIGABYTE G1.Sniper 3 | 329.5 | 334.8 | 344.0 | 0.134ms |
| GIGABYTE Z77X-UD5H | 371.9 | 375.7 | 384.0 | 0.046ms |
| Intel DZ77GA-70K | 350.6 | 358.3 | 366.4 | 0.045ms |
| MSI Z77A-GD55 | 381.3 | 384.7 | 397.5 | 0.043ms |
| Min/Avg/Max results in MB/s; higher is better. Latency results in ms; lower is better. | ||||
| Database | Workstation | File Server | ||||
| Iometer 1.1.0 | Read | Write | Read | Write | Read | Write |
| ASUS P8Z77-V DELUXE | 4451.18 | 2191.30 | 5995.34 | 1501.51 | 6060.14 | 1515.90 |
| GIGABYTE G1.Sniper 3 | 4138.48 | 2043.58 | 5674.01 | 1420.44 | 5690.62 | 1401.28 |
| GIGABYTE Z77X-UD5H | 4188.38 | 2062.59 | 5702.64 | 1427.58 | 5753.73 | 1436.30 |
| Intel DZ77GA-70K | 4272.09 | 2103.73 | 6056.63 | 1513.94 | 5772.78 | 1441.31 |
| MSI Z77A-GD55 | 4439.99 | 2186.03 | 5937.08 | 1482.60 | 5947.93 | 1485.10 |
| Results in IOPS; higher is better. | ||||||
Once again, the results here look good, although where HD Tune is concerned, it’s hard to ignore the decreased performance overall. Even the latency saw a decline, and while 0.1ms is virtually nothing in the grand scheme, it’s the only board to have exhibited a result above 0.0XX.
Rendering & Image Manipulation
Writing files to disk or reading a website doesn’t do much to exercise our CPU, so for that, we turn to a couple of common scenarios; image editing, video rendering and 3D rendering, using a combination of Adobe and Autodesk products.
| Adobe Lightroom 4.1 | Result |
| ASUS P8Z77-V DELUXE | 522.35s |
| GIGABYTE G1.Sniper 3 | 515.01s |
| GIGABYTE Z77X-UD5H | 522.98s |
| Intel DZ77GA-70K | 548.78s |
| MSI Z77A-GD55 | 526.89s |
| Results in seconds; lower is better. | |
| Adobe Premiere Pro CS5.5 | Result |
| ASUS P8Z77-V DELUXE | 681 |
| GIGABYTE G1.Sniper 3 | 661 |
| GIGABYTE Z77X-UD5H | 701 |
| Intel DZ77GA-70K | 716 |
| MSI Z77A-GD55 | 679 |
| Results in seconds; lower is better. | |
| Autodesk 3ds Max 2011 | Result |
| ASUS P8Z77-V DELUXE | 1322s |
| GIGABYTE G1.Sniper 3 | 1380s |
| GIGABYTE Z77X-UD5H | 1270s |
| Intel DZ77GA-70K | 1403s |
| MSI Z77A-GD55 | 1325s |
| Results in seconds; lower is better. | |
| Cinebench R11.5 | OpenGL | CPU |
| ASUS P8Z77-V DELUXE | 83.29 | 7.45 |
| GIGABYTE G1.Sniper 3 | 81.50 | 7.51 |
| GIGABYTE Z77X-UD5H | 86.20 | 7.85 |
| Intel DZ77GA-70K | 77.38 | 7.07 |
| MSI Z77A-GD55 | 80.74 | 7.49 |
| Higher results are better. | ||
GIGABYTE’s G1 fell short in a couple of our previous tests, but it redeems itself here. As is typical of motherboard testing, you win some, you lose some.
Sub-system Performance
For memory and CPU throughput testing, we utilize SiSoftware’s Sandra 2012 (SP4), and for Ethernet testing, we use iperf (or more appropriately, the Java-based jperf which utilizes it).
| Sandra 2012 SP4 | Integer | Float | Cache | Mem Latency |
| ASUS P8Z77-V DELUXE | 20.90 | 20.90 | 123.05 | 22.20 |
| GIGABYTE G1.Sniper 3 | 21.23 | 21.22 | 122.93 | 22.17 |
| GIGABYTE Z77X-UD5H | 20.79 | 20.79 | 123.39 | 22.8 |
| Intel DZ77GA-70K | 21.34 | 21.33 | 120.163 | 24.4 |
| MSI Z77A-GD55 | 21.17 | 21.11 | 123.72 | 24.70 |
| Int/Float/Cache results in GB/s; higher is better. Latency results in ns; lower is better. | ||||
| Ethernet (iperf) | 50 Jobs (64KB) | 50 Jobs (1518KB) |
| ASUS P8Z77-V DELUXE (Intel 82579V) | 939 | 941 |
| GIGABYTE G1.Sniper 3 (Intel 82579V) | 930 | 922 |
| GIGABYTE Z77X-UD5H (Intel 82579V) | 936 | 918 |
| Intel DZ77GA-70K (Intel 82579V) | 930 | 920 |
| MSI Z77A-GD55 (Intel 82579V) | 932 | 942 |
| Results in Mbit/s; higher is better. | ||
Wrapping up, both iperf and SANDRA gives us expected results. With that, it’s time to wrap this review up.

Support our efforts! With ad revenue at an all-time low for written websites, we're relying more than ever on reader support to help us continue putting so much effort into this type of content. You can support us by becoming a Patron, or by using our Amazon shopping affiliate links listed through our articles. Thanks for your support!

Rob Williams
Rob founded Techgage in 2005 to be an 'Advocate of the consumer', focusing on fair reviews and keeping people apprised of news in the tech world. Catering to both enthusiasts and businesses alike; from desktop gaming to professional workstations, and all the supporting software.


