Date: June 2, 2009 - Author: Rob Williams
It's been a good seven months since the launch of the original Core i7 processors, so isn't it about time we got to see some new models? Don't fret, as Intel has just announced their i7-950 3.06GHz mid-range and i7-975 3.33GHz high-end models. We're taking a look at the latter today, so let's see how it compares to its predecessor.
Where has the time gone? It feels like (to me, at least), that Intel just dropped their Core i7 launch processors, but in reality, it happened a full seven months ago. That's a long time in CPU years, so what about a follow-up? Don't fret... Intel is delivering just that today, although exact availability is yet to be seen.
To quickly recap, in November of 2008, Intel kick-started their i7 line-up with the mainstream i7-920 ($284), the mid-range i7-940 ($562) and also the high-end i7-965 Extreme Edition. Since then, nothing else Core i7 has launched, although a few Core 2 Quad's have, such as the S series (power-efficient) and also some budget Quad-Core.
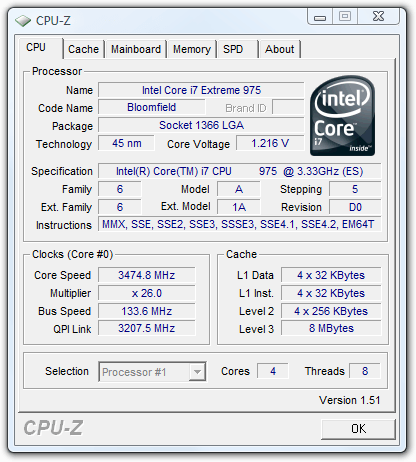
Intel today launches two models that are set to replace two already launched. The main focus from the company is the i7-975, an Extreme Edition, which boosts the i7-965's clock speed from 3.2GHz to 3.33GHz. It's a sure thing that the i7-975 will eventually replace the i7-965 wholly, but when that will happen is unknown.
Also new is the i7-950, a 3.06GHz part that bumps the clock speeds of the i7-940 from 2.93. Like the i7-975, this model is likely to entirely replace the i7-940. It's important to note that speculated pricing for these two new models put them a little more expensive than the previous parts, but it's highly doubtful that they will stay at such prices for long.
The i7-950 and i7-975 are more evolutionary than revolutionary, or as many like to call them... "speed bumps", meaning that the architecture is the same, but the clocks experience a boost. Although Intel hasn't been entirely open about any other changes made, it's been rumored that minor changes have also been made to the chip to help improve overclocking, but we'll have to wait and see what overclockers can accomplish before we settle on that.

As you can see in the chart below, Intel currently has a huge line-up of CPUs (excluding Dual-Core), with five Core i7 total. Core i5 will soon be added to this list, but not until around late August/early September when the chips start to flow to the market. As it stands though, the top two models are the only to use a 6.4GT/s QPI, while the others use 4.8GT/s, although the real-world differences between the two are difficult to pinpoint.
Quad-Core CPU Name |
Cores |
Clock |
Cache |
QPI/FSB |
TDP |
1Ku Price |
| Intel Core i7-975 Extreme Edition | 4 |
3.33GHz |
8MB |
3200MHz |
150W |
$999 |
| Intel Core i7-965 Extreme Edition | 4 |
3.20GHz |
8MB |
3200MHz |
150W |
$999 |
| Intel Core i7-950 | 4 |
3.06GHz |
8MB |
2400MHz |
130W |
$??? |
| Intel Core i7-940 | 4 |
2.93GHz |
8MB |
2400MHz |
130W |
$562 |
| Intel Core i7-920 | 4 |
2.66GHz |
8MB |
2400MHz |
130W |
$284 |
| Intel Core 2 Extreme QX9775 | 4 |
3.20GHz |
2 x 6MB |
1600MHz |
150W |
$1,499 |
| Intel Core 2 Extreme Q9650 | 4 |
3.00GHz |
2 x 6MB |
1333MHz |
130W |
$316 |
| Intel Core 2 Quad Q9550S | 4 |
2.83GHz |
2 x 6MB |
1333MHz |
65W |
$369 |
| Intel Core 2 Quad Q9550 | 4 |
2.83GHz |
2 x 6MB |
1333MHz |
95W |
$266 |
| Intel Core 2 Quad Q9400S | 4 |
2.66GHz |
2 x 3MB |
1333MHz |
65W |
$320 |
| Intel Core 2 Quad Q9400 | 4 |
2.66GHz |
2 x 3MB |
1333MHz |
95W |
$213 |
| Intel Core 2 Quad Q9300 | 4 |
2.50GHz |
2 x 3MB |
1333MHz |
95W |
$266 |
| Intel Core 2 Quad Q8400S | 4 |
2.66GHz |
2 x 2MB |
1333MHz |
65W |
$245 |
| Intel Core 2 Quad Q8400 | 4 |
2.66GHz |
2 x 2MB |
1333MHz |
95W |
$183 |
| Intel Core 2 Quad Q8300 | 4 |
2.50GHz |
2 x 2MB |
1333MHz |
95W |
$183 |
| Intel Core 2 Quad Q8200S | 4 |
2.33GHz |
2 x 2MB |
1333MHz |
65W |
$245 |
| Intel Core 2 Quad Q8200 | 4 |
2.33GHz |
2 x 2MB |
1333MHz |
95W |
$163 |
While we don't have an i7-950 on-hand, we do have an i7-975 Extreme Edition. So, let's see how it compares to our entire line-up of processors, including its predecessor, the i7-965.
At Techgage, we strive to make sure our results are as accurate as possible. Our testing is rigorous and time-consuming, but we feel the effort is worth it. In an attempt to leave no question unanswered, this page contains not only our testbed specifications, but also a fully-detailed look at how we conduct our testing.
If there is a bit of information that we've omitted, or you wish to offer thoughts or suggest changes, please feel free to shoot us an e-mail or post in our forums.
The table below lists the hardware for our two current machines, which remains unchanged throughout all testing, with the exception of the processor. Each CPU used for the sake of comparison is also listed here, along with the BIOS version of the motherboard used. In addition, each one of the URLs in this table can be clicked to view the respective review of that product, or if a review doesn't exist, you will be led to the product on the manufacturer's website.
Component |
AMD Test System |
| Processors |
AMD Phenom II X4 955 Black Edition - Quad-Core, 3.20GHz, 1.325v AMD Phenom II X4 810 - Quad-Core, 2.60GHz, 1.325v AMD Phenom II X3 720 Black Edition - Tri-Core, 2.80GHz, 1.325v AMD Athlon 64 X2 7750 - Dual-Core, 2.70GHz, 1.325v |
| Motherboard | Gigabyte MA790GP-DS4H - 790GX-based, F3 BIOS (01/13/09) |
| Memory |
Corsair XMS3 DHX 2x2GB - DDR3-1066 5-5-5-15-2T, 2.10v |
| Graphics |
Palit Radeon HD 4870 512MB (Catalyst 8.11) |
| Audio | On-Board Audio |
| Storage | |
| Power Supply | |
| Chassis | |
| Display | |
| Cooling | |
| Et cetera |
Component |
Core i7 Test System |
| Processors |
Intel Core i7-975 Extreme Edition - Quad-Core, 3.33GHz, 1.30v Intel Core i7-965 Extreme Edition - Quad-Core, 3.20GHz, 1.30v Intel Core i7-920 - Quad-Core, 2.66GHz, 1.30v |
| Motherboard | ASUS Rampage II Extreme - X58-based, 0705 BIOS (11/21/08) |
| Memory |
OCZ Gold 3x2GB - DDR3-1066 7-7-7-20-1T, 1.56v (920/940) OCZ Gold 3x2GB - DDR3-1600 7-7-7-20-1T, 1.56v (965) |
| Graphics |
Palit Radeon HD 4870 512MB (Catalyst 8.11) |
| Audio | On-Board Audio |
| Storage | |
| Power Supply | |
| Chassis | |
| Display | |
| Cooling | |
| Et cetera |
Component |
Core 2 Test System |
| Processors |
Intel Core 2 Quad Q9650 - Quad-Core, 3.00GHz, 1.30v (Sim) Intel Core 2 Quad Q9550 - Quad-Core, 2.83GHz, 1.30v (Sim) Intel Core 2 Quad Q9400 - Quad-Core, 2.66GHz, 1.30v Intel Core 2 Quad Q8200 - Quad-Core, 2.33GHz, 1.30v Intel Core 2 Duo E8600 - Dual-Core, 3.33GHz, 1.30v Intel Core 2 Duo E8500 - Dual-Core, 3.16GHz, 1.30v (Sim) Intel Core 2 Duo E8400 - Dual-Core, 3.00GHz, 1.30v Intel Core 2 Duo E8300 - Dual-Core, 2.83GHz, 1.30v (Sim) Intel Core 2 Duo E7200 - Dual-Core, 2.53GHz, 1.30v Intel Pentium Dual-Core E5200 - Dual-Core 2.50GHz, 1.30v |
| Motherboard | ASUS Rampage Extreme - X48-based, 0501 BIOS (08/28/08) |
| Memory |
Corsair XMS3 DHX 2x2GB - DDR3-1333 7-7-7-15-1T, 1.91v (1333FSB) Corsair XMS3 DHX 2x2GB - DDR3-1066 6-6-6-15-1T, 1.91v (1066FSB) Corsair XMS3 DHX 2x2GB - DDR3-800 6-6-6-15-1T, 1.91v (800FSB) |
| Graphics |
Palit Radeon HD 4870 512MB (Catalyst 8.11) |
| Audio | On-Board Audio |
| Storage | |
| Power Supply | |
| Chassis | |
| Display | |
| Cooling | |
| Et cetera |
(Sim) represents models that were tested using a faster, but under-clocked processor. For example, for the Q9550, we used the QX9770, since the specs are identical all-around, except for the clock speeds. Those were adjusted appropriately, effectively giving us a Q9550 to test with.
When preparing our testbeds for any type of performance testing, we follow these guidelines:
To aide with the goal of keeping accurate and repeatable results, we alter certain services in Windows Vista from starting up at boot. This is due to the fact that these services have the tendency to start up in the background without notice, potentially causing slightly inaccurate results. Disabling "Windows Search" turns off the OS' indexing which can at times utilize the hard drive and memory more than we'd like.
To help test out the real performance benefits of a given processor, we run a large collection of both real-world and synthetic benchmarks, including 3ds Max, Adobe Lightroom, TMPGEnc Xpress, Sandra 2009 and many more.
Our ultimate goal is always to find out which processor excels in a given scenario and why. Running all of the applications in our carefully-chosen suite can help better give us answers to those questions. Aside from application data, we also run two common games to see how performance scales there, including Call of Duty 4 and Half-Life 2: Episode Two.
In an attempt to offer "real-world" results, we do not utilize timedemos in any of our reviews. Each game in our test suite is benchmarked manually, with the minimum and average frames-per-second (FPS) captured with the help of FRAPS 2.9.5.
To deliver the best overall results, each title we use is exhaustively explored in order to find the best possible level in terms of intensiveness and replayability. Once a level is chosen, we play through repeatedly to find the best possible route and then in our official benchmarking, we stick to that route as close as possible. Since we are not robots and the game can throw in minor twists with each run, no run can be identical to the pixel.
Each game and setting combination is tested twice, and if there is a discrepancy between the initial results, the testing is repeated until we see results we are confident with.
The two games we currently use for our motherboard reviews are listed below, with direct screenshots of the game's setting screens and explanations of why we chose what we did.
1680x1050 |
2560x1600 |
1680x1050 |
2560x1600 |
1680x1050 |
2560x1600 |
Synthetic benchmarks have typically been favored for performance testing, but the results they provide can be fairly abstract, and the methods they use to assign their scores can be dubious at times. By contrast, real-world application benchmarks provide performance metrics that apply directly to real-world usage, and we endeavor to apply both in our performance comparisons.
SYSmark 2007 Preview from BAPCo is a special case, because its synthetic scores are derived from tests in real-world applications. However, we still believe that synthetic benchmarking scores are best used to directly compare the performance of one piece of hardware to another, and not for developing an impression of real-world performance expectations. SYSmark is more useful than most synthetic benchmarking programs in our opinion, because its tests emulate tasks that people actually perform, in actual software programs that they are likely to use.
The benchmark is hands-free, using scripts to execute all of the real-world scenarios identically, such as video editing in Sony Vegas and image manipulation in Adobe Photoshop. At the conclusion of the suite of tests, five scores are delivered: an E-learning score, a Video Creation score, a Productivity score, and a 3D Performance score, as well as an aggregated 'Overall' score. These scores can still be fairly abstract, and are most useful for direct comparisons between test systems.
A quick note on methodology: SYSmark 2007 requires a clean install of Windows Vista 64-bit to run optimally. Before any testing is conducted, the hard drive is first wiped clean, and then a fresh Windows installation is conducted, then lastly, the necessary hardware drivers are installed. The 'Three Iterations' test suite is run, with the 'Conditioning Run' setting enabled. Then the results from the three runs are averaged and rounded up or down to the next whole number.


The results are a bit higher than I would have expected, given the i7-965 isn't that much slower, but whether or not this is due to various other factors or not, I'm unsure. Let's move forward and see if things even themselves out, or if the i7-975 continues to dominate.
Autodesk's 3ds Max is without question an industry standard when it comes to 3D modeling and animation, with DreamWorks, BioWare and Blizzard Entertainment being a few of its notable users. It's a multi-threaded application that's designed to be right at home on multi-core and multi-processor workstations or render farms, so it easily tasks even the biggest system we can currently throw at it.
For our testing, we use two project files that are designed to last long enough to find any weakness in our setup and also allows us to find a result that's easily comparable between both motherboards and processors. The first project is a dog model included on recent 3ds Max DVD's, which we infused with some Techgage flavor.
Our second project is a Bathroom scene that makes heavy use of ray tracing. Like the dog model, this one is also included with the application's sample files DVD. The dog is rendered at an 1100x825 resolution, while the Bathroom is rendered as 1080p (1920x1080).

Like 3DS Max, Cinema 4D is another popular cross-platform 3D graphics application that's used by new users and experts alike. Its creators, Maxon, are well aware that their users are interested in huge computers to speed up rendering times, which is one reason why they released Cinebench to the public.
Cinebench R10 is based on the Cinema 4D engine and the test consists of rendering a high-resolution model of a motorcycle and gives a score at the end. Like most other 3D applications on the market, Cinebench will take advantage of as many cores as you can throw at it.

Similar to Cinebench, the "Persistence of Vision Ray Tracer" is as you'd expect, a ray tracing application that also happens to be cross-platform. It allows you to take your environment and models and apply a ray tracing algorithm, based on a script you either write yourself or borrow from others. It's a free application and has become a standard in the ray tracing community and some of the results that can be seen are completely mind-blowing.
The official version of POV-Ray is 3.6, but the 3.7 beta unlocks the ability to take full advantage of a multi-core processor, which is why we use it in our testing. Applying ray tracing algorithms can be extremely system intensive, so this is one area where multi-core processors will be of true benefit.
For our test, we run the built-in benchmark, which delivers a simple score (Pixels-Per-Second) the the end. The higher, the better. If one score is twice another, it does literally mean it rendered twice as fast.

Throughout all three tests here, the i7-975 performed just as we expected, with marginal, but noticeable (on paper) gains.
Photo manipulation benchmarks are more relevant than ever, given the proliferation of high-end digital photography hardware. For this benchmark, we test the system's handling of RAW photo data using Adobe Lightroom, an excellent RAW photo editor and organizer that's easy to use and looks fantastic.
For our testing, we take 100 RAW files (in Nikon's .NEF file format) which have a 10-megapixel resolution, and export them as JPEG files in 1000x669 resolution, similar to most of the photos we use here on the website. Such a result could also be easily distributed online or saved as a low-resolution backup. This test involves not only scaling of the image itself, but encoding in a different image format. The test is timed indirectly using a stopwatch, and times are accurate to within +/- 0.25 seconds.

When it comes to video transcoding, one of the best offerings on the market is TMPGEnc Xpress. Although a bit pricey, the software offers an incredible amount of flexibility and customization, not to mention superb format support. From the get go, you can output to DivX, DVD, Video-CD, Super Video-CD, HDV, QuickTime, MPEG, and more. It even goes as far as to include support for Blu-ray video!
There are a few reasons why we choose to use TMPGEnc for our tests. The first relates to the reasons laid out above. The sheer ease of use and flexibility is appreciated. Beyond that, the application does us a huge favor by tracking the encoding time, so that we can actually look away while an encode is taking place and not be afraid that we'll miss the final encoding time. Believe it or not, not all transcoding applications work like this.
For our test, we take a 0.99GB high-quality DivX H.264 AVI video of Half-Life 2: Episode Two gameplay with stereo audio and transcode it to the same resolution of 720p (1280x720), but lower the bit rate in order to attain a modest file size. This test also utilizes the SSE instruction sets, either SSE2 or SSE4, depending on what the chip supports.

Like the tests on the previous page, our i7-975 had note-worthy gains, but each result above was expected.
While TMPGEnc XPress' purpose is to convert video formats, ProShow from Photodex helps turn your collection of photos into a fantastic-looking slide show. I can't call myself a slide show buff, but this tool is unquestionably definitive. It offers many editing abilities and the ability to export in a variety of formats, including a standard video file, DVD video and even HD video.
Like TMPGEnc and many other video encoders, ProShow can take full advantage of a multi-core processor. It doesn't support SSE4 however, but hopefully will in the future as it would improve encoding times considerably. Still, when a slide show application handles a multi-core processor effectively, it has to make you wonder why there is such a delay in seeing a wider-range of such applications on the marketplace.

This test here stresses the CPU's ability to handle multi-media instructions and data, using both MMX and SSE2/3/4 as the instruction sets of choice. The results are divided by integer, floating point and double precision, three specific numbering formats used commonly in multi-media work.

Nothing at all new here! Simple gains, and nothing out of the ordinary.
With each new processor launch, one thing that's bound to prove faster are mathematical equations, which when all said and done, plays a massive role in a lot of our computing today. The faster an equation can be completed, the faster a math-heavy process can finish.
Sandra includes applications designed to specifically test the mathematical performance of processors, with the main one being the arithmetic test.

Crypto is a major part of computing, whether you know it or not, and certain processes can prove slower than others, depending on their algorithms. User passwords on your home PC are encrypted, as are user passwords on web servers (like in our forums). Past that, crypto is used in other areas as well, such as with creating of unbreakable locks on files or assigning a hash to a particular file (like MD5).
In Sandra's Cryptography test, the results are outputted as MB/s, higher being better. Although this is somewhat of an odd metric to go by, generally speaking, the higher the number, the faster the CPU tears through the respective algorithm, which comes down to how fast a password is either encrypted, decrypted, signed, et cetera.

Most, if not all, businesses in existence have to crack open a spreadsheet at some point. Though simple in concept, spreadsheets are an ideal way to either track information or compute large calculations all in real-time. This is important when you run a business that deals with a large amount of expenses.
Although the importance of how fast a calculation takes in an Excel file is, we include results here since they heavily test the mathematical capabilities of each processor. Because Excel 2007 is completely multi-threaded (it can even take advantage of an 8-Core Skulltrail), it makes for a great benchmark to show the scaling between all of our CPUs.
I'll let Intel explain the two files we use:
Monte Carlo - This workload calculates the European Put and Call option valuation for Black-Scholes option pricing using Monte Carlo simulation. It simulates the calculations performed when a spreadsheet with input parameters is updated and must recalculate the option valuation. In this scenario we execute approximately 300,000 iterations of Monte Carlo simulation. In addition, the workload uses Excel lookup functions to compare the put price from the model with the historical market price for 50,000 rows to understand the convergence. The input file is a 70.1 MB spreadsheet.
Calculations - This workload executes approximately 28,000 sets of calculations using the most common calculations and functions found in Excel*. These include common arithmetic operations like addition, subtraction, division, rounding and square root. It also includes common statistical analysis functions such as Max, Min, Median and Average. The calculations are performed after a spreadsheet with a large dataset is updated with new values and must re-calculate many data points. The input file is a 6.2 MB spreadsheet.

Our theme doesn't change in the least here. The i7-975 is a wee bit faster than the i7-965. Hard to put a fancy spin on that!
Generally speaking, the faster the processor, the higher the system-wide bandwidth and the lower the latency. As is always the case, faster is better when it comes to processors, as we'll see below. But with Core i7, the game changes up a bit.
Whereas previous memory controllers utilized a dual-channel operation, Intel threw that out the window to introduce triple-channel, which we talked a lot about at August's IDF. Further, since Intel integrates the IMC onto the die of the new CPUs, benefits are going to be seen all-around.
Before jumping into the results, we already had an idea of what to expect, and just as we did, the results seen are nothing short of staggering.


As far as I'm concerned, benchmarking for memory bandwidth is almost a moot point, because at some point, we hit a wall when the real-world benefits will stop being increased. In the case of AMD, their integrated memory controller avails us more than enough bandwidth, out-performing Intel's entire Core 2 line-up with absolute ease. It falls a bit short of Intel's triple-channel configuration, but that was to be expected. Again though, anything over 5,000MB/s is very unlikely to benefit a regular consumer.
The latency though, is far more important. The faster the instructions can get sent from the processor to the memory, and vice versa, the better. For the most part, no CPU here is truly lacking, except maybe the E5200 and X2 7750, as they have very high latencies. The rest of the results are fairly equal latency-wise across all Intel and AMD CPUs.
How fast can one core swap data with another? It might not seem that important, but it definitely is if you are dealing with a true multi-threaded application. The faster data can be swapped around, the faster it's going to be finished, so overall, inter-core speeds are important in every regard.
Even without looking at the data, we know that Core i7 is going to excel here, for a few different reasons. The main is the fact that this is Intel's first native Quad-Core. Rather than have two Dual-Core dies placed beside each other, i7 was built to place four cores together, so that in itself improves things. Past that, the ultra-fast QPI bus likely also has something to do with speed increases.

This test is where we can see huge differences between AMD's and Intel's CPUs, with Intel being the clear leader in both inter-core bandwidth and latencies. How much this matters in the grand scheme, but seeing as AMD's offerings scale quite well in multi-threaded benchmarks, I'm assuming it's not much. Still, it's rather interesting to see such staggering differences between the architectures here.
While some popular game franchises are struggling to keep themselves healthy, Call of Duty doesn't have much to worry about. This is Treyarch's third go at a game in the series, and a first for one that's featured on the PC. All worries leading up to this title were all for naught, though, as Treyarch delivered on all promises.
To help keep things fresh, CoD: World at War focuses on battles not exhaustively explored in previous WWII-inspired games. These include battles which take place in the Pacific region, Russia and Berlin, and variety is definitely something this game pulls off well, so it's unlikely you'll be off your toes until the end of the game.
For our testing, we use a level called "Relentless", as it's easily one of the most intensive levels in the game. It features tanks, a large forest environment and even a few explosions. This level depicts the Battle of Peleliu, where American soldiers advance to capture an airstrip from the Japanese. It's a level that's both exciting to play and one that can bring even high-end systems to their knees.

Luckily for hardcore CoD players, the game's performance doesn't change with a faster CPU, which is rather impressive. Here, the game ran just as well on our lowly E5200 as it did on our QX9770.
The original Half-Life 2 might have first seen the light of day close to four years ago, but it's still arguably one of the greatest-looking games ever seen on the PC. Follow-up versions, including Episode One and Episode Two, do well to put the Source Engine upgrades to full use. While playing, it's hard to believe that the game is based on a four+ year old engine, but it still looks great and runs well on almost any GPU purchased over the past few years.
Like Call of Duty 4, Half-Life 2: Episode Two runs well on modest hardware, but a recent mid-range graphics card is recommended if you wish to play at higher than 1680x1050 or would like to top out the available options, including anti-aliasing and very high texture settings.
This game benefits from both the CPU and GPU, and the skies the limit. In order to fully top out the available settings and run the highest resolution possible, you need a very fast GPU or GPUs along with a fast processor. Though the in-game options go much higher, we run our tests with 4xAA and 8xAF to allow the game to remain playable on the smaller mid-range cards.

Unlike CoD, HL2: Episode Two does love extra CPU power, and that's evidenced above, but only at the highly-sporadic 1680x1050 resolution. That resolution has proven to be a chore, because the average FPS can fluctuate a great deal. What's important to note here is that at our top setting of 2560x1600, the differences are almost zero.
As PC enthusiasts, we tend to be drawn to games that offer spectacular graphics... titles that help reaffirm your belief that shelling out lots of cash for that high-end monitor and PC was well worth it. But it's rare when a game comes along that is so visually-demanding, it's unable to run fully maxed out on even the highest-end systems on the market. In the case of the original Crysis, it's easy to see that's what Crytek was going for.
Funny enough, even though Crysis was released close to a year ago, the game today still has difficulty running at 2560x1600 with full detail settings - and that's even with overlooking the use of anti-aliasing! Luckily, Warhead is better optimized and will run smoother on almost any GPU, despite looking just as gorgeous as its predecessor, as you can see in the screenshot below.
The game includes four basic profiles to help you adjust the settings based on how good your system is. These include Entry, Mainstream, Gamer and Enthusiast - the latter of which is for the biggest of systems out there, unless you have a sweet graphics card and are only running 1680x1050. We run our tests at the Gamer setting as it's very demanding on any current GPU and is a proper baseline of the level of detail that hardcore gamers would demand from the game.

Our previous games didn't show real differences between CPUs, and Crysis Warhead is no different. You can be rest-assured that no matter your PC, this game is going to run like molasses!
Although we generally shun automated gaming benchmarks, we do like to run at least one to see how our GPUs scale when used in a 'timedemo'-type scenario. Futuremark's 3DMark Vantage is without question the best such test on the market, and it's a joy to use, and watch. The folks at Futuremark are experts in what they do, and they really know how to push that hardware of yours to its limit.
The company first started out as MadOnion and released a GPU-benchmarking tool called XLR8R, which was soon replaced with 3DMark 99. Since that time, we've seen seven different versions of the software, including two major updates (3DMark 99 Max, 3DMark 2001 SE). With each new release, the graphics get better, the capabilities get better and the sudden hit of ambition to get down and dirty with overclocking comes at you fast.
Similar to a real game, 3DMark Vantage offers many configuration options, although many (including us) prefer to stick to the profiles which include Performance, High and Extreme. Depending on which one you choose, the graphic options are tweaked accordingly, as well as the resolution. As you'd expect, the better the profile, the more intensive the test.
Performance is the stock mode that most use when benchmarking, but it only uses a resolution of 1280x1024, which isn't representative of today's gamers. Extreme is more appropriate, as it runs at 1920x1200 and does well to push any single or multi-GPU configuration currently on the market - and will do so for some time to come.


The results here are just as we expected. Generally, the better the CPU, the higher the score. The overall 3DMark Score doesn't vary much, however, as the benchmark doesn't weigh the CPU score that heavily, which after taking a look at our three games tested here, is a good thing.
Before discussing results, let's take a minute to briefly discuss what I consider to be a worthwhile overclock. As I've mentioned in past content, I'm not as interested in finding the highest overclock possible as much as I am interested in finding the highest stable overclock. To me, if an overclock crashes the computer after a few minutes of running a stress-test, it has little value except for competition.
How we declare an overclock stable is simple... we stress it as hard as possible for a certain period of time, both with CPU-related tests and also GPU-related, to conclude on what we'll be confident is 100% stability throughout all possible computing scenarios.
For the sake of CPU stress-testing, we use IntelBurnTest, for reasons I've laid out in a recent forum thread. Compared to other popular CPU stress-testers, IBT's tests are far more gruelling, and proof of that is seen by the fact that it manages to heat the CPU up to 20°C hotter than competing applications, like SP2004. Also, despite its name, IntelBurnTest is just as effective on AMD processors. Generally, if the CPU survives the first half-hour of this stress, there's a good chance that it's mostly stable, but I strive for a 12 hour stress as long as time permits.
If the CPU stress passes without error, then GPU stress-testing begins, in order to assure a system-wide stable overclock. To test for this, 3DMark Vantage's Extreme test is used, with the increased resolution of 2560x1600, looped nine times. If this passes, some time is dedicated to real-world game testing, to make sure that gaming is just as stable as it would be if the CPU were at stock. If both these CPU and GPU tests pass without issue, we can confidently declare a stable overclock.
Due to various factors (namely Computex), I didn't spend as much time overclocking the i7-975 as I would have liked, although it took me no time whatsoever to hit an amazing clock. As I've mentioned in many other CPU reviews, a huge limiting factor for me is overclocking in a warm room, and as you'd imagine, heat doesn't go too well with that.
Normally I like to show a fully 100% stable overclock, but given the temps I received, it's really difficult to keep temperatures in check even at 3.6GHz. However, from what I've seen at Computex thus far, 4.0GHz stable is not an unreachable goal on the i7-975, not by a long-shot.

The overclock you see above is the absolute first one that I tried, and when it successfully booted into Windows, I almost dropped my jaw. Even more surprising was benchmarking Cinebench and 3DMark Vantage many times over, only to retain full OS stability.
After some investigation, it turns out that the CPU was indeed throttling due to temperatures, and in Cinebench, the CPU would drop down to around 4.0GHz, whereas with a more robust benchmark like LinX, it'd drop to 3.7GHz. Even at 3.7GHz however, it was completely stable with LINPACK testing for hours, and that in itself is impressive.
It's been rumored that Intel made minor changes to the i7-975 to improve overclocking, but it's hard to say for sure without touching many different samples. From my overclock above, however, I'd be willing to believe that it's true.
It goes without saying that power efficiency is at the forefront of many consumers' minds today, and for good reason. Whether you are trying to save money or the environment - or both - it's good to know just how much effort certain vendors are putting into their products to help them excel in this area. Both AMD and Intel have worked hard to develop efficient chips, and that's evident with each new launch. The CPUs are getting faster, and use less power, and hopefully things will stay that way.
To help see what kind of wattage a given processor draws on average, we use a Kill-A-Watt that's plugged into a power bar that's in turn plugged into one of the wall sockets, with the test system plugged directly into that. The monitor and other components are plugged into the other socket and is not connected to the Kill-A-Watt. For our system specifications, please refer to our methodology page.
To test, the computer is first boot up and left to sit at idle for five minutes, at which point the current wattage is recorded if stable. To test for full CPU load, IntelBurnTest is run with maximum memory stress for a total of five minutes. During that run, the highest point the wattage reaches on the meter is captured and becomes our "Max Load". For i7, we use eight instances of SP2004 instead of IntelBurnTest, as the latter is not yet fully compatible with the newer processors.

There are some interesting numbers here. Our i7-975 sample actually drew less power overall than the slower i7-965. It's apparent that Intel did make some refinements, and these same refinements may be why the i7-975 is set out to top the overclocking charts.
When asked to take a look at a speed-bumped processor, it's sometimes (alright, always) difficult to create an interesting piece of content. After all, speed bumped generally means a boost in frequency, and really, anyone with a calculator could have estimated the gains to be seen from the i7-975 over the i7-965.
It is however nice to see a follow-up i7 model or two though, as it's been a little while since the launch. Even if the differences are minute, simply seeing a new model can help keep things fresh, and if you are willing to go high-end, then the i7-975 will certainly not disappoint.
Whether or not refinements have actually been made to the i7-975 for overclocking purposes, I'm unsure, but given that I hit 4.2GHz with absolutely minimal effort (it was my first setting, after all) leads me to believe that there was. Up to this point, the top overclock for i7 has been just under 6GHz, so we'll have to wait and see if we'll see new world records hit on i7 thanks to the new model.
Though we didn't have a model on-hand, the i7-950 is an interesting beast. It should effectively replace the i7-940 entirely rather quickly, so anyone who purchases one will essentially be getting more for their money. At 3.06GHz, it really doesn't fall behind the i7-965, which launched for $400 more just seven months ago. The i7-920 is still likely to remain the most popular model for a while though, and for good reason.
Have a comment you wish to make on this article? Recommendations? Criticism? Feel free to head over to our related thread and put your words to our virtual paper! There is no requirement to register in order to respond to these threads, but it sure doesn't hurt!
Copyright © 2005-2009 Techgage Networks Inc. - All Rights Reserved.