- Qualcomm Launches Snapdragon 4 Gen 2 Mobile Platform
- AMD Launches Ryzen PRO 7000 Series Mobile & Desktop Platform
- Intel Launches Sleek Single-Slot Arc Pro A60 Workstation Graphics Card
- NVIDIA Announces Latest Ada Lovelace Additions: GeForce RTX 4060 Ti & RTX 4060
- Maxon Redshift With AMD Radeon GPU Rendering Support Now Available
Social & RSS Feeds
Latest Videos


Latest News
A Look At AMD’s Radeon RX Vega 64 Workstation & Compute Performance
by Rob Williams on August 14, 2017 in Graphics & Displays
After months and months of anticipation, AMD’s RX Vega series has arrived. The first model out-of-the-gate is the RX Vega 64, going up against the GTX 1080 in gaming. In lieu of a look at gaming to start our Vega coverage, we decided to go the workstation route – and we’re glad we did. Prepare yourself to be decently surprised.
Page 5 – Sandra: Cryptography, Science, Finance & Bandwidth
On the previous page, I mentioned that SPEC is an organization that crafts some of the best, most comprehensive benchmarks going, and in a similar vein, I can compliment SiSoftware. This is a company that thrives on offering support for certain technologies before those technologies are even available to the consumer. In that regard, its Sandra benchmark might seem a little bleeding-edge, but at the same time, its tests are established, refined, and accurate across multiple runs.
While Sandra offers a huge number of benchmarks, just four of the GPU ones are focused on: Cryptography, Financial Analysis, Scientific Analysis, and also memory bandwidth. Some of the results are a bit too complex for a graph, so a handful of tables are coming your way.

Cryptography
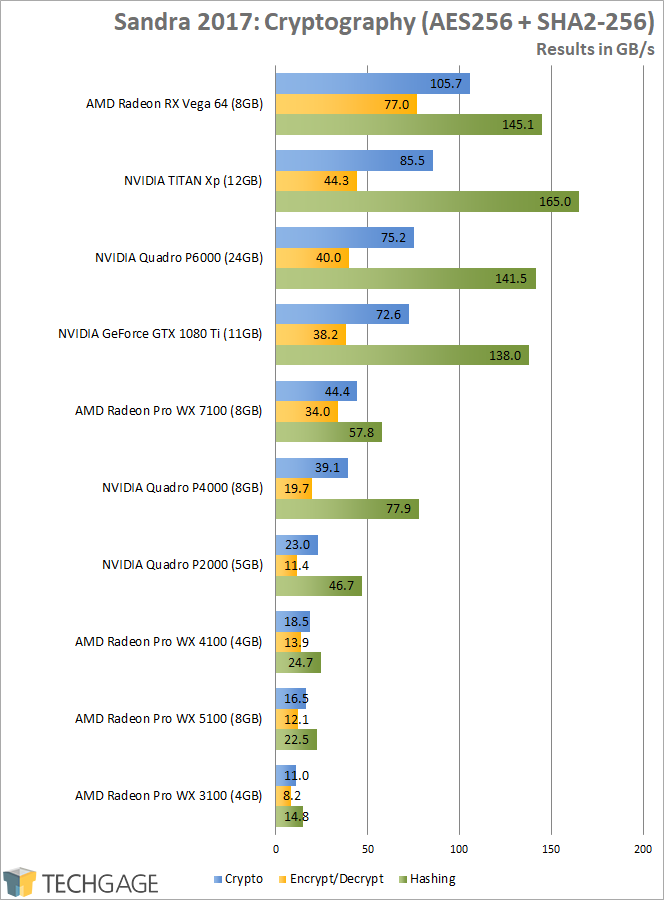
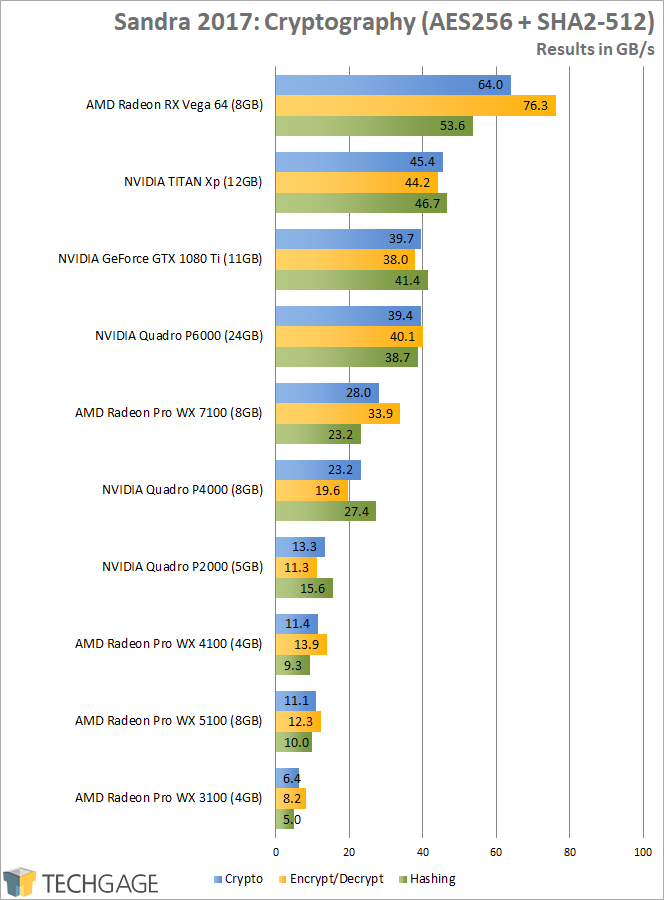
Hot damn. I feel like these kinds of gains are those that AMD should promote out the wazoo. So many reviews posted today are likely to paint a rough picture of this card’s gaming performance, but on the other side of the fence, compute performance on Vega quite simply kicks ass. The results here may be able to give an impression of Vega 64’s future mining performance. Mining benchmarks you’ll see around the web in other launch reviews will show an edge over a top-end NVIDIA card. I would not be surprised if AMD optimizes its driver sometime in the future to vastly improve mining performance. Vega should technically be better than the 30MH/s you’ll see reported today, based on all of the compute performance seen here.
Financial Analysis
| Sandra 2017 – Financial Analysis (FP32) | |||
| Black-Scholes | Binomial | Monte Carlo | |
| NVIDIA TITAN Xp | 14 G/s | 2.5 M/s | 6.7 M/s |
| NVIDIA Quadro P6000 | 11.6 G/s | 2.3 M/s | 6.5 M/s |
| NVIDIA GeForce GTX 1080 Ti | 11.6 G/s | 2.2 M/s | 6 M/s |
| AMD Radeon RX Vega 64 | 9.4 G/s | 3 M/s | 4.4 M/s |
| NVIDIA Quadro P4000 | 6.5 G/s | 1.1 M/s | 2.9 M/s |
| AMD Radeon Pro WX 7100 | 5.2 G/s | 1.3 M/s | 1.9 M/s |
| NVIDIA Quadro P2000 | 3.8 G/s | 656 k/s | 1.8 M/s |
| AMD Radeon Pro WX 5100 | 3.4 G/s | 478 k/s | 672 k/s |
| AMD Radeon Pro WX 4100 | 2.2 G/s | 531 k/s | 773 k/s |
| AMD Radeon Pro WX 3100 | 2.5 G/s | 321 k/s | 467 k/s |
| Results in options-per-second. 1 GOPS = 1,000 MOPS; 1 MOPS = 1,000 kOPS. | |||
| Sandra 2017 – Financial Analysis (FP64) | |||
| Black-Scholes | Binomial | Monte Carlo | |
| AMD Radeon RX Vega 64 | 2.2 G/s | 186 k/s | 542 k/s |
| NVIDIA TITAN Xp | 1.44 G/s | 142 k/s | 297 k/s |
| NVIDIA Quadro P6000 | 1.3 G/s | 131 k/s | 271 k/s |
| NVIDIA GeForce GTX 1080 Ti | 1.3 G/s | 134 k/s | 272 k/s |
| NVIDIA Quadro P4000 | 622 M/s | 63 k/s | 129 k/s |
| AMD Radeon Pro WX 7100 | 958 M/s | 81 k/s | 239 k/s |
| NVIDIA Quadro P2000 | 360 M/s | 36 k/s | 75 k/s |
| AMD Radeon Pro WX 5100 | 406 M/s | 49 k/s | 97 k/s |
| AMD Radeon Pro WX 4100 | 395 M/s | 35 k/s | 98 k/s |
| AMD Radeon Pro WX 3100 | 219 M/s | 18 k/s | 55 k/s |
| Results in options-per-second. 1 GOPS = 1,000 MOPS; 1 MOPS = 1,000 kOPS. | |||
The RX Vega 64 continues to perform extremely well in compute tests, slotting in just behind the 1080 Ti in single-precision, and leading the pack in a very significant way in the double-precision test. That’s thanks to the fact that Vega’s architecture delivers 1:16 the performance of single-precision, in double-precision, vs. NVIDIA’s 1:32.
Scientific Analysis
| Sandra 2017 – Scientific Analysis (FP32) | |||
| GEMM | FFT | N-Body | |
| NVIDIA Quadro P6000 | 6.4 TFLOPS | 495 GFLOPS | 5.9 TFLOPS |
| NVIDIA TITAN Xp | 7 TFLOPS | 258 GFLOPS | 5.5 TFLOPS |
| AMD Radeon RX Vega 64 | 6 TFLOPS | 344 GFLOPS | 5.3 TFLOPS |
| NVIDIA GeForce GTX 1080 Ti | 6 TFLOPS | 217 GFLOPS | 5.12 TFLOPS |
| NVIDIA Quadro P4000 | 3.1 TFLOPS | 128 GFLOPS | 2.7 TFLOPS |
| AMD Radeon Pro WX 7100 | 2.5 TFLOPS | 210 GFLOPS | 2.2 TFLOPS |
| NVIDIA Quadro P2000 | 1.8 TFLOPS | 87 GFLOPS | 1.7 TFLOPS |
| AMD Radeon Pro WX 5100 | 945 GFLOPS | 138 GFLOPS | 755 GFLOPS |
| AMD Radeon Pro WX 4100 | 1 TFLOPS | 85 GFLOPS | 917 GFLOPS |
| AMD Radeon Pro WX 3100 | 670 GFLOPS | 70 GFLOPS | 647 GFLOPS |
| GEMM = General Matrix Multiply; FFT = Fast Fourier Transform; N-Body = N-Body Simulation. | |||
| Sandra 2017 – Scientific Analysis (FP64) | |||
| GEMM | FFT | N-Body | |
| AMD Radeon RX Vega 64 | 611 GFLOPS | 164 GFLOPS | 475 GFLOPS |
| NVIDIA TITAN Xp | 352 GFLOPS | 199 GFLOPS | 277 GFLOPS |
| NVIDIA GeForce GTX 1080 Ti | 332 GFLOPS | 163 GFLOPS | 267 GFLOPS |
| NVIDIA Quadro P6000 | 323 GFLOPS | 128 GFLOPS | 253 GFLOPS |
| NVIDIA Quadro P4000 | 156 GFLOPS | 95 GFLOPS | 127 GFLOPS |
| AMD Radeon Pro WX 7100 | 276 GFLOPS | 80 GFLOPS | 194 GFLOPS |
| NVIDIA Quadro P2000 | 90 GFLOPS | 53 GFLOPS | 84 GFLOPS |
| AMD Radeon Pro WX 5100 | 123 GFLOPS | 56 GFLOPS | 103 GFLOPS |
| AMD Radeon Pro WX 4100 | 109 GFLOPS | 33 GFLOPS | 84 GFLOPS |
| AMD Radeon Pro WX 3100 | 63 GFLOPS | 33 GFLOPS | 49 GFLOPS |
| GEMM = General Matrix Multiply; FFT = Fast Fourier Transform; N-Body = N-Body Simulation. | |||
With its beefy double-precision performance (as far as gaming cards go, at least), Vega 64 soars to the top of that respective chart, and manages to best the 1080 Ti in single-precision.
Bandwidth
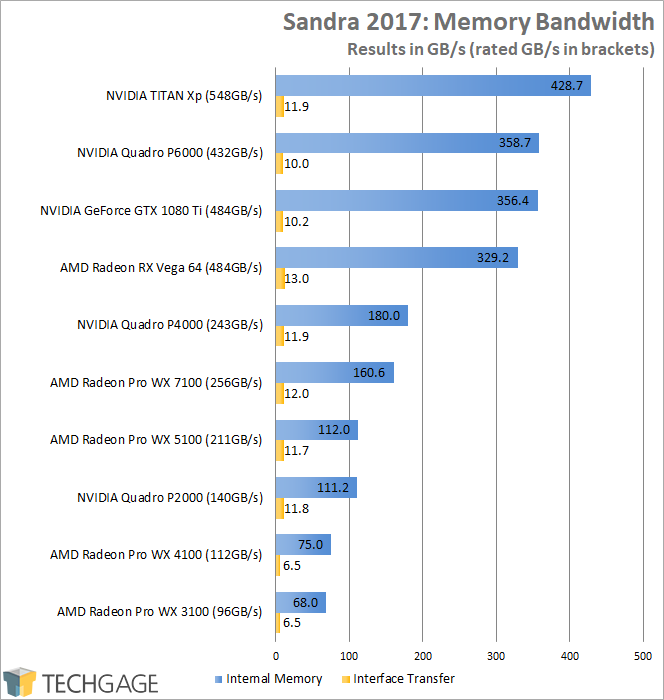
With its HBM2 memory in tow, the RX Vega 64 places right behind NVIDIA’s GTX 1080 Ti, by about 27GB/s. Its interface transfer, however, manages to best everything else in the lineup. How this correlates to real-world performance is hard to gauge, especially since it’s up to the rest of a GPU’s architecture to properly complement the bandwidth it’s given.

Support our efforts! With ad revenue at an all-time low for written websites, we're relying more than ever on reader support to help us continue putting so much effort into this type of content. You can support us by becoming a Patron, or by using our Amazon shopping affiliate links listed through our articles. Thanks for your support!

Rob Williams
Rob founded Techgage in 2005 to be an 'Advocate of the consumer', focusing on fair reviews and keeping people apprised of news in the tech world. Catering to both enthusiasts and businesses alike; from desktop gaming to professional workstations, and all the supporting software.


