- Qualcomm Launches Snapdragon 4 Gen 2 Mobile Platform
- AMD Launches Ryzen PRO 7000 Series Mobile & Desktop Platform
- Intel Launches Sleek Single-Slot Arc Pro A60 Workstation Graphics Card
- NVIDIA Announces Latest Ada Lovelace Additions: GeForce RTX 4060 Ti & RTX 4060
- Maxon Redshift With AMD Radeon GPU Rendering Support Now Available
Social & RSS Feeds
Latest Videos


Latest News
A Performance Review: AMD’s Ryzen 5 2600X & Ryzen 7 2700X Processors
by Rob Williams on April 19, 2018 in Processors
Following a deluge of leaks, AMD’s 2nd-gen Ryzen ‘Pinnacle Ridge’ CPUs have landed. These new ‘Zen+’ chips are built on a 12nm process, and bring in a brand-new chipset (even though the older chipset will work just fine!). Read on as we take a look at both the 8-core Ryzen 7 2700X, and 6-core Ryzen 5 2600X.
Page 7 – Linux: Blender, HandBrake & Phoronix Test Suite
(All of our tests are explained in detail on page 2.)
To wrap up our look at performance, we have a bunch of Linux test results to pore over. These include two of the same test found in the Windows suite (HandBrake, Blender).
The OS used in testing is Ubuntu 17.10, using the stock 4.13 kernel. As with the Windows tests, the Linux OS is kept as minimal as possible, with only required software packages installed on top of the stock software. HandBrake is procured through Ubuntu’s repository, while Blender is grabbed from the official source. Version 7.6 of the Phoronix Test Suite is also used.
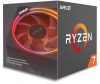
Blender & HandBrake
It’s performance results like these that make me think one of the reasons Ryzen chips don’t cost $100 more than they do is because of their weaker IPC performance. In so many tasks, outside of things like gaming, the extra cores on a chip like the 2700X helps it stomp the 6-core i7-8700K, even though that chip carries an SRP price tag about $20 higher.
Even the $219 2600X impresses. It finds parity on the core/thread front with the 8700K, but doesn’t fall as far behind it as the 8700K falls behind the 2700X. Seeing as how Threadripper’s 16-cores weren’t enough to beat out Intel’s 10-core, Intel has a clear advantage in these tests, but AMD’s perf-to-$ ratio is strong enough to keep it super-competitive.
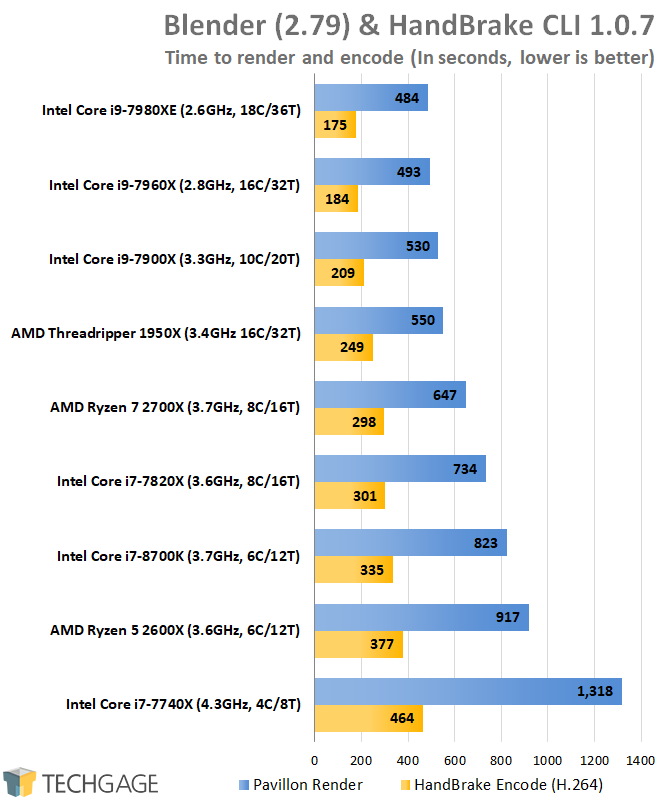
Phoronix Test Suite
Like some other tests strewn throughout this article, compiling can take great advantage of both strong IPC performance and as many cores as I’ve ever personally been able to throw at it. In the case of a chip like Threadripper, it sits behind the 16-core Intel equivalent, but not to the degree you’d expect between $1,699 and $999 offerings.
A general rule of thumb, then, is that cores-for-cores, Intel is going to be faster, and offer the “ultimate” level of performance to those who demand it, but based on the chips in this particular list, AMD’s value proposition appears to me to be better. Look at the $219 2600X in comparison to the $319 7740X, an oddball chip that requires an enthusiast platform to be used.
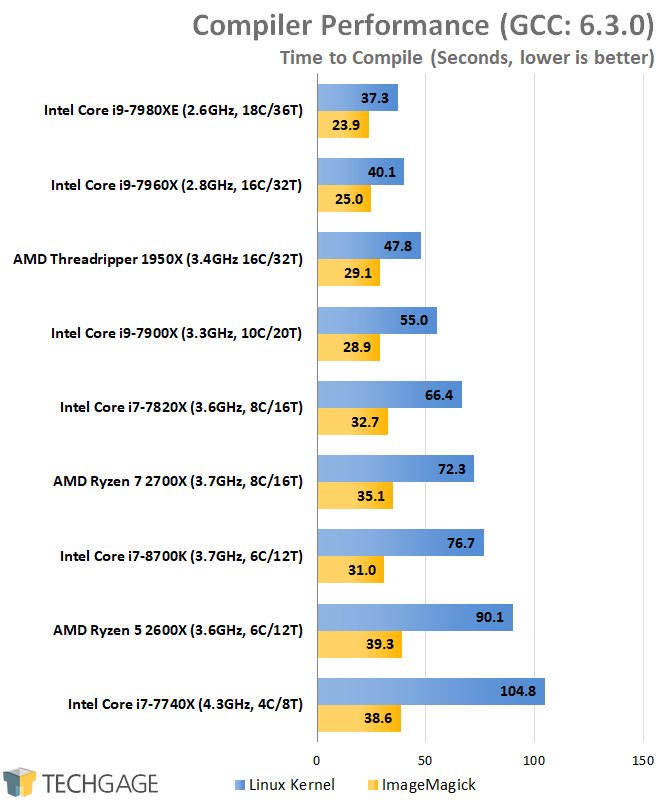
With ray tracing tests, we see very similar scaling, and explicit scaling in terms of where each GPU ranks. However, there are a couple of result discrepancies that are easy to miss. Threadripper, for example, performs exceptionally well in the smallpt test, beating out everything else in the lineup. Intel strikes back with tachyon, but even falls a bit short with cray.
The 2600X continues to be a force to be reckoned with at the low end, delivering great performance for its price-point, once again beating out the 7740X in every single test. It also manages to best the 8700K in smallpt and cray, so AMD definitely has a few tricks up its sleeves.
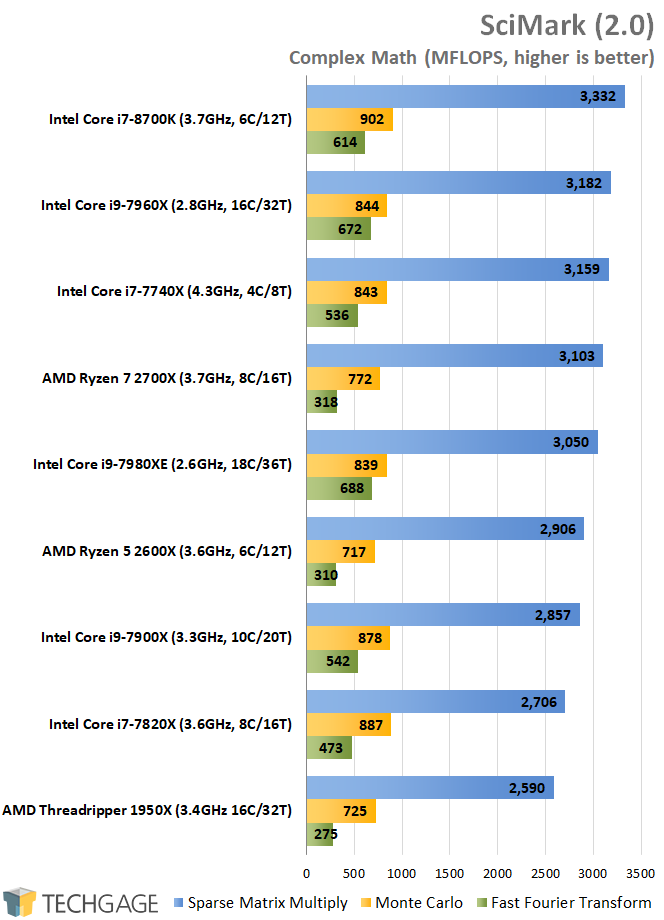
SciMark’s tests are entirely single-threaded, so IPC matters an awful lot here, as evidenced by the six-core 8700K sitting at the top. AMD performance is lacking pretty substantially in the FFT test, but the Ryzens perform fairly in the others. Aside from Threadripper 1950X, that is; its lower clock speed is a death sentence for a single-threaded suite like this.
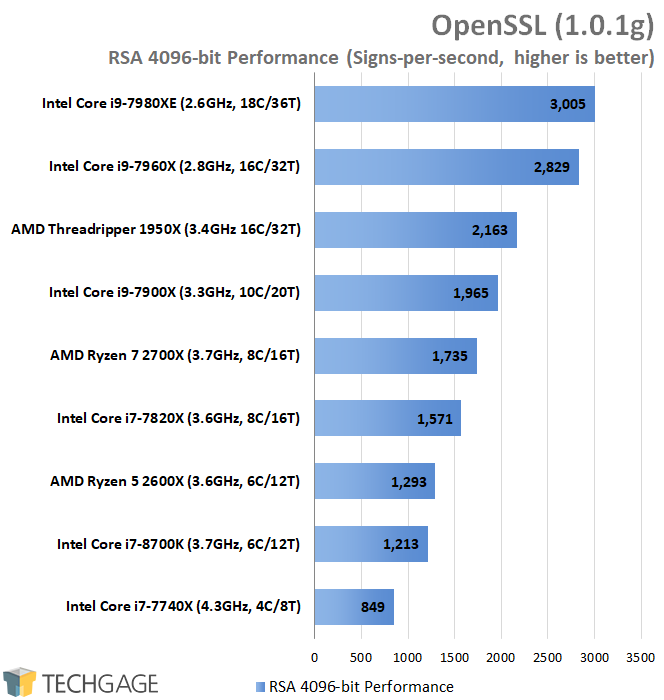
In some tests, IPC matters just as much as core count, and OpenSSL is one such test. Core for core, Intel comes well ahead of AMD with the 16 core options, but dollar for dollar, AMD can keep ahead. This is also an example of where extra cores can help substantially, as the 2700X again trounces the 8700K. And, in case you missed it: so does the 2600X. Phreaking great performance.
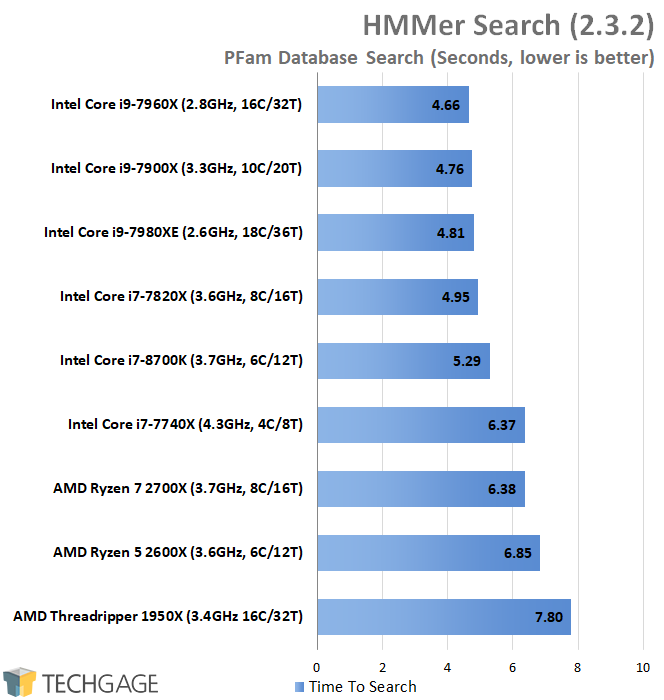
It’s HMMer time, with another single-threaded test that ekes every little bit of IPC performance you can give it. As such, Intel reigns supreme here, with all three of the Ryzen chips occupying the bottom end of the chart. Not the kind of hammering AMD would like to see, I’m sure.
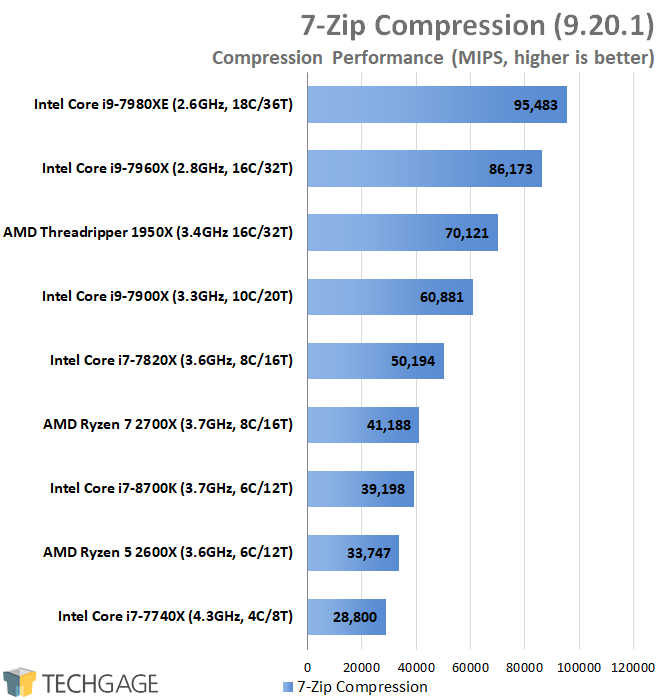
For straight-forward compression that can take advantage of many cores, it really does boil down to the fact that the more cores you have, the better the performance. But, Intel clearly has a strong performance advantage here, really notable when you compare the two 16-core chips. However, looking at the value proposition again, the 2700X still managed to place ahead of the 8700K by a few percentage points.
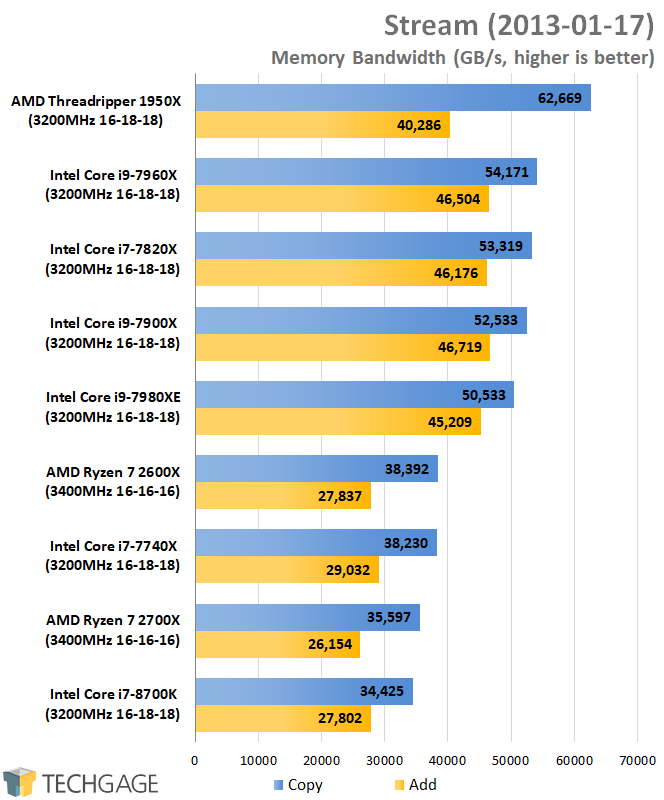
Considering the fact that the Ryzen 2 chips here were running the fastest memory of any one of the other configurations (3400MHz vs. 3200MHz), these results surprise me. Well, there’s actually more than one reason for that: the 2600X outperforms the 2700X. With Sandra, covered earlier, the 2600X keeps ahead as well, but barely – not to this kind of degree.
I upgraded the Linux kernel from 4.13 to 4.17 in hopes it’d give more expected scaling here, but not so. This is not to make it seem like 38GB/s vs. 35GB/s is actually a big deal, but it’s definitely more so of one on Ryzen than it is on Intel. Fortunately, the performance results in the multi-threaded tests don’t seem to care about that discrepancy too much.
| John The Ripper (Encryption) | |||
| Blowfish | MD5 | DES | |
| Intel Core i9-7980XE | 31.3K | 395.0K | 101.6M |
| Intel Core i9-7960X | 29.5K | 373.1K | 95.7M |
| AMD Ryzen Threadripper 1950X | 23.2K | 363.0K | 26.0M |
| Intel Core i9-7900X | 20.5K | 259.1K | 66.9M |
| Intel Core i7-7820X | 16.5K | 207.5K | 53.7M |
| AMD Ryzen 7 2700X | 14.1K | 462.2K | 61.0M |
| Intel Core i7-8700K | 12.7K | 159.7K | 41.6M |
| AMD Ryzen 5 2600X | 10.4K | 346.8K | 45.7M |
| Intel Core i7-7740X | 8.9K | 112.0K | 26.7M |
On all fronts, AMD’s 8-core 2700X delivers enough oomph to rank above the 8700K in this list; and, in another repeat, the lowly 6-core AMD outpaces the 4-core 7740X, despite costing $100 (SRP) less. Results like any of those seen on this page definitely adds some intrigue to Zen 2, which is surely going to add more of a substantial IPC boost than these second-gen Pinnacle Ridge chips do.

Support our efforts! With ad revenue at an all-time low for written websites, we're relying more than ever on reader support to help us continue putting so much effort into this type of content. You can support us by becoming a Patron, or by using our Amazon shopping affiliate links listed through our articles. Thanks for your support!

Rob Williams
Rob founded Techgage in 2005 to be an 'Advocate of the consumer', focusing on fair reviews and keeping people apprised of news in the tech world. Catering to both enthusiasts and businesses alike; from desktop gaming to professional workstations, and all the supporting software.


