- Qualcomm Launches Snapdragon 4 Gen 2 Mobile Platform
- AMD Launches Ryzen PRO 7000 Series Mobile & Desktop Platform
- Intel Launches Sleek Single-Slot Arc Pro A60 Workstation Graphics Card
- NVIDIA Announces Latest Ada Lovelace Additions: GeForce RTX 4060 Ti & RTX 4060
- Maxon Redshift With AMD Radeon GPU Rendering Support Now Available
Social & RSS Feeds
Latest Videos


Latest News
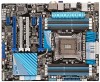
ASUS P9X79 PRO Motherboard Review
by Rob Williams on March 22, 2013 in Motherboards
Intel’s X79 platform may seem a little dated by this point, but it in fact remains the best choice for those needing to build the biggest, baddest PCs around – especially with Ivy Bridge-E likely 9+ months away. Complementing X79’s goals perfectly is ASUS’ P9X79 PRO, a motherboard that offers a rich feature-set in both hardware and software.
Page 5 – Performance Testing
From a performance perspective, we feel that motherboard benchmarking is useless. It’s the motherboard’s job to allow all of the installed hardware to operate at its full potential, so in theory, a $100 option shouldn’t be much (or any) slower than a $300 one. The differences in price instead come down to the quality of the on-board components and other features.
So why do it at all, then? We still perform benchmarks because it’s important to make sure that the board we’re dealing with doesn’t lack in one particular area versus the rest. If board A performs 2% slower than board B in PCMark 7, for example, that’s of no concern to us – random variance is a fact of life with benchmarking. However, if one board consistently performs weaker than the rest, that’s worthy of note – it could suggest that weaker components have been used which do not allow the hardware to operate at its full potential.
Please bare this all in mind when perusing our results. Just because a board under-performs in a single test, it doesn’t mean anything with regards to its quality as a whole. Our ultimate goal here is to make sure that each board we test performs as we’d expect across the gamut of scenarios we pit them against.
| Intel LGA2011 Test System | |
| Processor | Intel Core i7-3960X – Six-Core, 3.30GHz, Default Voltage |
| Motherboard | ASUS P9X79 PRO (BIOS: ‘3305’ 01/10/2013) MSI X79A-GD65 8D (BIOS: ‘F14’ 08/23/2012) |
| Memory | Kingston HyperX Genesis 4x4GB – DDR3-1333 9-9-9-24 Kingston HyperX Predator 8x8GB – DDR3-2133 11-12-11-32 |
| Graphics | AMD Radeon HD 7770 2GB GHz Edition (Catalyst 13.1 Driver) |
| Audio | On-Board Audio |
| Storage | Corsair Force F160 160GB Solid-State Drive (OS Drive) Kingston HyperX 240 Solid-State Drive (I/O Testing) |
| Power Supply | Corsair HX850W |
| Chassis | Corsair Obsidian 700D Full-Tower |
| Cooling | Corsair H70 Self-Contained Liquid Cooler |
| Et cetera | Windows 7 Professional 64-bit |
With Windows 8 having hit the market this past fall, I had considered moving our test-benches on over. However, because the differences between the OSes are minimal, and also because Windows 8 kind of adds more complexity to our testing with its Start screen, we’re preferring to stick with Windows 7 for the time-being. Depending on how Microsoft’s roadmap looks at the time, we may decide to hop on over to Windows Blue when it arrives (aka: Windows 8.1).
One trick that some vendors have liked to play in the past is to increase their Base Clock ever-so-slightly so as to give their board an edge over the others. With a multiplier of 35, even a single 1MHz BCLK increase can result in seconds being shaved off of most benchmarks. It’s for this reason that we perform this simple check before evaluating the performance.
| BCLK Values | Result |
| ASUS P9X79 PRO | 100.1 MHz |
| MSI X79A-GD65 8D | 100.0 MHz |
All checks out – let’s move on.
General System Performance
To take a look at the “overall” performance of our PC configuration, we rely on a simple Windows boot test (cold boot > usable desktop) and dual Futuremark suites; PCMark 7 and 3DMark 11. Please note that we’re using PCMark 7 1.0.4, not the recently-released 1.4.0 (which has resulted in score changes).
| Cold Boot to Desktop | Result | ||||||||||||||||||||||||||||||||||||||||||||||||||||||||||||||||||||||||||||||||||||||||||||||||||
| ASUS P9X79 PRO | 27.70s | ||||||||||||||||||||||||||||||||||||||||||||||||||||||||||||||||||||||||||||||||||||||||||||||||||
| MSI X79A-GD65 8D | 32.47s | ||||||||||||||||||||||||||||||||||||||||||||||||||||||||||||||||||||||||||||||||||||||||||||||||||
| Lower results are better. | |||||||||||||||||||||||||||||||||||||||||||||||||||||||||||||||||||||||||||||||||||||||||||||||||||
| PCMark 7 | Test 1 | Test 2 | Test 3 | Test 4 | Test 5 | Test 6 | Test 7 | ||||||||||||||||||||||||||||||||||||||||||||||||||||||||||||||||||||||||||||||||||||||||||||
| ASUS P9X79 PRO | 23.11 | 7092.91 | 75.72 | 11.45 | 18.96 | 22.09 | 5.34 | ||||||||||||||||||||||||||||||||||||||||||||||||||||||||||||||||||||||||||||||||||||||||||||
| MSI X79A-GD65 8D | 23.07 | 7339.37 | 72.94 | 11.11 | 18.84 | 19.56 | 5.40 | ||||||||||||||||||||||||||||||||||||||||||||||||||||||||||||||||||||||||||||||||||||||||||||
| (1) Video Playback (2) Video Transcoding (3) Gaming (Graphics) (4) Image Manipulation (5) Importing Pictures (6) Web Browsing (7) Windows Defender |
|||||||||||||||||||||||||||||||||||||||||||||||||||||||||||||||||||||||||||||||||||||||||||||||||||
| PCMark 7 Suite Scores | Result | ||||||||||||||||||||||||||||||||||||||||||||||||||||||||||||||||||||||||||||||||||||||||||||||||||
| ASUS P9X79 PRO | 4994 | ||||||||||||||||||||||||||||||||||||||||||||||||||||||||||||||||||||||||||||||||||||||||||||||||||
| MSI X79A-GD65 8D | 4895 | ||||||||||||||||||||||||||||||||||||||||||||||||||||||||||||||||||||||||||||||||||||||||||||||||||
| Higher results are better. | |||||||||||||||||||||||||||||||||||||||||||||||||||||||||||||||||||||||||||||||||||||||||||||||||||
| 3DMark 11 | 3DMark | GPU | |||||||||||||||||||||||||||||||||||||||||||||||||||||||||||||||||||||||||||||||||||||||||||||||||
| ASUS P9X79 PRO | 4243 | 3793 | |||||||||||||||||||||||||||||||||||||||||||||||||||||||||||||||||||||||||||||||||||||||||||||||||
| MSI X79A-GD65 8D | 4233 | 3790 | |||||||||||||||||||||||||||||||||||||||||||||||||||||||||||||||||||||||||||||||||||||||||||||||||
| 3DMark results in points; higher is better. | |||||||||||||||||||||||||||||||||||||||||||||||||||||||||||||||||||||||||||||||||||||||||||||||||||
ASUS clearly had an advantage in the boot test here, shaving 4.5 seconds off the total time. In 3DMark, both boards resulted much the same, while MSI slid just an inch behind in our PCMark 7 testing.
I/O Performance
To properly give both the internal SATA 6Gbit/s and USB 3.0 controller a good workout, we turn to CrystalDiskMark and Iometer – the latter of which is the first benchmark in our entire test suite that we run.
| CrystalDiskMark | Read Seq. | Read 4K | Write Seq. | Write 4K | |||||||||||||||||||||||||||||||||||||||||||||||||||||||||||||||||||||||||||||||||||||||||||||||
| ASUS P9X79 PRO | 505.9 | 35.42 | 315.8 | 101.9 | |||||||||||||||||||||||||||||||||||||||||||||||||||||||||||||||||||||||||||||||||||||||||||||||
| MSI X79A-GD65 8D | 496.6 | 33.68 | 312.6 | 97.24 | |||||||||||||||||||||||||||||||||||||||||||||||||||||||||||||||||||||||||||||||||||||||||||||||
| Min/Avg/Max results in MB/s; higher is better. Latency results in ms; lower is better. | |||||||||||||||||||||||||||||||||||||||||||||||||||||||||||||||||||||||||||||||||||||||||||||||||||
| CrystalDiskMark (USB) | Read Seq. | Read 4K | Write Seq. | Write 4K | |||||||||||||||||||||||||||||||||||||||||||||||||||||||||||||||||||||||||||||||||||||||||||||||
| ASUS P9X79 PRO | 281.8 | 20.72 | 271.0 | 33.47 | |||||||||||||||||||||||||||||||||||||||||||||||||||||||||||||||||||||||||||||||||||||||||||||||
| MSI X79A-GD65 8D | 208.1 | 21.06 | 165.6 | 33.19 | |||||||||||||||||||||||||||||||||||||||||||||||||||||||||||||||||||||||||||||||||||||||||||||||
| Min/Avg/Max results in MB/s; higher is better. Latency results in ms; lower is better. | |||||||||||||||||||||||||||||||||||||||||||||||||||||||||||||||||||||||||||||||||||||||||||||||||||
| Database | Workstation | File Server | |||||||||||||||||||||||||||||||||||||||||||||||||||||||||||||||||||||||||||||||||||||||||||||||||
| Iometer 1.1.0 | Read | Write | Read | Write | Read | Write | |||||||||||||||||||||||||||||||||||||||||||||||||||||||||||||||||||||||||||||||||||||||||||||
| ASUS P9X79 PRO | 4584.94 | 2260.16 | 6073.59 | 1515.03 | 6142.27 | 1536.85 | |||||||||||||||||||||||||||||||||||||||||||||||||||||||||||||||||||||||||||||||||||||||||||||
| MSI X79A-GD65 8D | 4438.68 | 2189.20 | 5971.63 | 1492.61 | 6030.63 | 1509.26 | |||||||||||||||||||||||||||||||||||||||||||||||||||||||||||||||||||||||||||||||||||||||||||||
| Results in IOPS; higher is better. | |||||||||||||||||||||||||||||||||||||||||||||||||||||||||||||||||||||||||||||||||||||||||||||||||||
As pointed out on the previous page, ASUS’ inclusion of support for the UASP USB 3.0 protocol helps to increase overall throughput, and CDM sure proves that well here. MSI’s board does not support UASP, leading to much weaker sequential results. Fortunately for MSI, 4K results come out even.
Rendering & Image Manipulation
Writing files to disk or reading a website doesn’t do much to exercise our CPU, so for that, we turn to a couple of common scenarios; image editing, video rendering and 3D rendering, using a combination of Adobe and Autodesk products.
| Adobe Lightroom 4.1 | Result | ||||||||||||||||||||||||||||||||||||||||||||||||||||||||||||||||||||||||||||||||||||||||||||||||||
| ASUS P9X79 PRO | 441.11s | ||||||||||||||||||||||||||||||||||||||||||||||||||||||||||||||||||||||||||||||||||||||||||||||||||
| MSI X79A-GD65 8D | 441.23s | ||||||||||||||||||||||||||||||||||||||||||||||||||||||||||||||||||||||||||||||||||||||||||||||||||
| Results in seconds; lower is better. | |||||||||||||||||||||||||||||||||||||||||||||||||||||||||||||||||||||||||||||||||||||||||||||||||||
| Adobe Premiere Pro CS5.5 | Result | ||||||||||||||||||||||||||||||||||||||||||||||||||||||||||||||||||||||||||||||||||||||||||||||||||
| ASUS P9X79 PRO | 698 | ||||||||||||||||||||||||||||||||||||||||||||||||||||||||||||||||||||||||||||||||||||||||||||||||||
| MSI X79A-GD65 8D | 695 | ||||||||||||||||||||||||||||||||||||||||||||||||||||||||||||||||||||||||||||||||||||||||||||||||||
| Results in seconds; lower is better. | |||||||||||||||||||||||||||||||||||||||||||||||||||||||||||||||||||||||||||||||||||||||||||||||||||
| Autodesk 3ds Max 2011 | Result | ||||||||||||||||||||||||||||||||||||||||||||||||||||||||||||||||||||||||||||||||||||||||||||||||||
| ASUS P9X79 PRO | 1030s | ||||||||||||||||||||||||||||||||||||||||||||||||||||||||||||||||||||||||||||||||||||||||||||||||||
| MSI X79A-GD65 8D | 1058s | ||||||||||||||||||||||||||||||||||||||||||||||||||||||||||||||||||||||||||||||||||||||||||||||||||
| Results in seconds; lower is better. | |||||||||||||||||||||||||||||||||||||||||||||||||||||||||||||||||||||||||||||||||||||||||||||||||||
| Cinebench R11.5 | CPU | OpenGL | |||||||||||||||||||||||||||||||||||||||||||||||||||||||||||||||||||||||||||||||||||||||||||||||||
| ASUS P9X79 PRO | 86.17 | 10.45 | |||||||||||||||||||||||||||||||||||||||||||||||||||||||||||||||||||||||||||||||||||||||||||||||||
| MSI X79A-GD65 8D | 85.41 | 10.47 | |||||||||||||||||||||||||||||||||||||||||||||||||||||||||||||||||||||||||||||||||||||||||||||||||
| Higher results are better. | |||||||||||||||||||||||||||||||||||||||||||||||||||||||||||||||||||||||||||||||||||||||||||||||||||
Our 3ds Max run is the only one that was able to differentiate these boards in any real way, with ASUS cutting close to 3% off of the total rendering time.
Sub-system Performance
For memory and CPU throughput testing, we utilize SiSoftware’s Sandra 2012 (SP4), and for Ethernet testing, we use iperf (or more appropriately, the Java-based jperf which utilizes it). The stock memory configuration uses 4x4GB Kingston HyperX modules clocked at DDR3-1333 and using timings of 9-9-9-24. While 64GB testing isn’t going to be a common theme in our motherboard reviews, we decided to give Kingston’s 8x8GB HyperX Predator kit a test for fun. Those modules are clocked at DDR3-2133 with timings of 11-12-11-32.
| Sandra Memory | Integer | Float | Cache | Latency | |||||||||||||||||||||||||||||||||||||||||||||||||||||||||||||||||||||||||||||||||||||||||||||||
| ASUS P9X79 PRO | 34.415 GB/s | 34.431 GB/s | 196.81 GB/s | 27.4 ns | |||||||||||||||||||||||||||||||||||||||||||||||||||||||||||||||||||||||||||||||||||||||||||||||
| ASUS P9X79 PRO (8x8GB) | 49.884 GB/s | 49.892 GB/s | 234.28 GB/s | 23.1 ns | |||||||||||||||||||||||||||||||||||||||||||||||||||||||||||||||||||||||||||||||||||||||||||||||
| MSI X79A-GD65 8D | 34.830 GB/s | 34.827 GB/s | 198.33 GB/s | 27.3 ns | |||||||||||||||||||||||||||||||||||||||||||||||||||||||||||||||||||||||||||||||||||||||||||||||
| Int/Float/Cache results in GB/s; higher is better. Latency results in ns; lower is better. | |||||||||||||||||||||||||||||||||||||||||||||||||||||||||||||||||||||||||||||||||||||||||||||||||||
| Sandra Multi-Core | Cache | Latency | |||||||||||||||||||||||||||||||||||||||||||||||||||||||||||||||||||||||||||||||||||||||||||||||||
| ASUS P9X79 PRO | 36.35 GB/s | 45.7 ns | |||||||||||||||||||||||||||||||||||||||||||||||||||||||||||||||||||||||||||||||||||||||||||||||||
| MSI X79A-GD65 8D | 36.18 GB/s | 46.4 ns | |||||||||||||||||||||||||||||||||||||||||||||||||||||||||||||||||||||||||||||||||||||||||||||||||
| Cache, higher is better. Latency, lower is better. | |||||||||||||||||||||||||||||||||||||||||||||||||||||||||||||||||||||||||||||||||||||||||||||||||||
| Ethernet (iperf) | 50 Jobs (64KB) | 50 Jobs (1518KB) | |||||||||||||||||||||||||||||||||||||||||||||||||||||||||||||||||||||||||||||||||||||||||||||||||
| ASUS P9X79 PRO (Intel 82579V) | 938 | 942 | |||||||||||||||||||||||||||||||||||||||||||||||||||||||||||||||||||||||||||||||||||||||||||||||||
| MSI X79A-GD65 8D (Intel 82579V) | 939 | 944 | |||||||||||||||||||||||||||||||||||||||||||||||||||||||||||||||||||||||||||||||||||||||||||||||||
| Results in Mbit/s; higher is better. | |||||||||||||||||||||||||||||||||||||||||||||||||||||||||||||||||||||||||||||||||||||||||||||||||||
It’s become obvious over the past year or two that motherboard vendors believe Intel’s integrated NICs are the way to go for the initial LAN port. Could it be that too many Marvell’s died and caused RMAs to occur? That’d be hard to find out, but it wouldn’t surprise me, based on my experience with those controllers in the past. Given both boards here use identical controllers, it’s no surprise to see them both come out evenly. The same outcome applies to the Sandra tests as well.
With testing out of the way, let’s get to wrapping this review up.

Support our efforts! With ad revenue at an all-time low for written websites, we're relying more than ever on reader support to help us continue putting so much effort into this type of content. You can support us by becoming a Patron, or by using our Amazon shopping affiliate links listed through our articles. Thanks for your support!

Rob Williams
Rob founded Techgage in 2005 to be an 'Advocate of the consumer', focusing on fair reviews and keeping people apprised of news in the tech world. Catering to both enthusiasts and businesses alike; from desktop gaming to professional workstations, and all the supporting software.


