- Qualcomm Launches Snapdragon 4 Gen 2 Mobile Platform
- AMD Launches Ryzen PRO 7000 Series Mobile & Desktop Platform
- Intel Launches Sleek Single-Slot Arc Pro A60 Workstation Graphics Card
- NVIDIA Announces Latest Ada Lovelace Additions: GeForce RTX 4060 Ti & RTX 4060
- Maxon Redshift With AMD Radeon GPU Rendering Support Now Available
Blender 3.5 Performance Deep-dive: GPU Rendering & Viewport Performance

Blender 3.5 brings a lot of polish and new features to the table, and naturally, we had to give it a thorough battering with a wide-range of GPUs. This time around, we’ve added a new Cycles and Eevee render project, a new viewport project, and also cover an interesting angle: shader compile times.
Get the latest GPU rendering benchmark results in our more up-to-date Blender 3.6 performance article.
It seems tired to say that the latest version of Blender brings about lots of polish and cool new features, but it continues to be true. Even if a new Blender launch doesn’t impact our performance results much, there will still be a long list of new features and fixes.
In Blender 3.5, one of the major additions is new hair-based geometry nodes. As it sounds, these nodes allow you to create realistic hairs and furs. It’s a feature the developers are so proud of, that they’ve released a new demo files test project featuring nodes that create animal fur. As it happens, that project has some interesting rendering characteristics, so we’ve added it as a project as part of our Cycles testing.
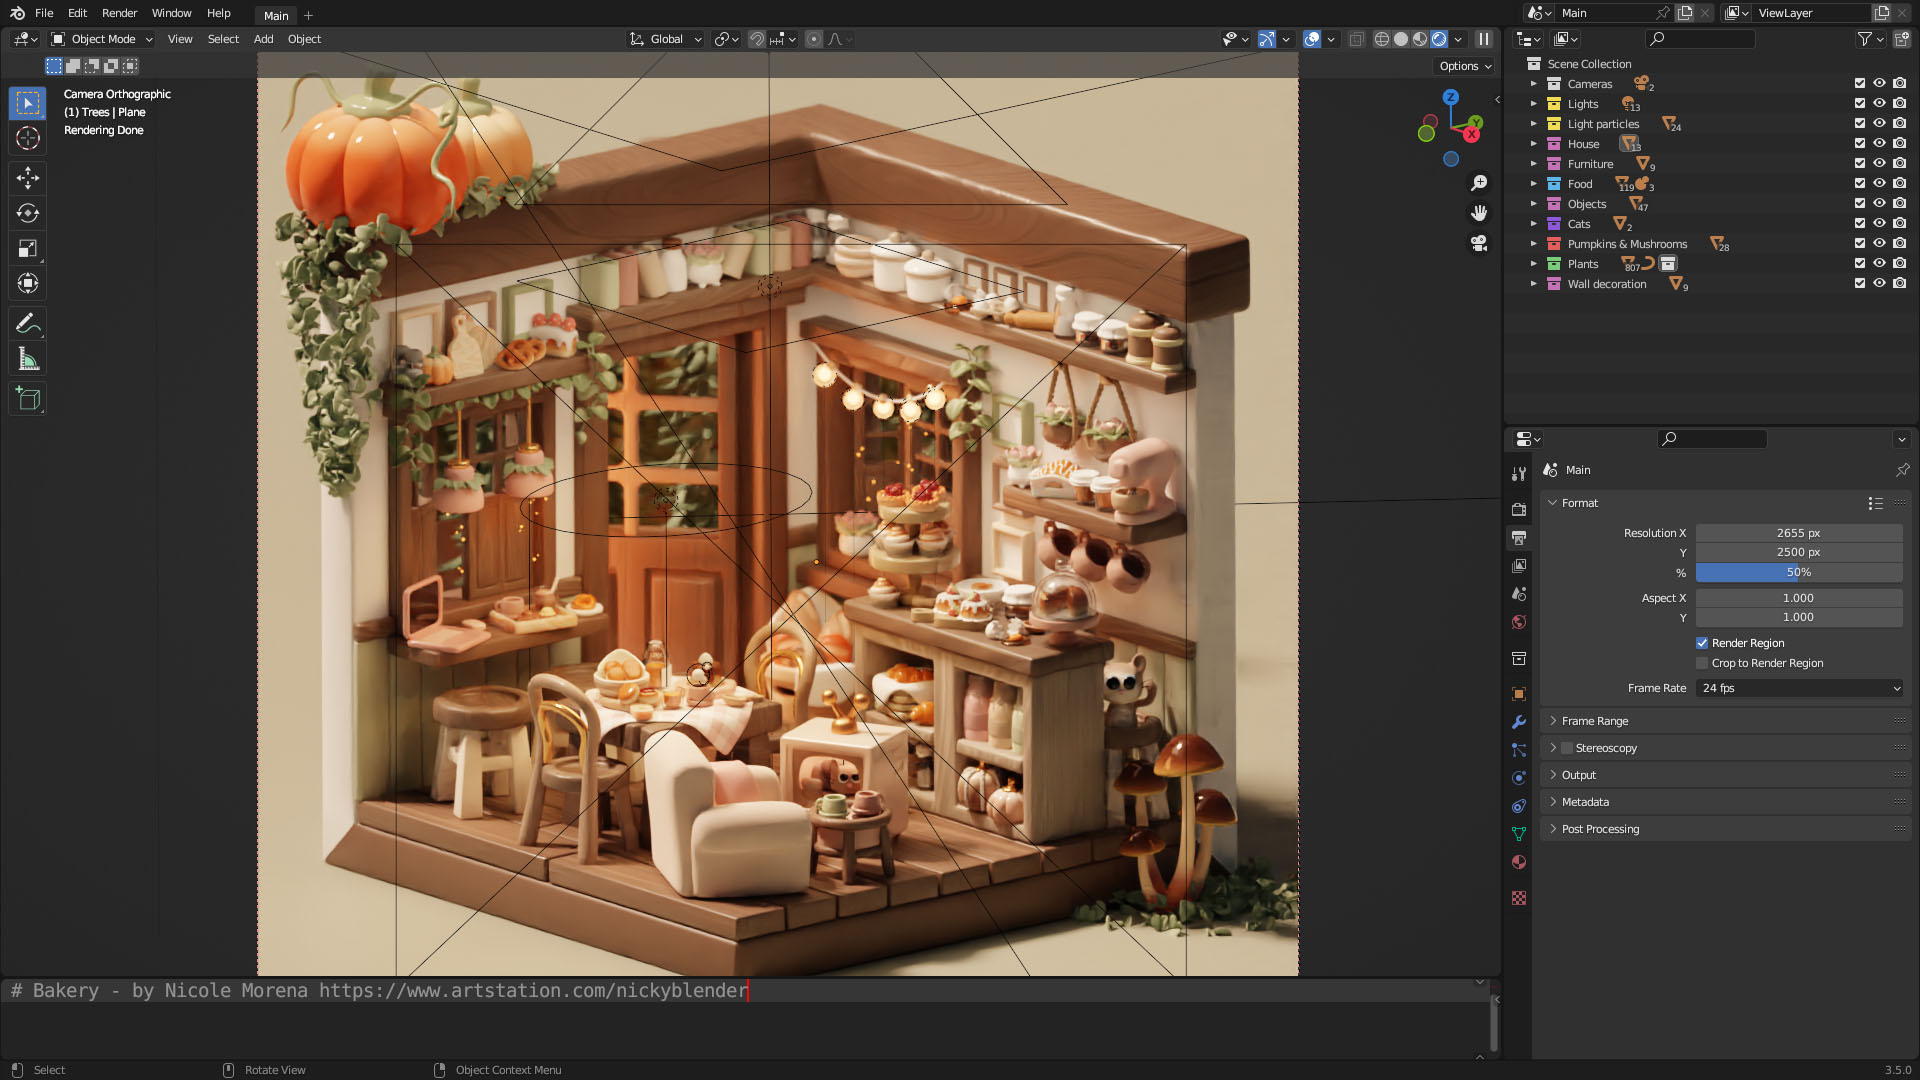
The cute scene above, Cozy Bakery, isn’t suitable for rendering tests, as it simply renders too quickly, but it’s another project available at Blender’s demo files page that allows you to peer into the inner-workings – a boon for new users looking to learn the ins and outs.
This article is being posted later than expected, and it’s going to preface an onslaught of upcoming content that will see new GPU models added. Once the embargo deluge subsides, we’ll update this article with the newest results.
To learn more about all that Blender 3.5 has changed or added, you can check out the in-depth release notes page.
AMD, Intel & NVIDIA GPU Lineups, Our Test Methodologies
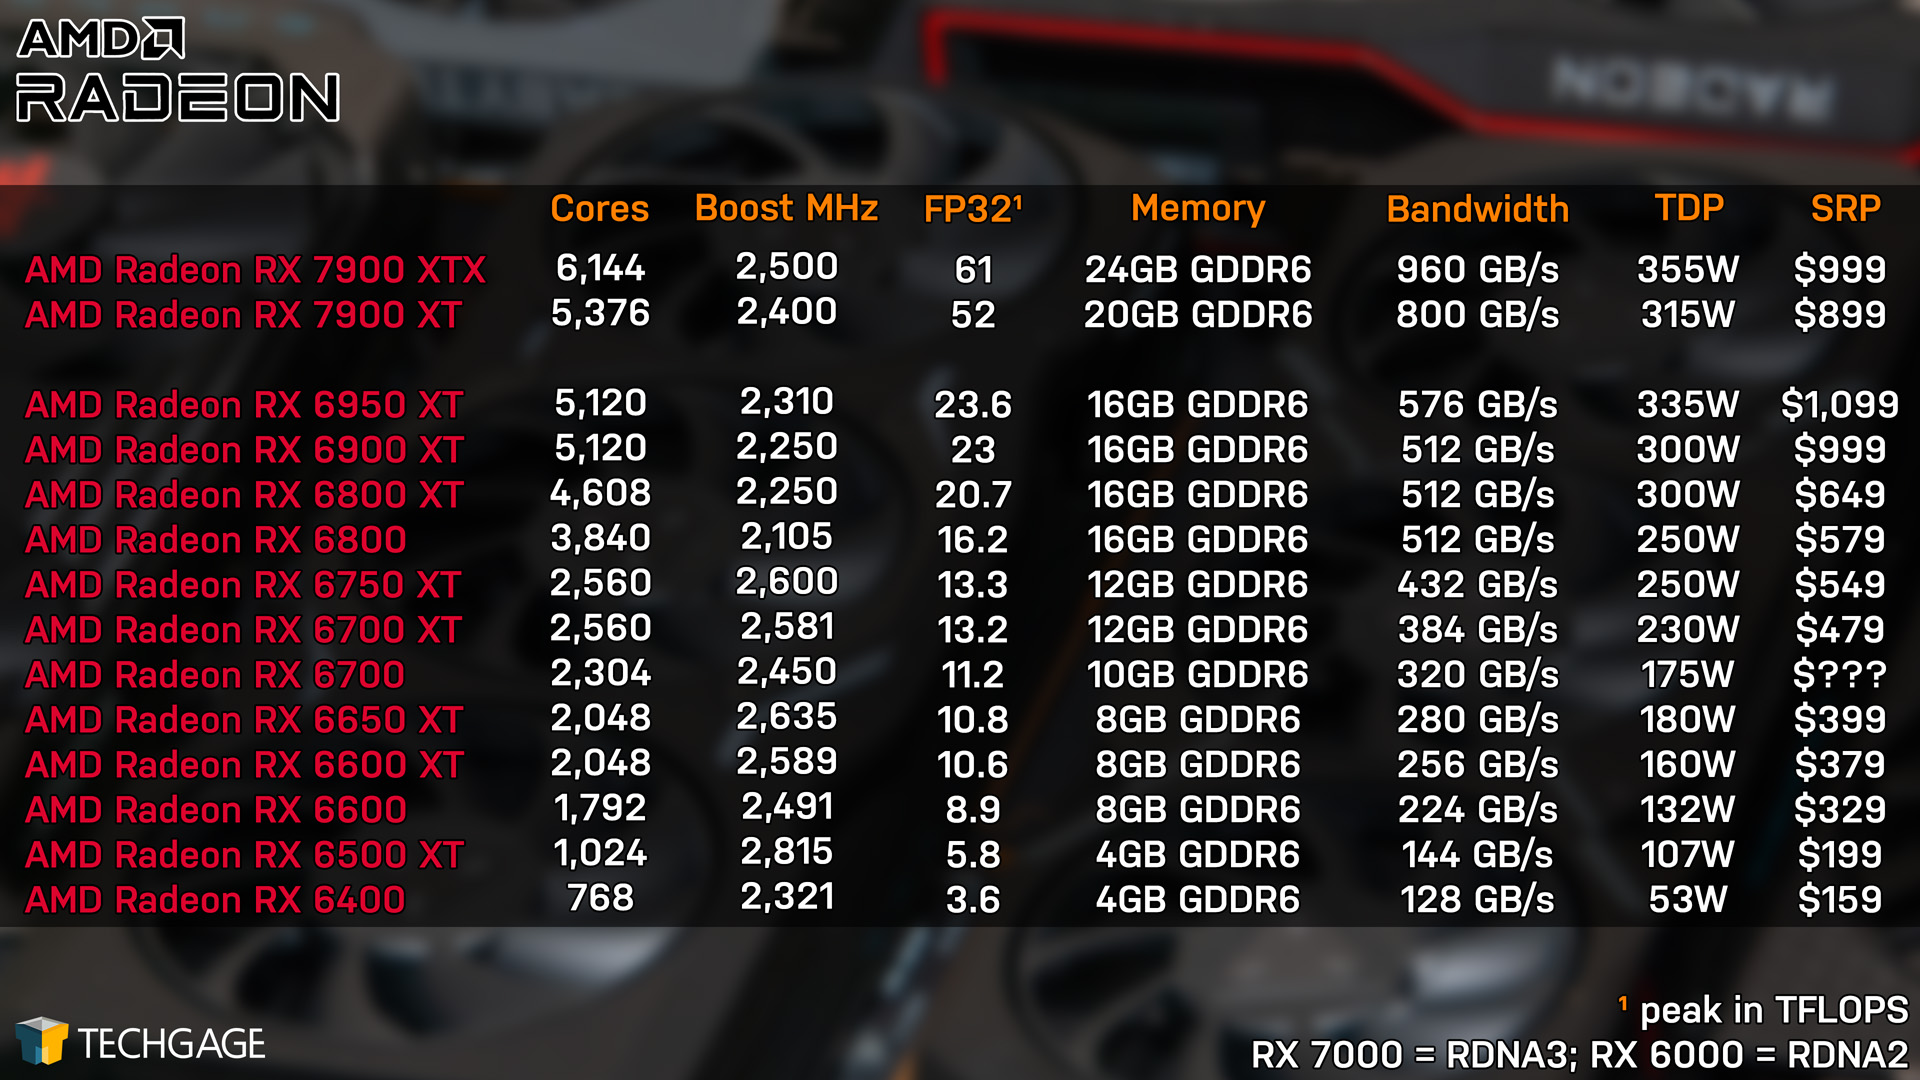
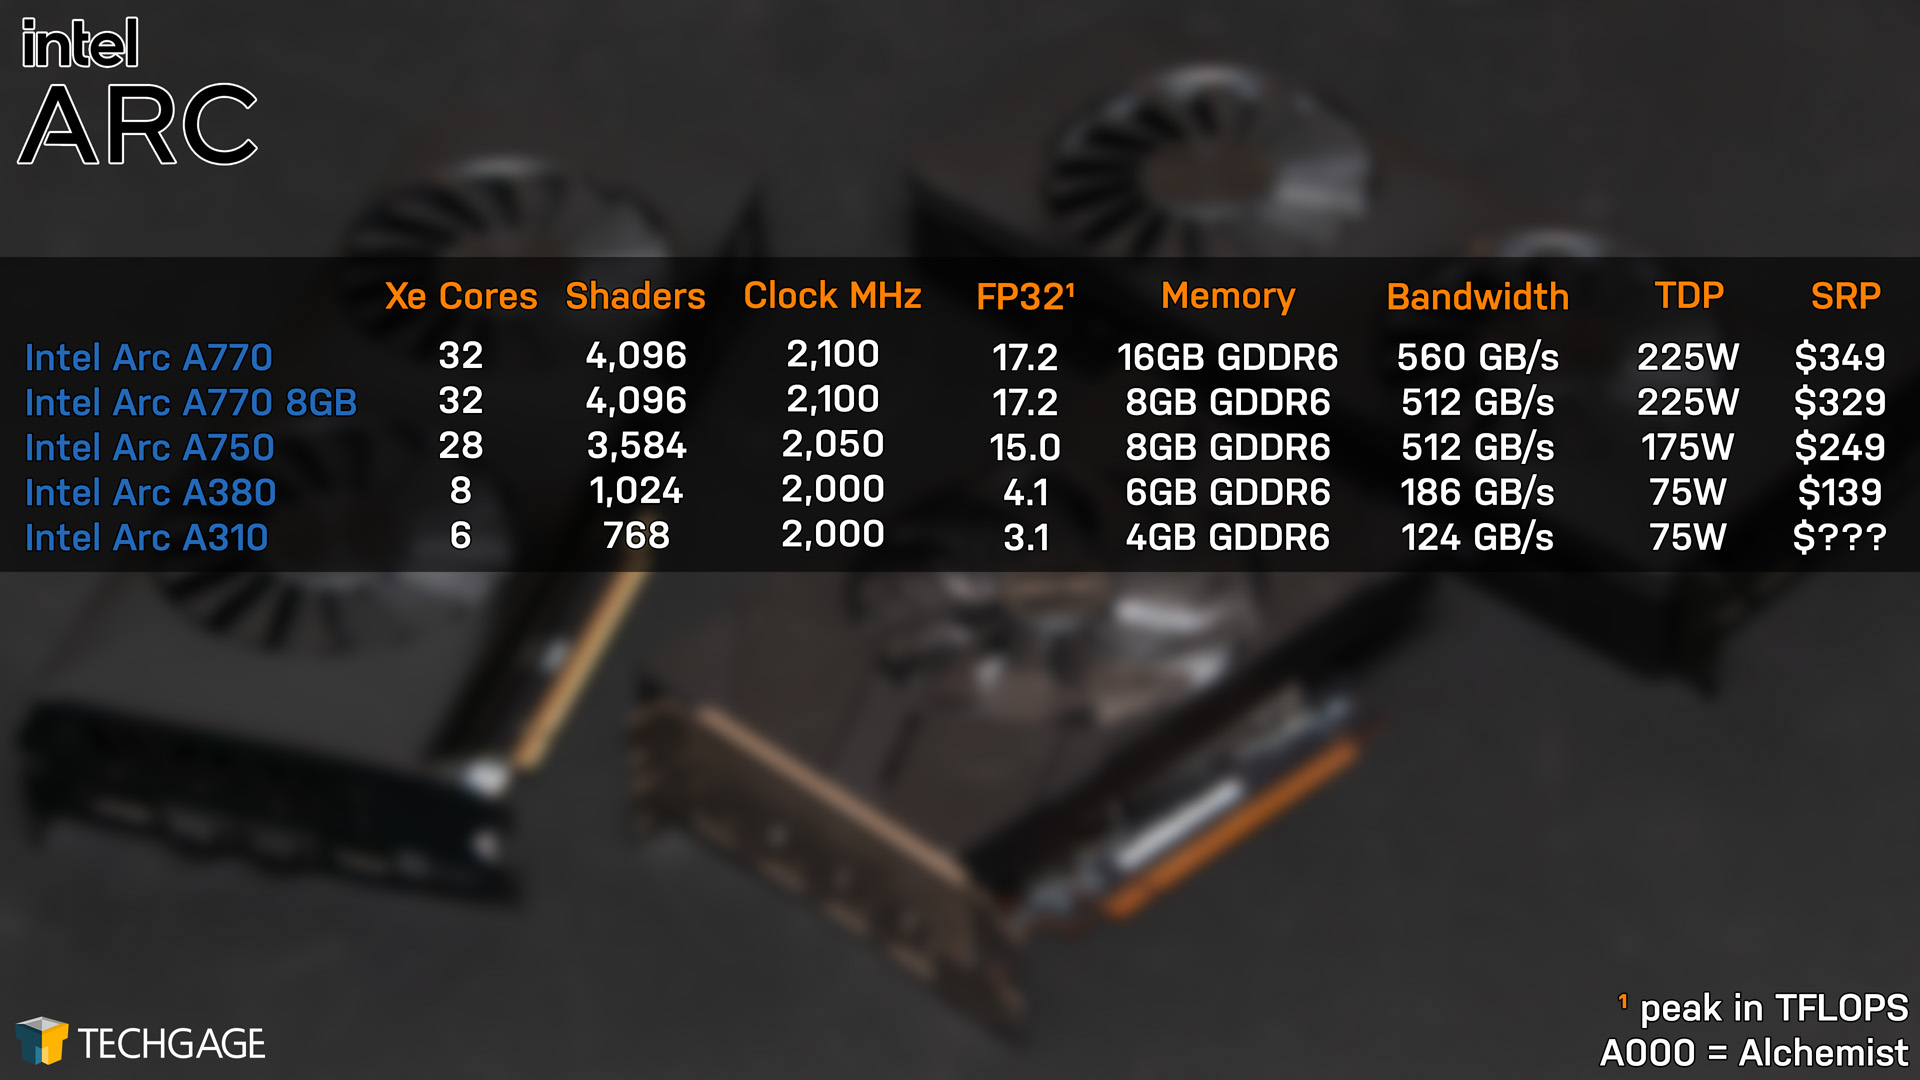
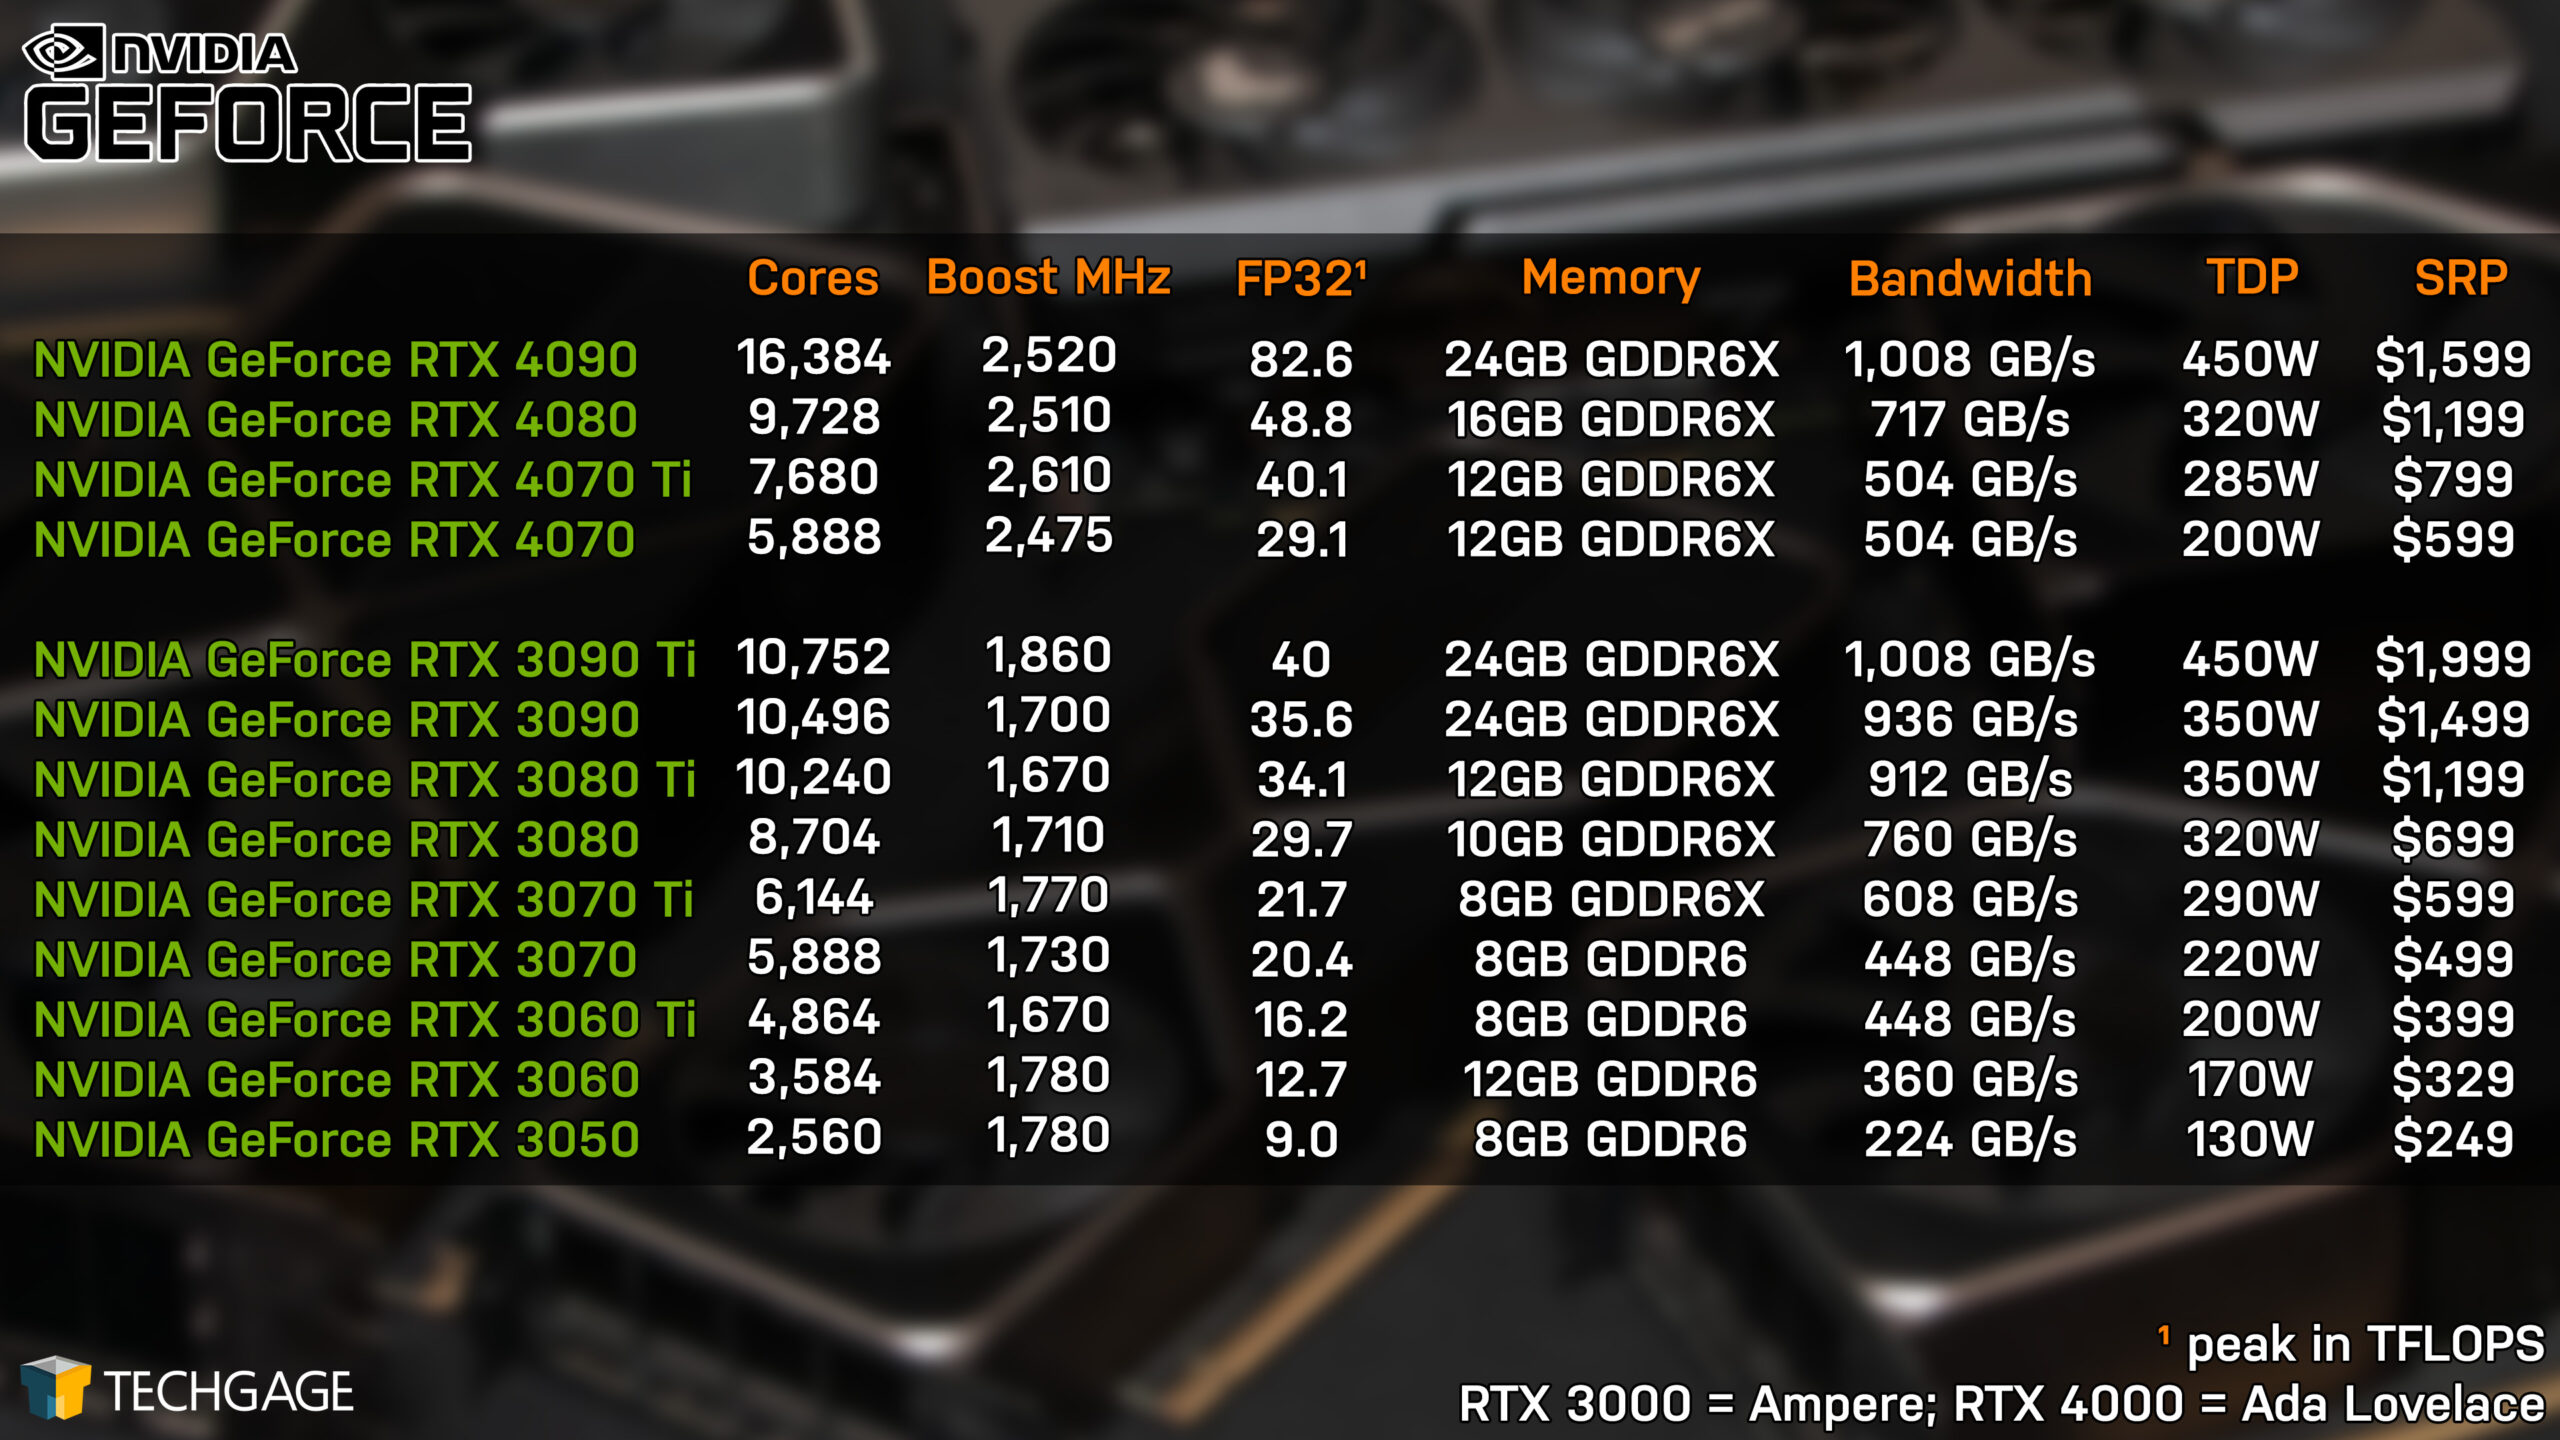
Before diving into our performance results, here’s a quick look at AMD’s, Intel’s, and NVIDIA’s current product lineups, as well as some test methodology housekeeping:
| Techgage Creator GPU Testing PC | |
| Processor | Intel Core i9-13900K (3.0GHz, 24C/32T) |
| Motherboard | ASUS ROG STRIX Z690-E GAMING WIFI CPUs tested with 2305 BIOS (March 10, 2023) |
| Memory | G.SKILL Trident Z5 RGB (F5-6000J3040F16G) 16GB x2 XMP-enabled w/ freq. set to DDR5-6000 (30-40-40-96, 1.35V) |
| AMD Graphics | AMD Radeon RX 7900 XTX (24GB; Adrenalin 23.4.1) AMD Radeon RX 7900 XT (20GB; Adrenalin 23.4.1) AMD Radeon RX 6950 XT (16GB; Adrenalin 23.4.1) AMD Radeon RX 6800 XT (16GB; Adrenalin 23.4.1) AMD Radeon RX 6800 (16GB; Adrenalin 23.4.1) AMD Radeon RX 6750 XT (12GB; Adrenalin 23.4.1) AMD Radeon RX 6600 XT (8GB; Adrenalin 23.4.1) AMD Radeon RX 6600 (8GB; Adrenalin 23.4.1) AMD Radeon RX 6500 XT (4GB; Adrenalin 23.4.1) |
| Intel Graphics | Intel Arc A770 (16GB; Arc 31.0.101.4311) Intel Arc A750 (8GB; Arc 31.0.101.4311) Intel Arc A380 (6GB; Arc 31.0.101.4311) |
| NVIDIA Graphics | NVIDIA GeForce RTX 4090 (24GB; Studio 531.61) NVIDIA GeForce RTX 4080 (16GB; Studio 531.61) NVIDIA GeForce RTX 4070 Ti (12GB; Studio 531.61) NVIDIA GeForce RTX 4070 (12GB; Studio 531.61) NVIDIA GeForce RTX 3090 (24GB; Studio 531.61) NVIDIA GeForce RTX 3080 Ti (12GB; Studio 531.61) NVIDIA GeForce RTX 3080 (10GB; Studio 531.61) NVIDIA GeForce RTX 3070 Ti (8GB; Studio 531.61) NVIDIA GeForce RTX 3070 (8GB; Studio 531.61) NVIDIA GeForce RTX 3060 Ti (8GB; Studio 531.61) NVIDIA GeForce RTX 3060 (12GB; Studio 531.61) NVIDIA GeForce RTX 3050 (8GB; Studio 531.61) |
| Storage | WD Blue 3D NAND 1TB x3 (SATA 6Gbps) |
| Power Supply | Corsair RM1000x (1000W) |
| Chassis | Corsair 4000X Mid-tower |
| Cooling | Corsair H150i ELITE CAPELLIX (360mm) |
| Et cetera | Windows 11 Pro 22H2, Build 22621 Intel Chipset Driver: 10.1.19222.8341 Intel ME Driver: 2242.3.34.0 |
| All product links in this table are affiliated, and help support our work. | |
All of the benchmarking conducted for this article was completed using an up-to-date Windows 11 (22H2), the latest AMD chipset driver, as well as the latest (as of the time of testing) graphics driver.
Here are some general guidelines we follow:
- Disruptive services are disabled; eg: Search, Cortana, User Account Control, Defender, etc.
- Overlays and / or other extras are not installed with the graphics driver.
- Vsync is disabled at the driver level.
- OSes are never transplanted from one machine to another.
- We validate system configurations before kicking off any test run.
- Testing doesn’t begin until the PC is idle (keeps a steady minimum wattage).
- All tests are repeated until there is a high degree of confidence in the results.
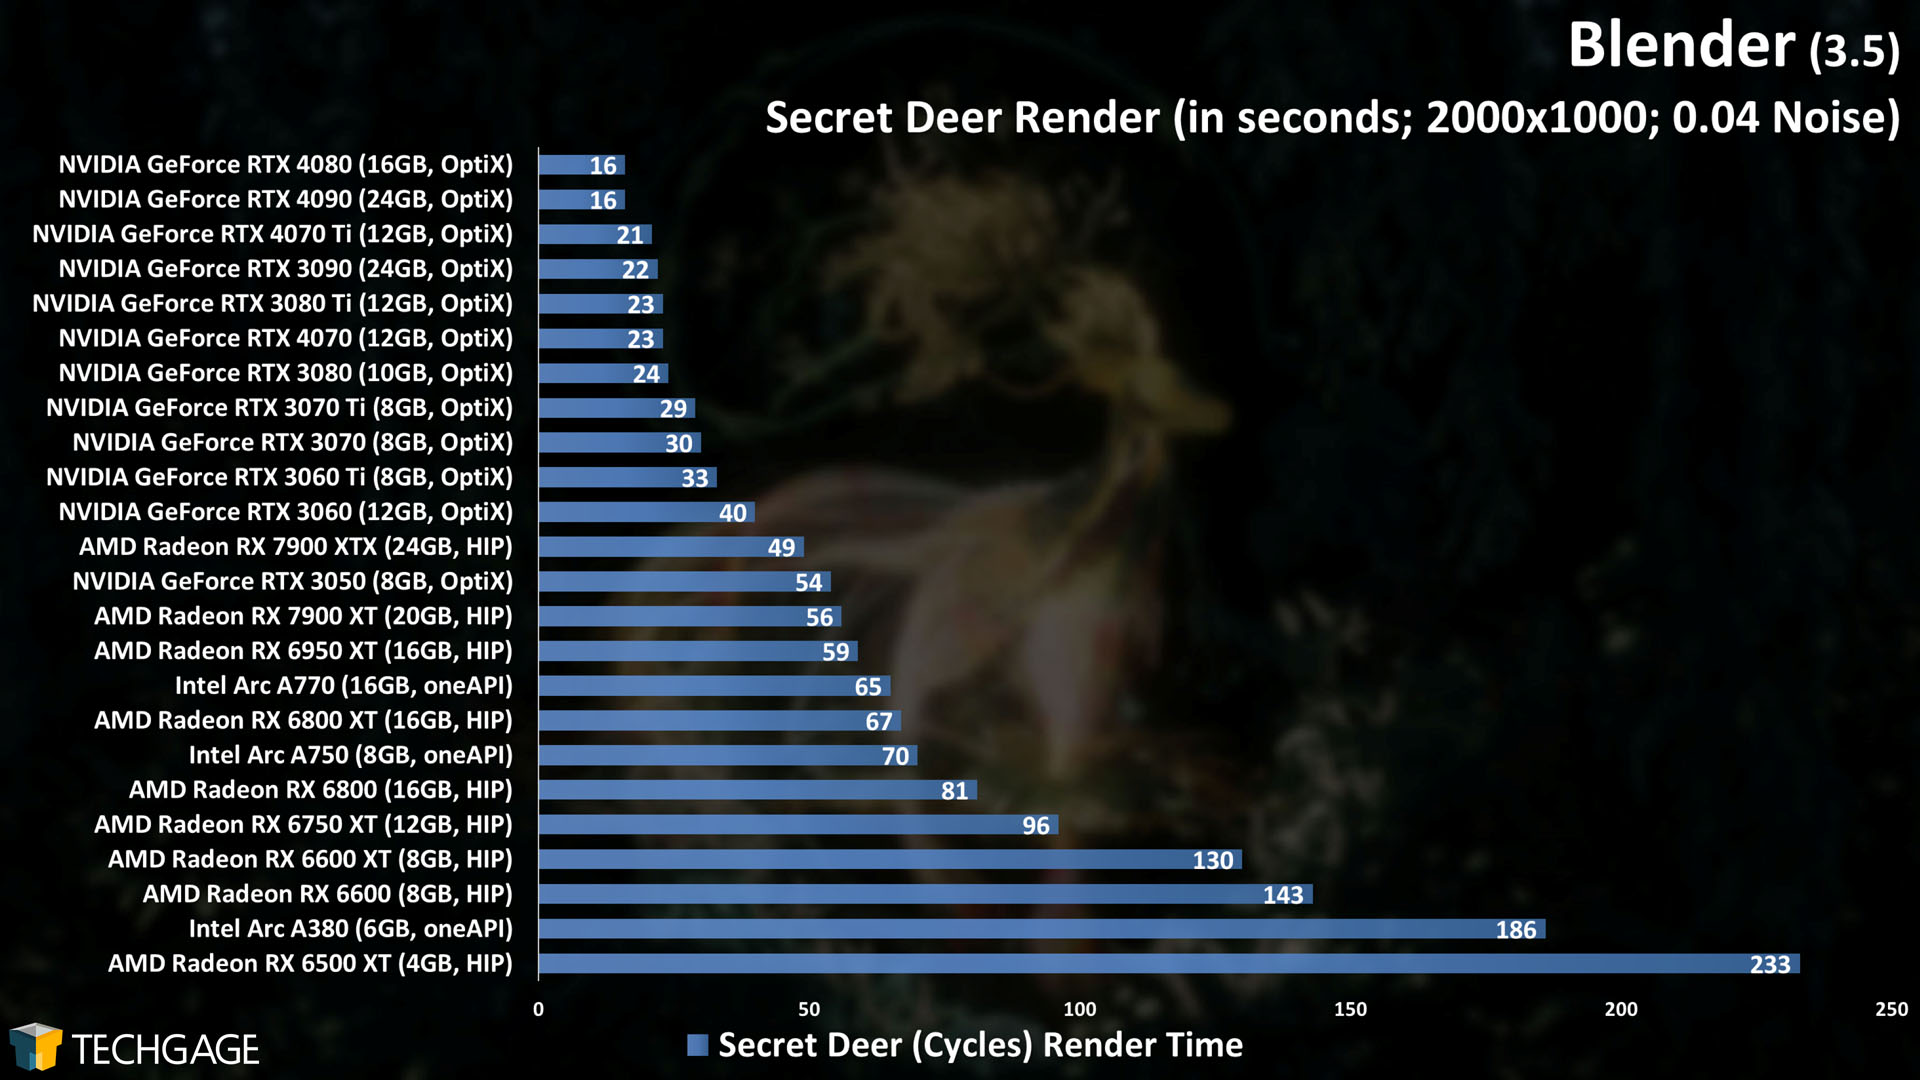
Note that all of the rendering projects tested for this article can be downloaded straight from Blender’s own website. Default values for each project have been left alone, so you can set your render device, hit F12, and compare your render time in a given project to ours.
Viewport Shader Compile Times
The Blender 3.3 performance deep-dive we published in October became the first to feature a third graphics vendor: Intel. At that time, it seemed like a cool idea to test shader compile times with regards to enabling Material Preview mode in the viewport. What we found was interesting: each vendor behaved differently than we would have expected, and of the three, Intel lagged behind the most.
The actual task of compiling shaders is something that requires a CPU a lot more than a GPU. If you’re a gamer, you’ve likely encountered many intro screens that take a few minutes to get through while shaders are compiled in the background. Technically, the faster the single-threaded performance of a CPU, the faster shader compiles could be, but above all, it’s up to GPU driver engineers to work their magic to optimize for the task. An RTX 4090 isn’t going to complete a shader compile quicker than an RTX 4070, as one example, unless perhaps the project demands more than the available VRAM.
Since our last look at this performance angle, Intel’s driver engineers have been working some magic, improving things to a point where we felt compelled to generate some fresh numbers. With three projects in-hand, we retested each vendor with the same driver as used in the 3.3 deep-dive, as well as the latest. AMD’s and NVIDIA’s performance hasn’t changed at all the past six months with regards to this test, but Intel’s sure has.
A note about testing: The results reported were recorded with a stopwatch, with the timer started the moment Material Preview was enabled in the viewport. The timer was stopped once the project had loaded all of its shaders. “First” refers to the first-ever compile following a GPU driver install; “Second” refers to closing and reopening Blender, and repeating the test; “After Reboot” refers to rebooting the PC, and again repeating the test.
| Controller | First | Repeat | After Reboot |
| AMD RX 6950 | 9 | 3 | 9 |
| NVIDIA RTX 4090 | 20 | 2 | 11 |
| Intel A770 (3793) | 27 | 11 | 25 |
| Intel A770 (4311) | 22 | 2 | 15 |
| Barbershop | First | Repeat | After Reboot |
| AMD RX 6950 | 54 | 21 | 53 |
| NVIDIA RTX 4090 | 137 | 2 | 97 |
| Intel A770 (3793) | 282 | 154 | 223 |
| Intel A770 (4311) | 230 | 12 | 171 |
| Classroom | First | Repeat | After Reboot |
| AMD RX 6950 | 23 | 6 | 23 |
| NVIDIA RTX 4090 | 42 | 2 | 29 |
| Intel A770 (3793) | 108 | 51 | 102 |
| Intel A770 (4311) | 61 | 4 | 49 |
| Result in seconds. | |||
Once again, the results we see would have been difficult (or impossible) to predict. Overall, AMD cleans house, delivering the fastest compile times overall – but there are caveats. Both Intel and NVIDIA showed faster (than first run) shader compile times after a reboot, but AMD’s remained the same. For that reason, it’s a good thing AMD’s compile times are so fast to begin with.
On the NVIDIA front, its first compile times are worse than AMD’s, but its repeated times are much faster. It does stand out that NVIDIA falls behind AMD here, considering that when it comes to rendering, NVIDIA tends to dominate (at least in Cycles).
As for Intel, its performance continues to lag behind the competition, but the improvements seen between the two tested drivers is downright impressive. It also highlights the fact that the company is looking beyond optimizing just the basics in creator workflows. The reality is, all of these performance angles matter, and when a reopened project suddenly compiles itself in 10% of the time, it’s going to be noticed.
We’ll periodically check back with this testing anytime a new deep-dive article is being prepared. We’re eager to see if Intel’s times continue to improve as the driver evolves.
Cycles GPU: AMD HIP, Intel oneAPI & NVIDIA OptiX
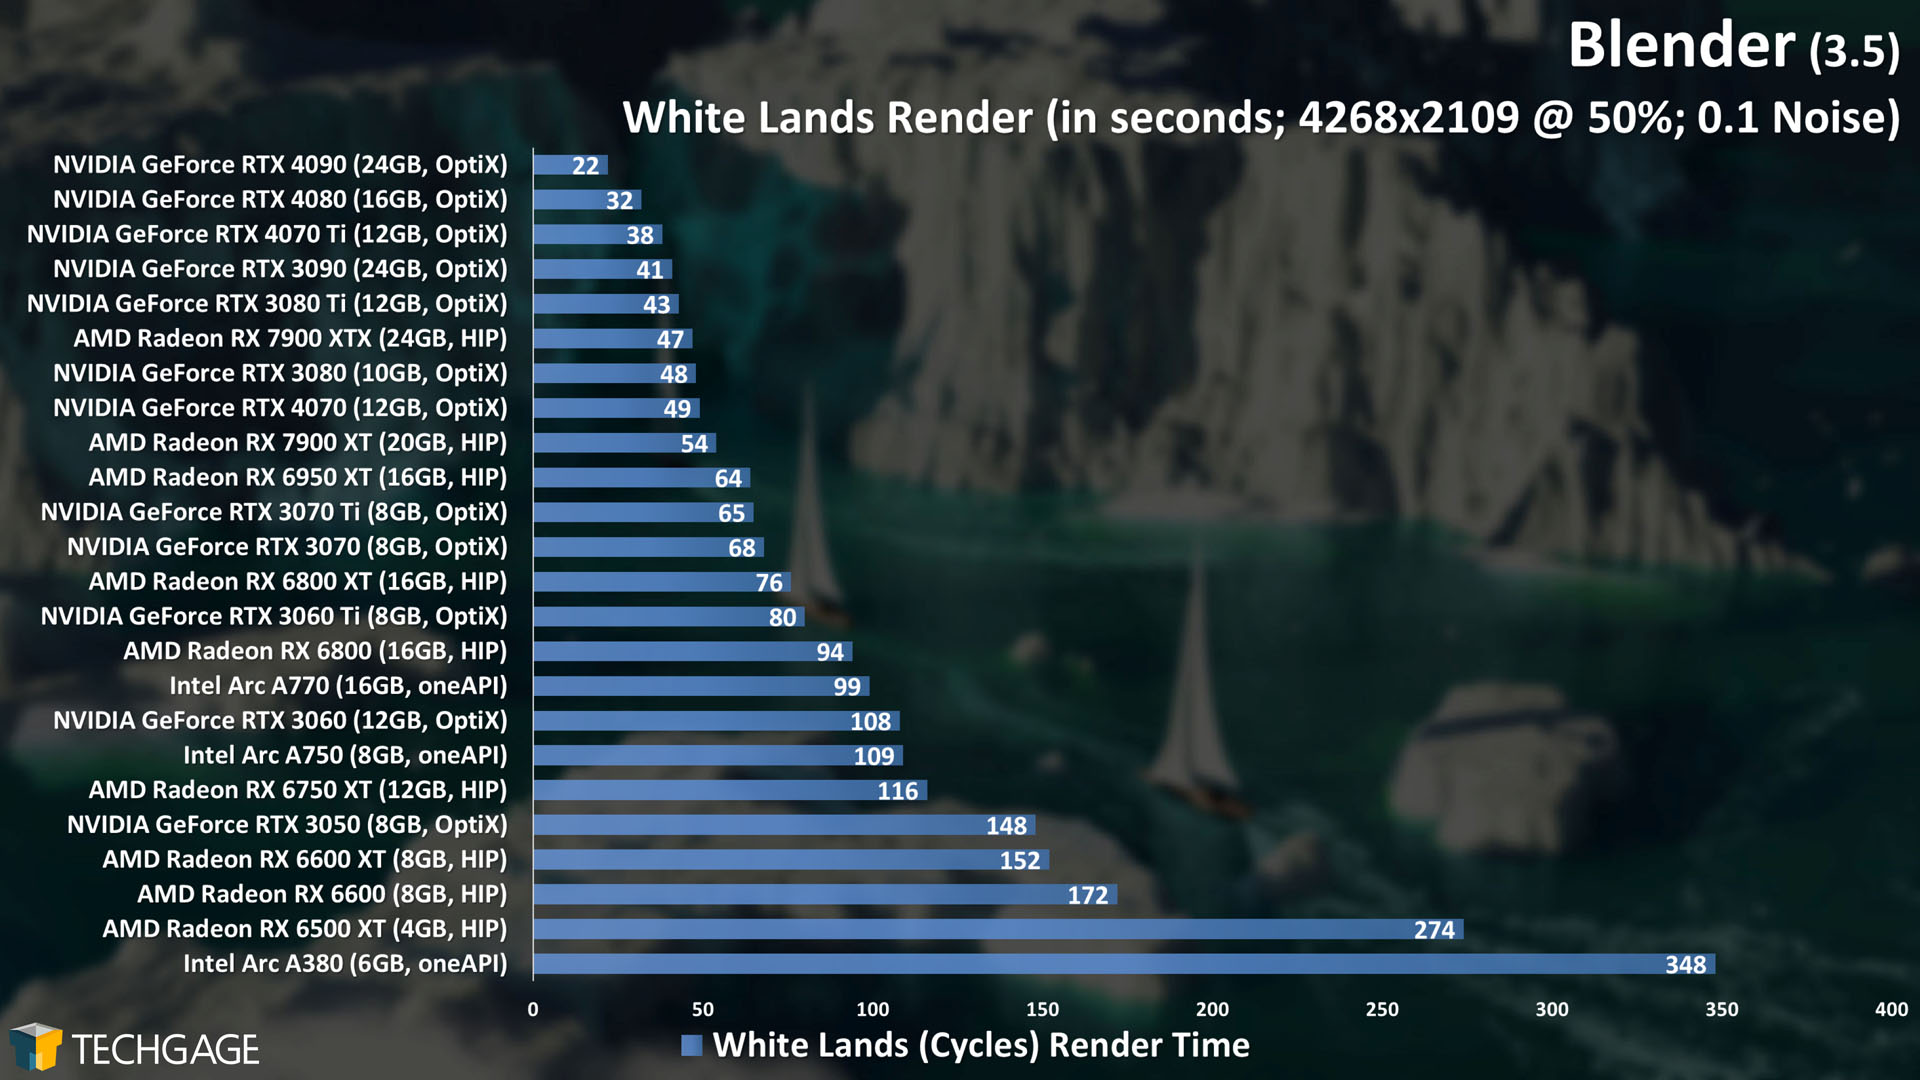
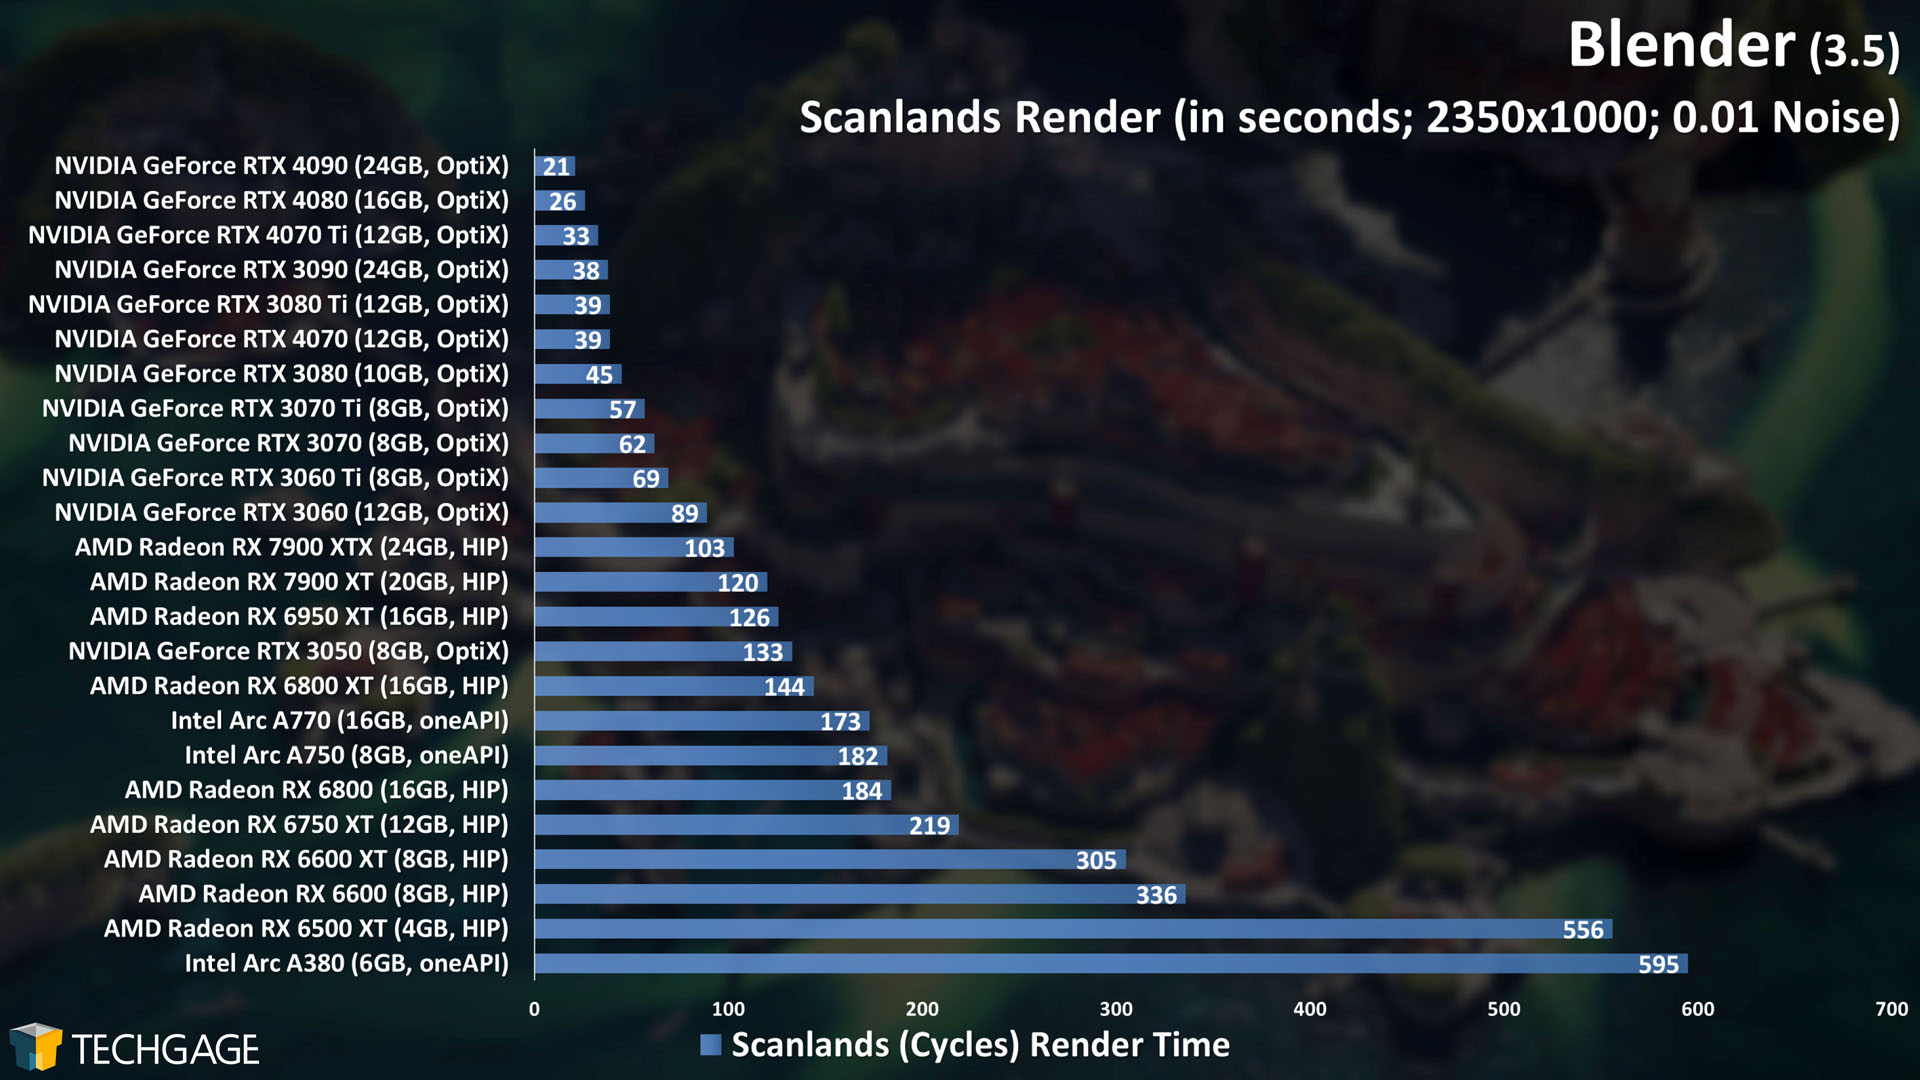
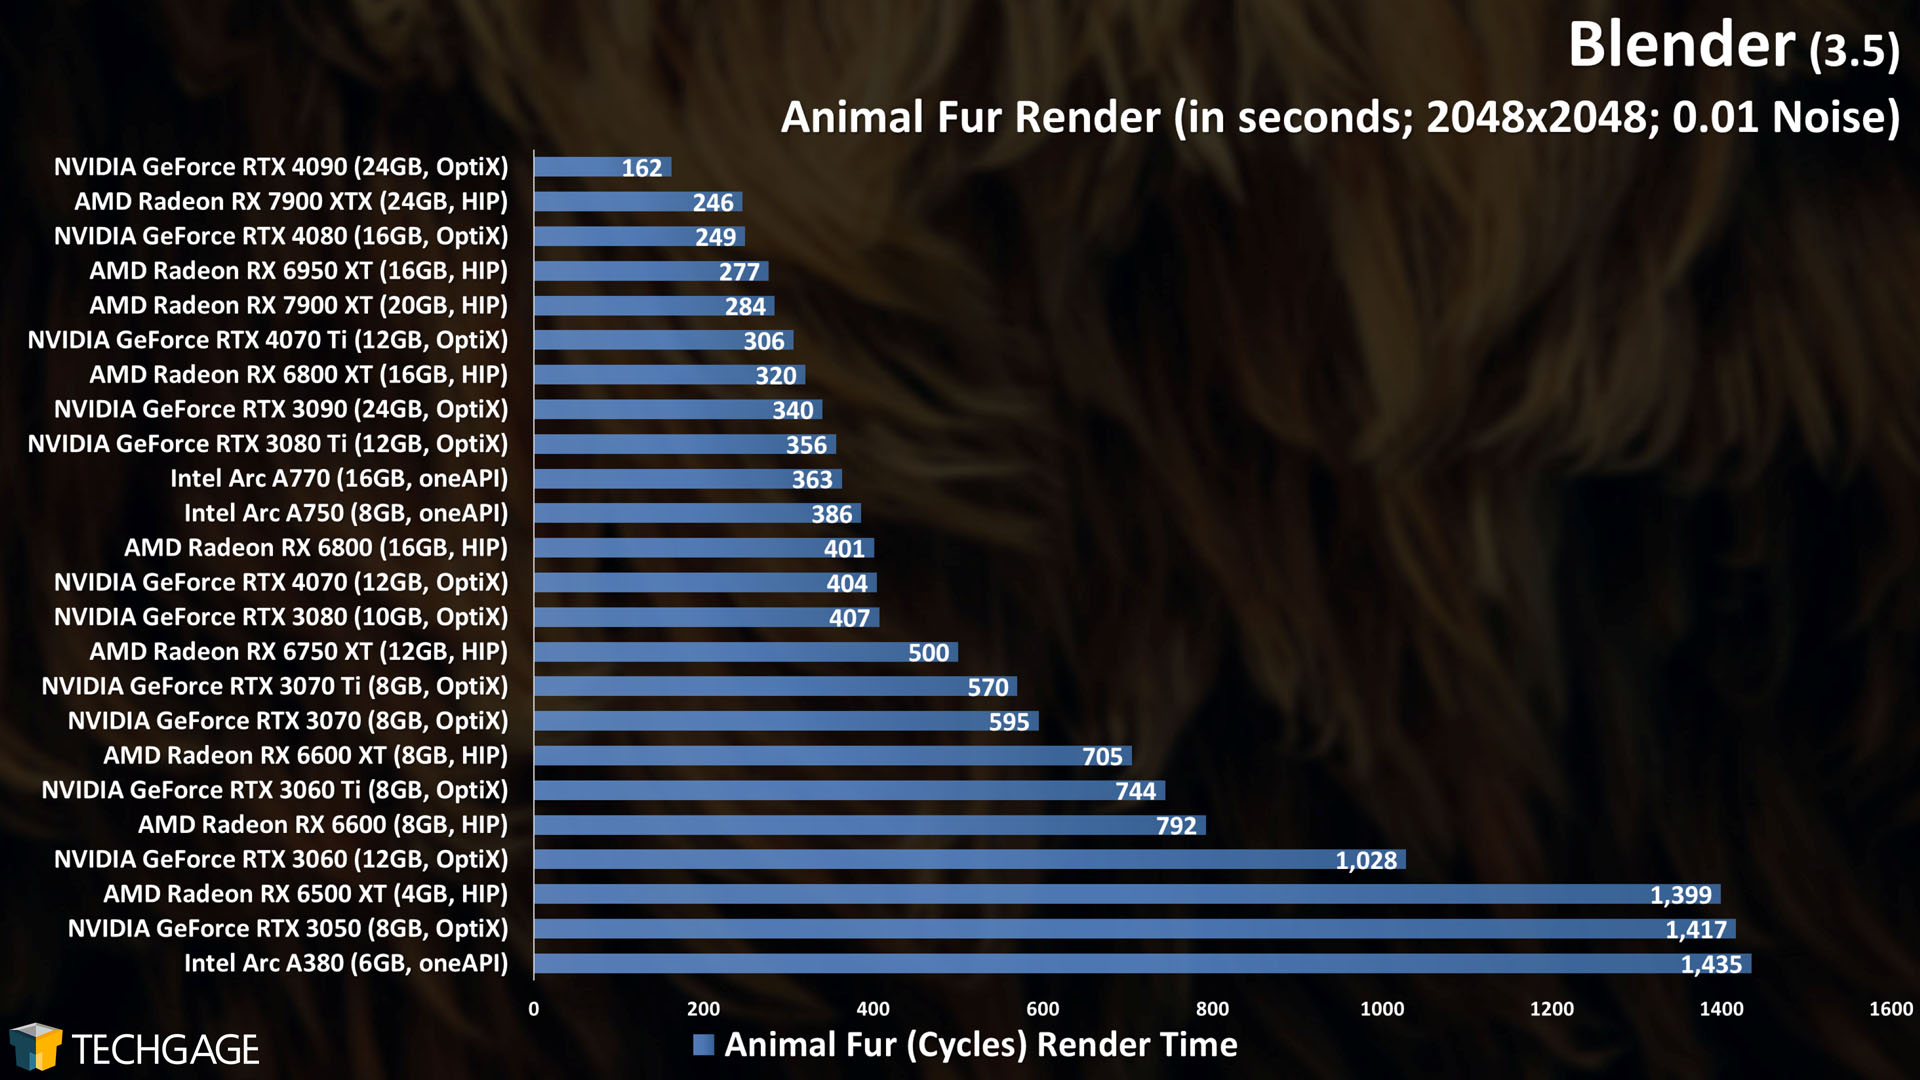
Blender 3.5 didn’t change much with regards to Cycles performance, so the results above are similar to those seen in the previous deep-dive. Fortunately, we do have another angle to talk about. With the 3.5 release, Blender added another project to its demo files page which revolves entirely around the new hair-based geometry nodes:
Rendering this project using the default settings will give any GPU a good workout, with even the GeForce RTX 4090 taking close to three minutes to render it. The punishment stands out at the bottom of the chart, where multiple low-end GPUs with limited memory can barely breathe.
It stands out that while in most Cycles tests, AMD falls behind NVIDIA – thanks to team green’s ray tracing acceleration enabled through the OptiX API – things are shaked-up here. When conducting some sanity checking after-the-fact, we discovered that this project actually renders slower when using OptiX. Switching to CUDA shaved some time off, which shouldn’t happen, so there’s likely a bug kicking around somewhere. We’ll revisit this same project next deep-dive, and potentially add any others that pop up and are worth testing.
Eevee GPU: AMD, Intel & NVIDIA
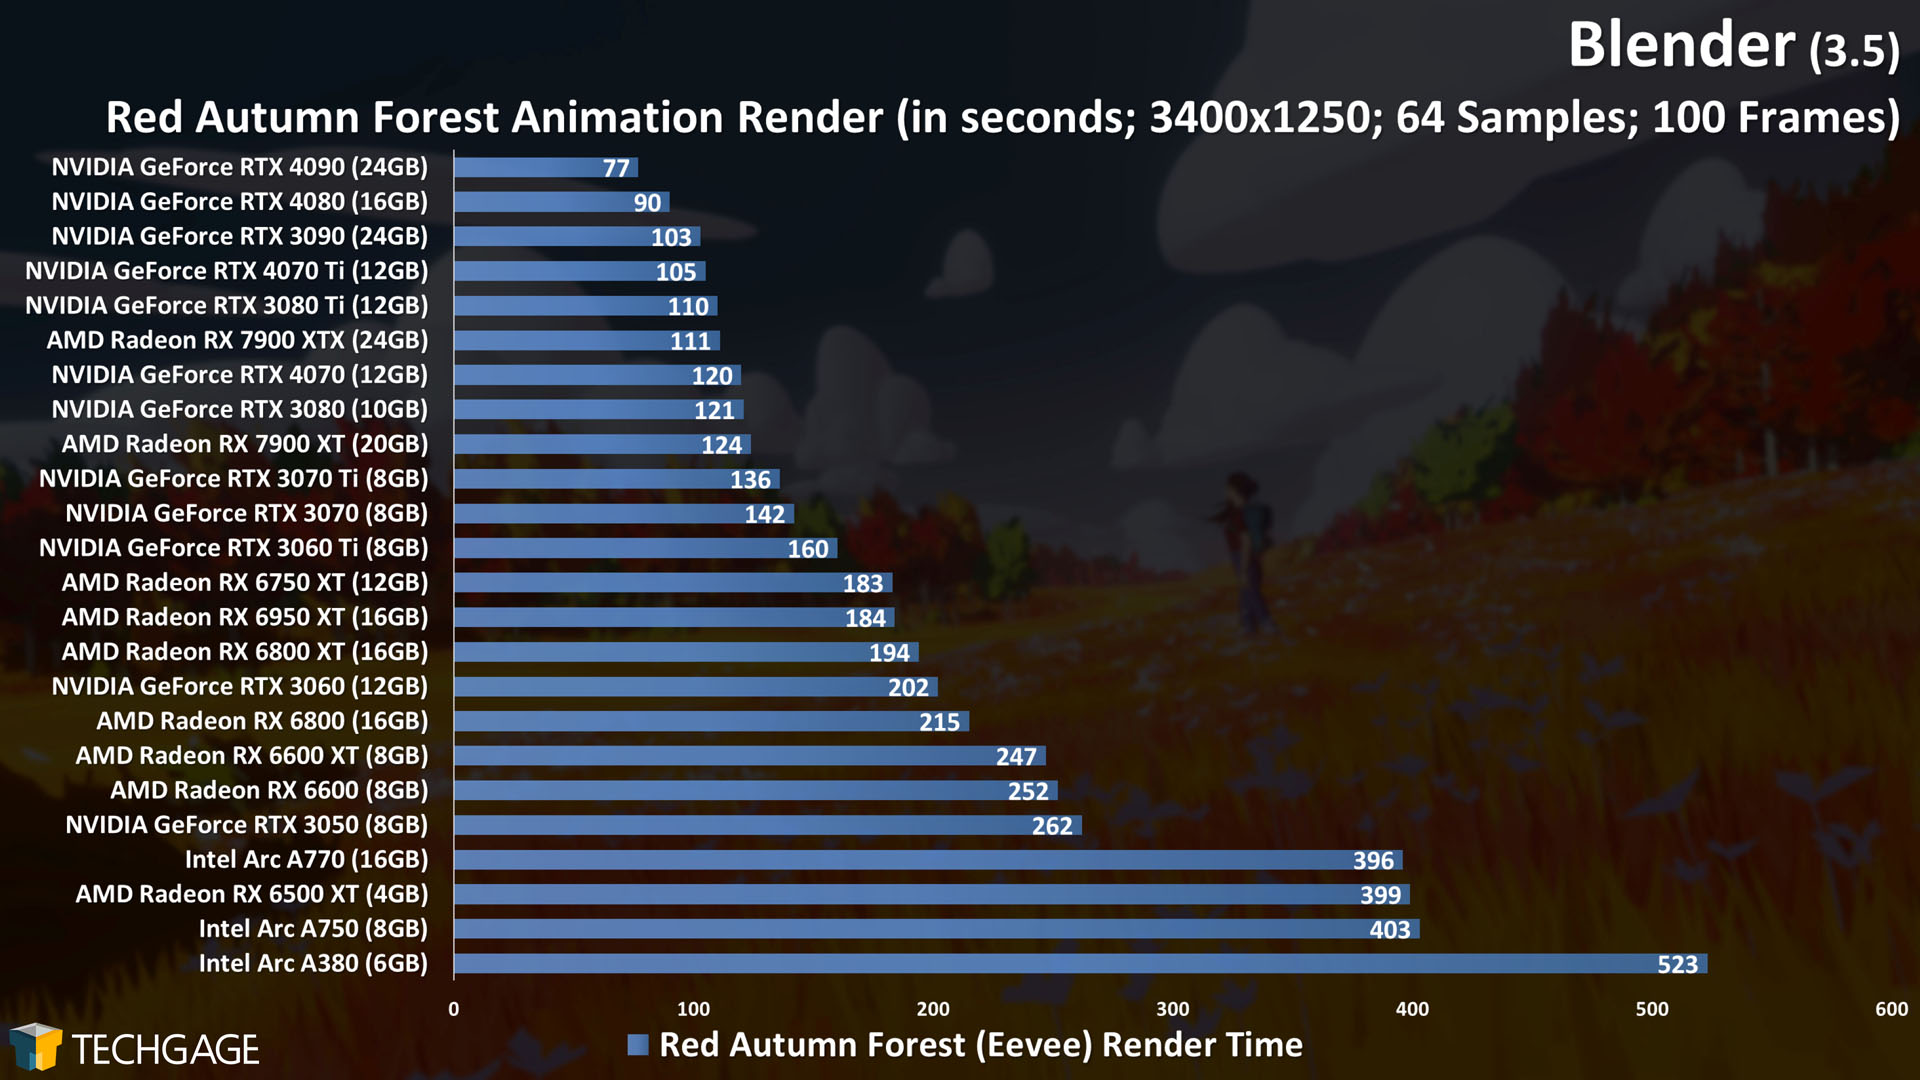
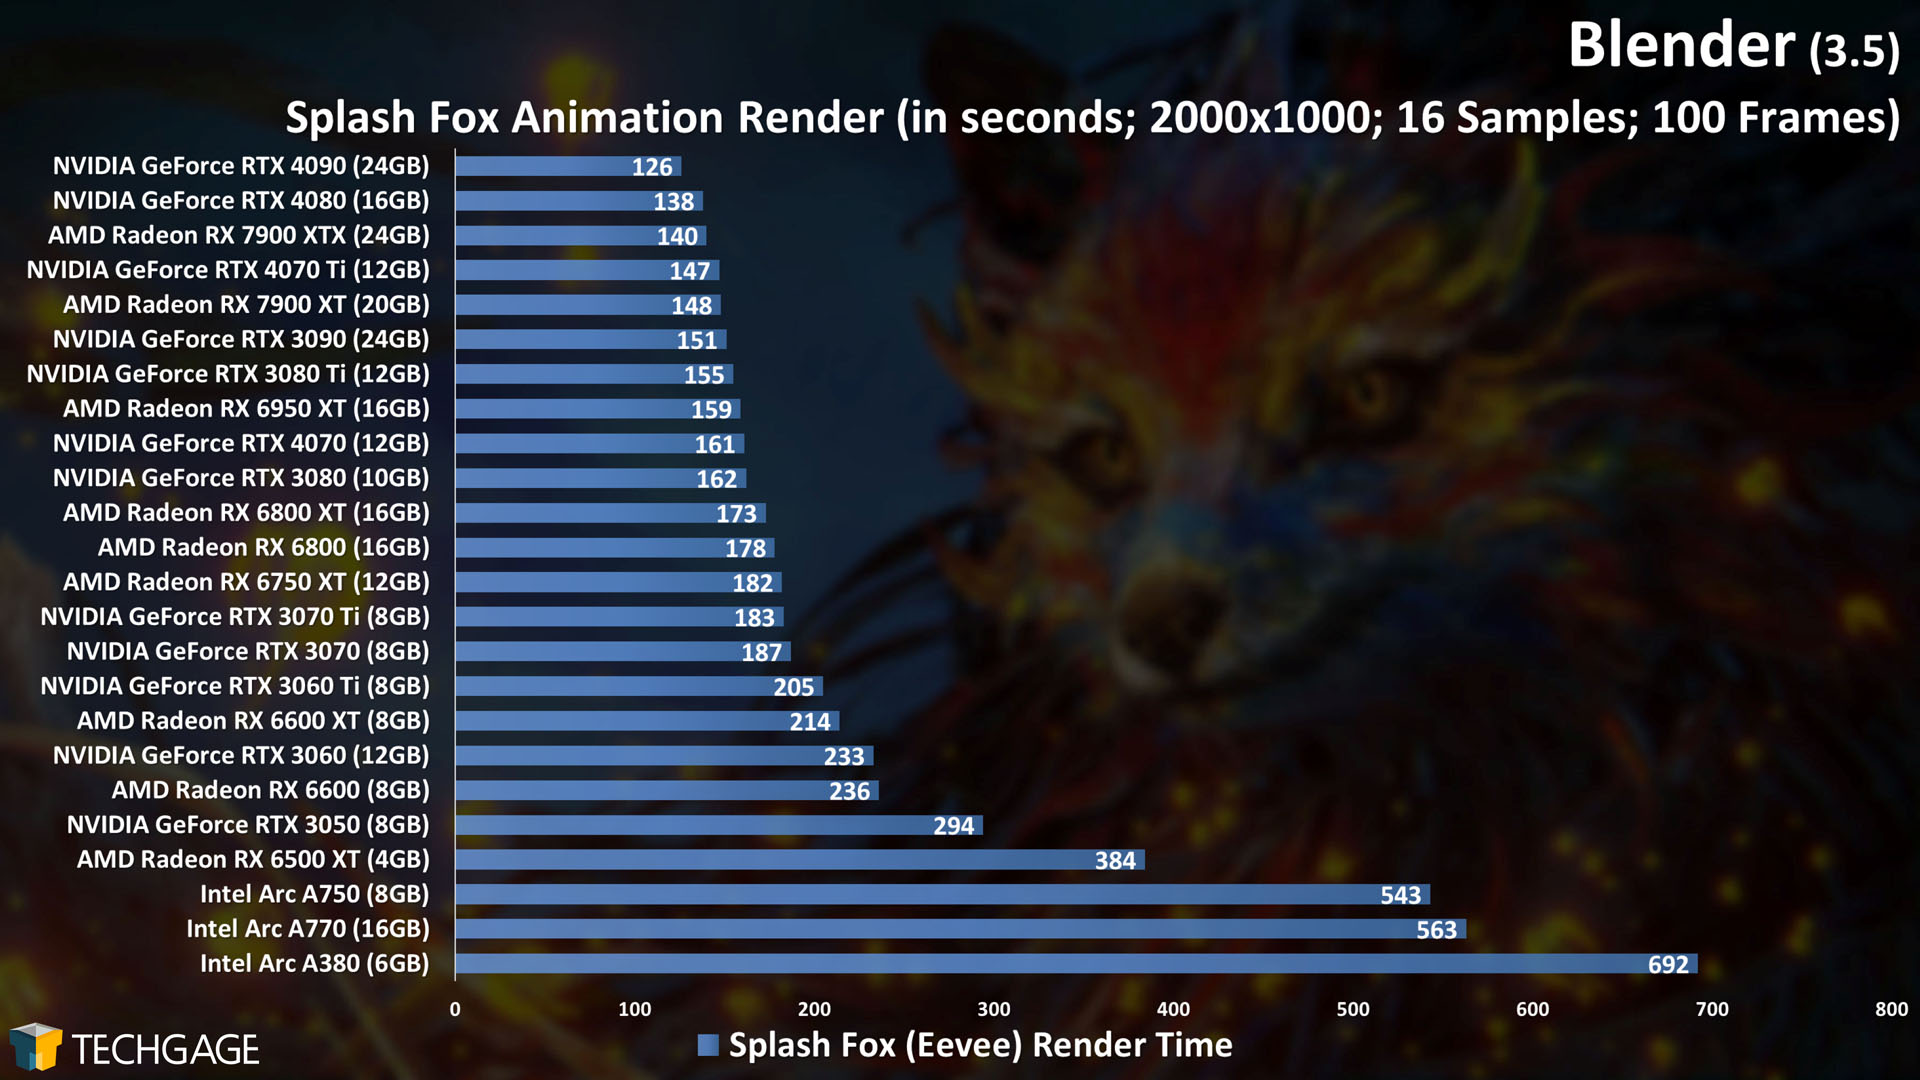
Let’s kick off our Eevee look with returning projects first:
Whereas Cycles saw no real performance change between 3.4 and 3.5 (at least in the tests we use), Eevee did change a little bit. However, the change is not in the direction we usually expect: almost all of the results took seconds longer this go-around versus the previous test.
That immediately seems like a bad thing, but oftentimes when small degradation like this happens, it’s because other polish made elsewhere to the pipeline happened to impact it. We’ve seen Eevee performance drop slightly in the past, only to spring back up in the next major release, so we could see that happen again here.
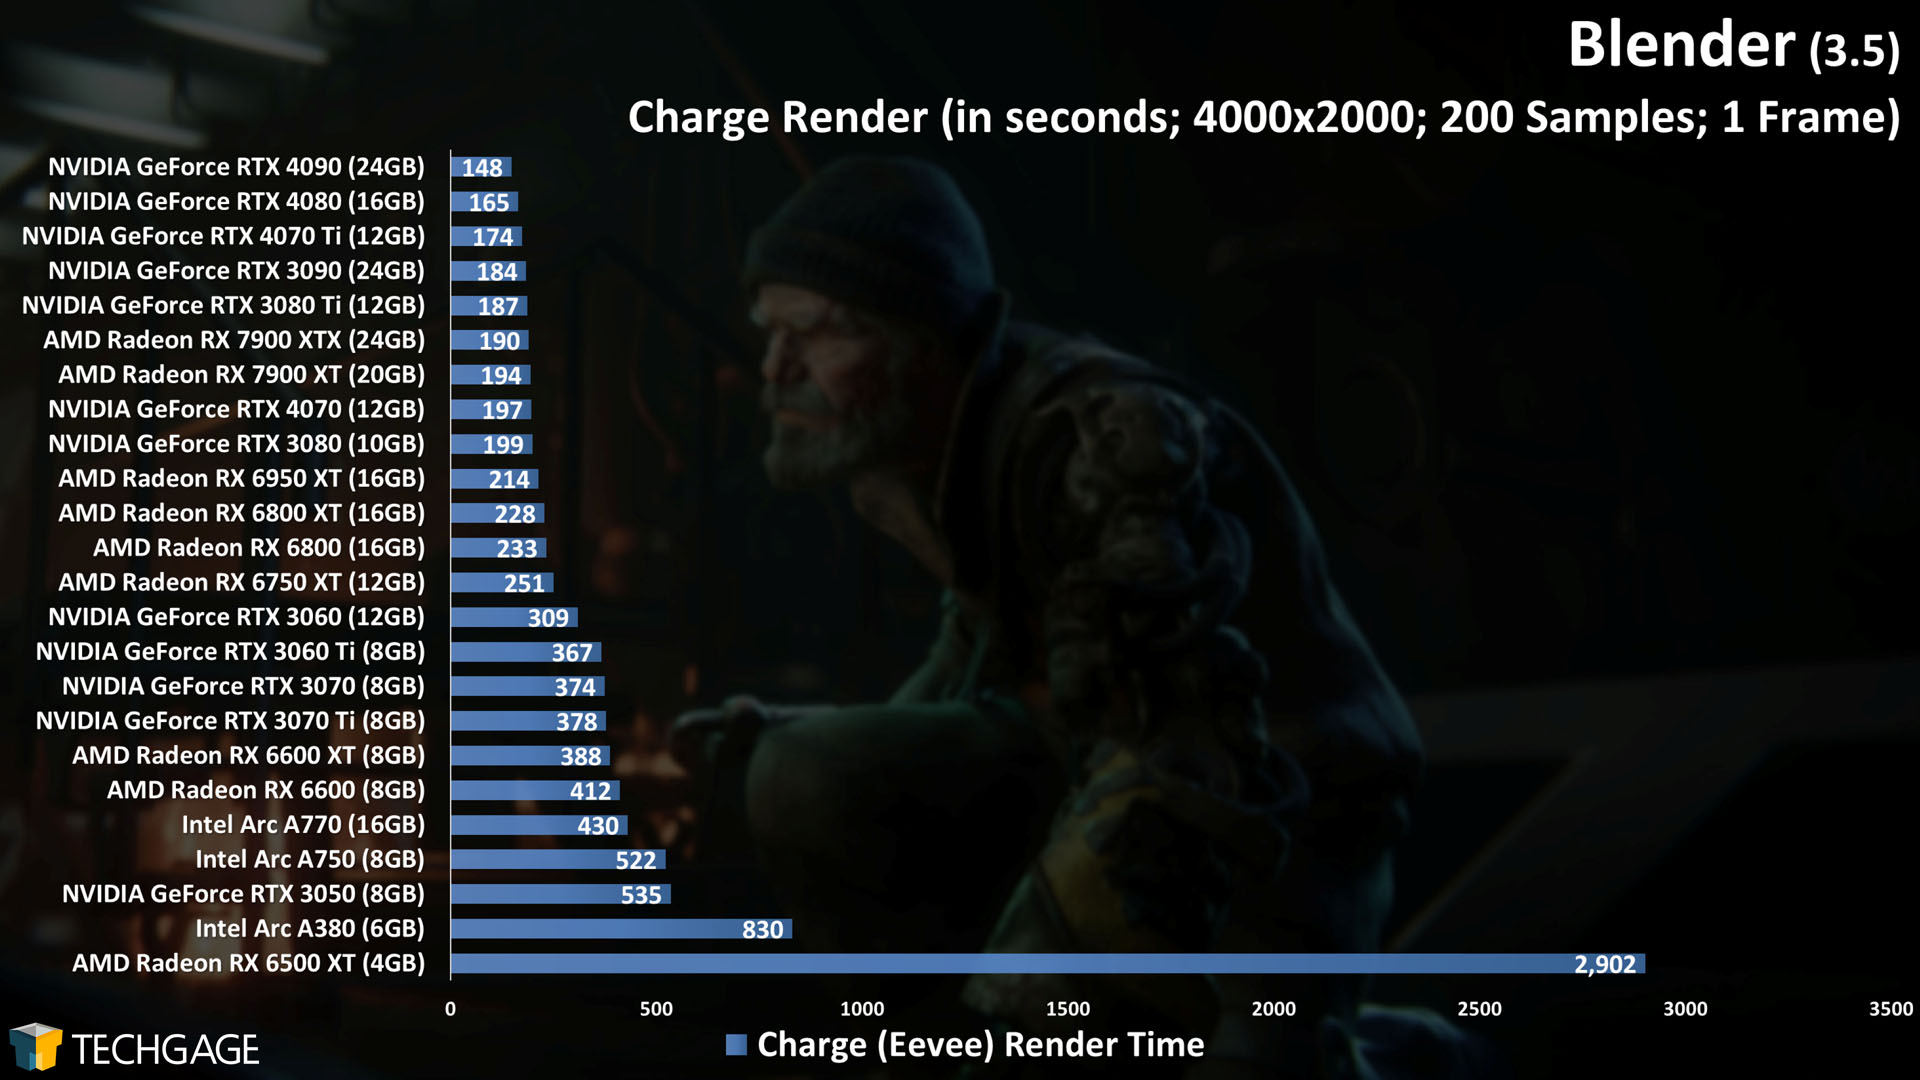
Due to a bug somewhere, we couldn’t test Blender 3.4’s official splash screen project Charge after that version’s launch due to a crashing issue when trying to render it. Thankfully, something changed since then, and it does render fine in 3.5:
Charge is the beefiest Eevee project we’ve tested so far, and when we see the RTX 3060 12GB beat out the RTX 3060 Ti 8GB, and also the A770 16GB leaping further ahead of the A750 8GB than it normally would, we see that big framebuffers matter.
Seeing this behavior is timely, as even on the gaming side of the market, the general consensus lately is that 8GB is a bare minimum; it’s not enough to make you feel like you’re “future-proofing” your rig. Less complex projects won’t run into a limit easily, but advanced projects like Charge prove that it’s important to go beyond 8GB if you can.
Viewport: Material Preview, Solid & Wireframe
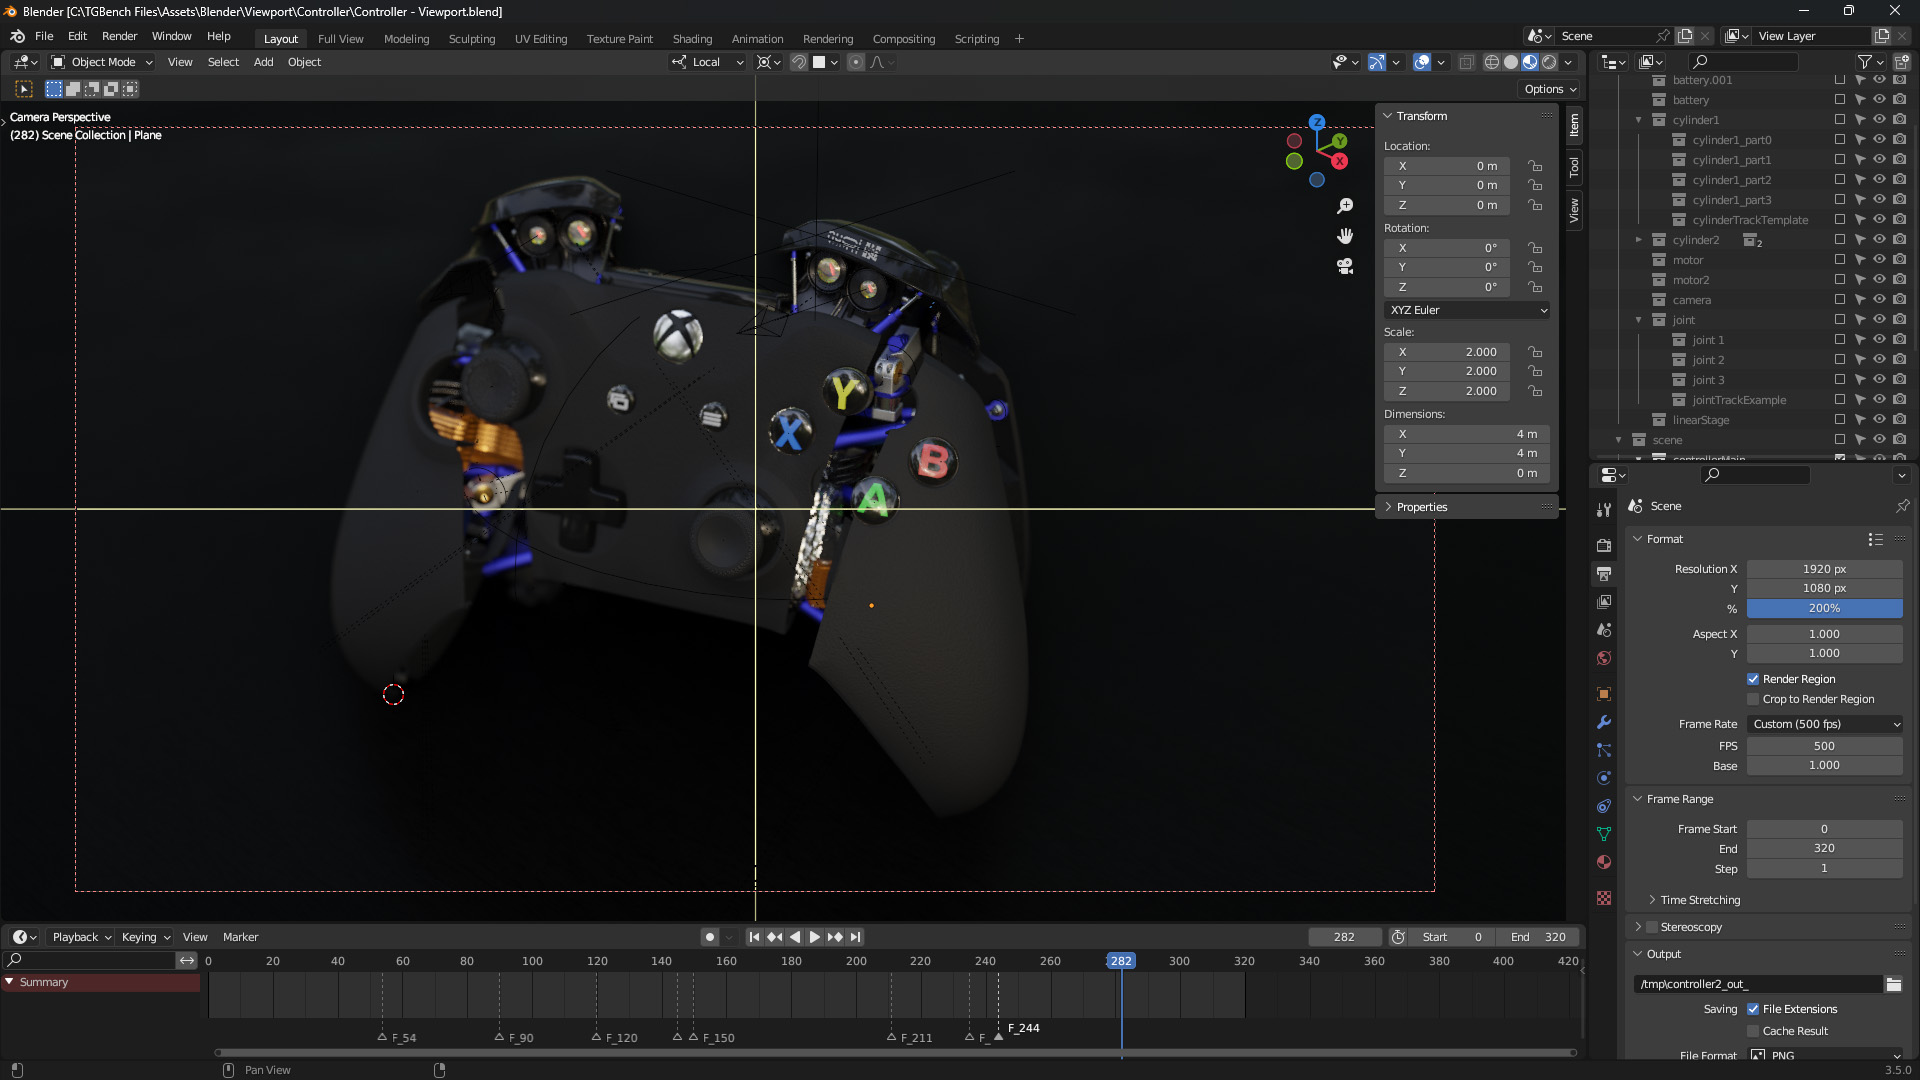
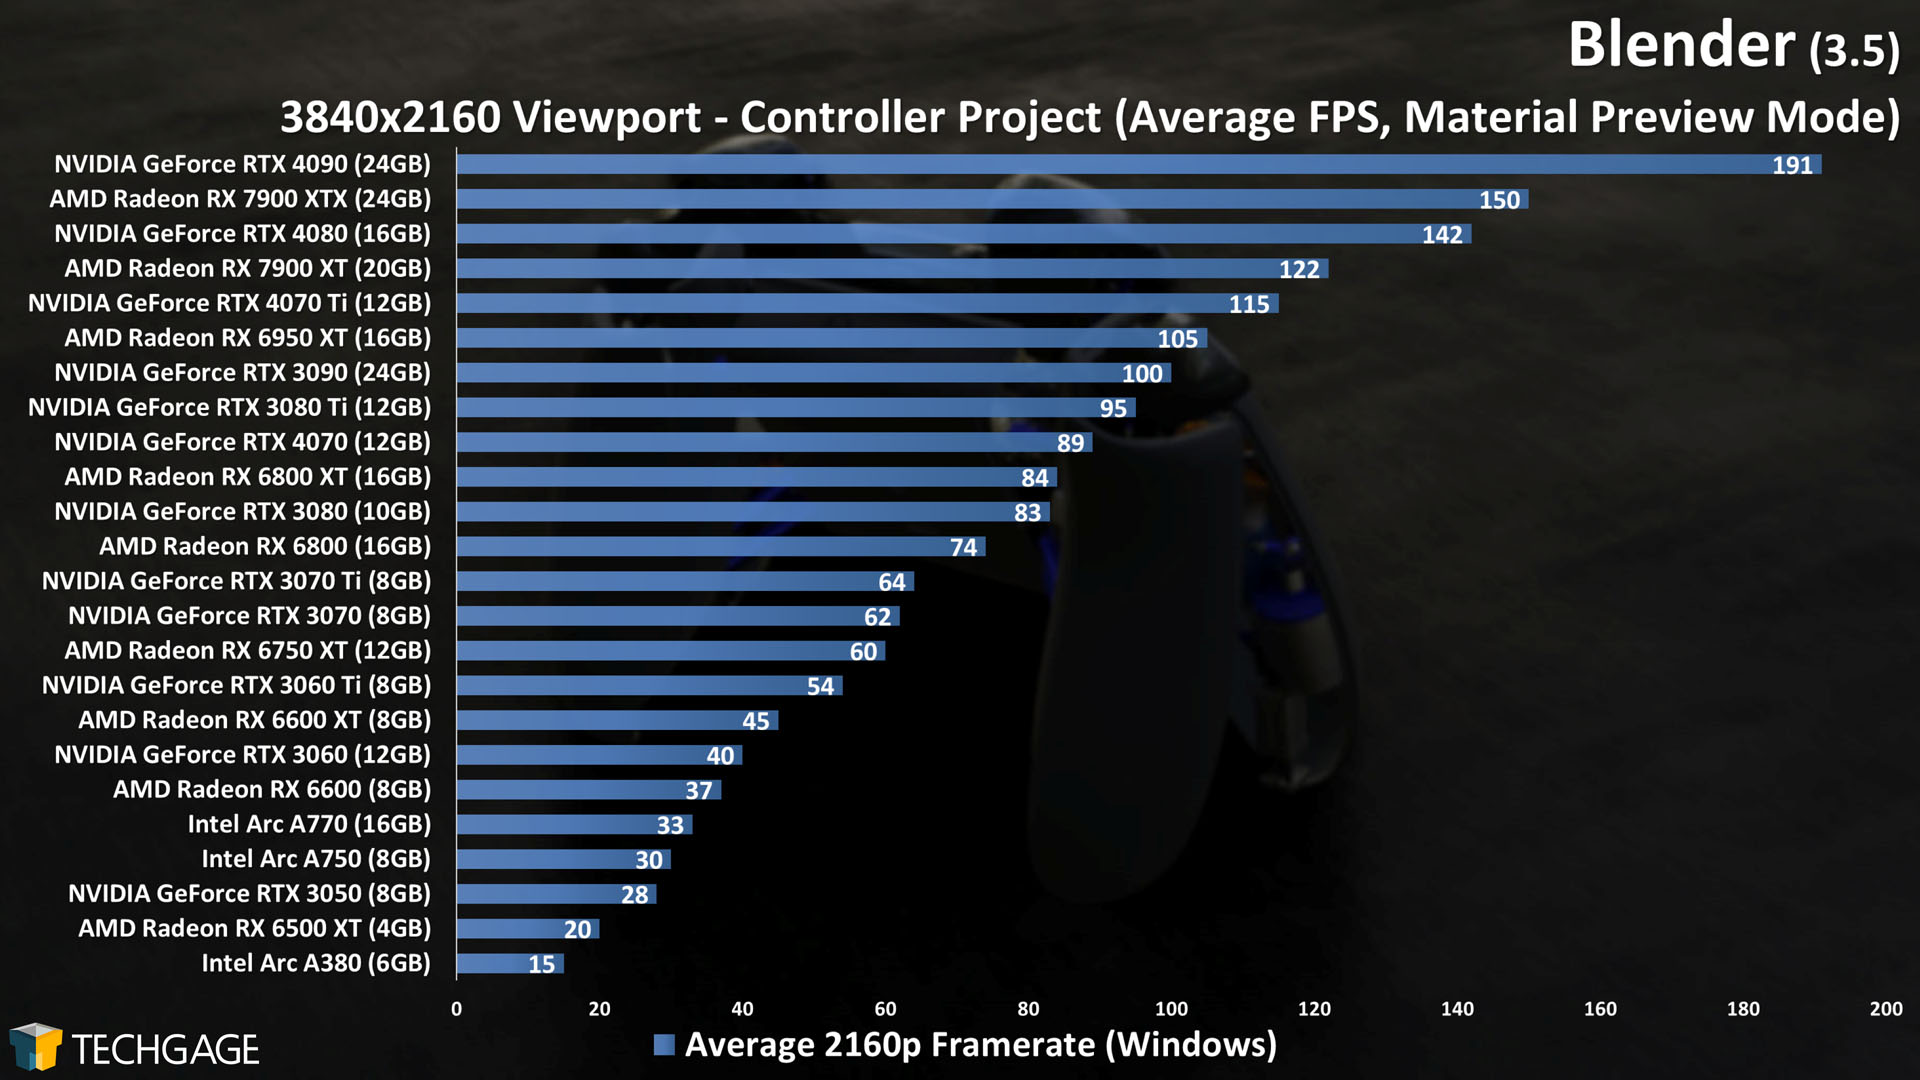
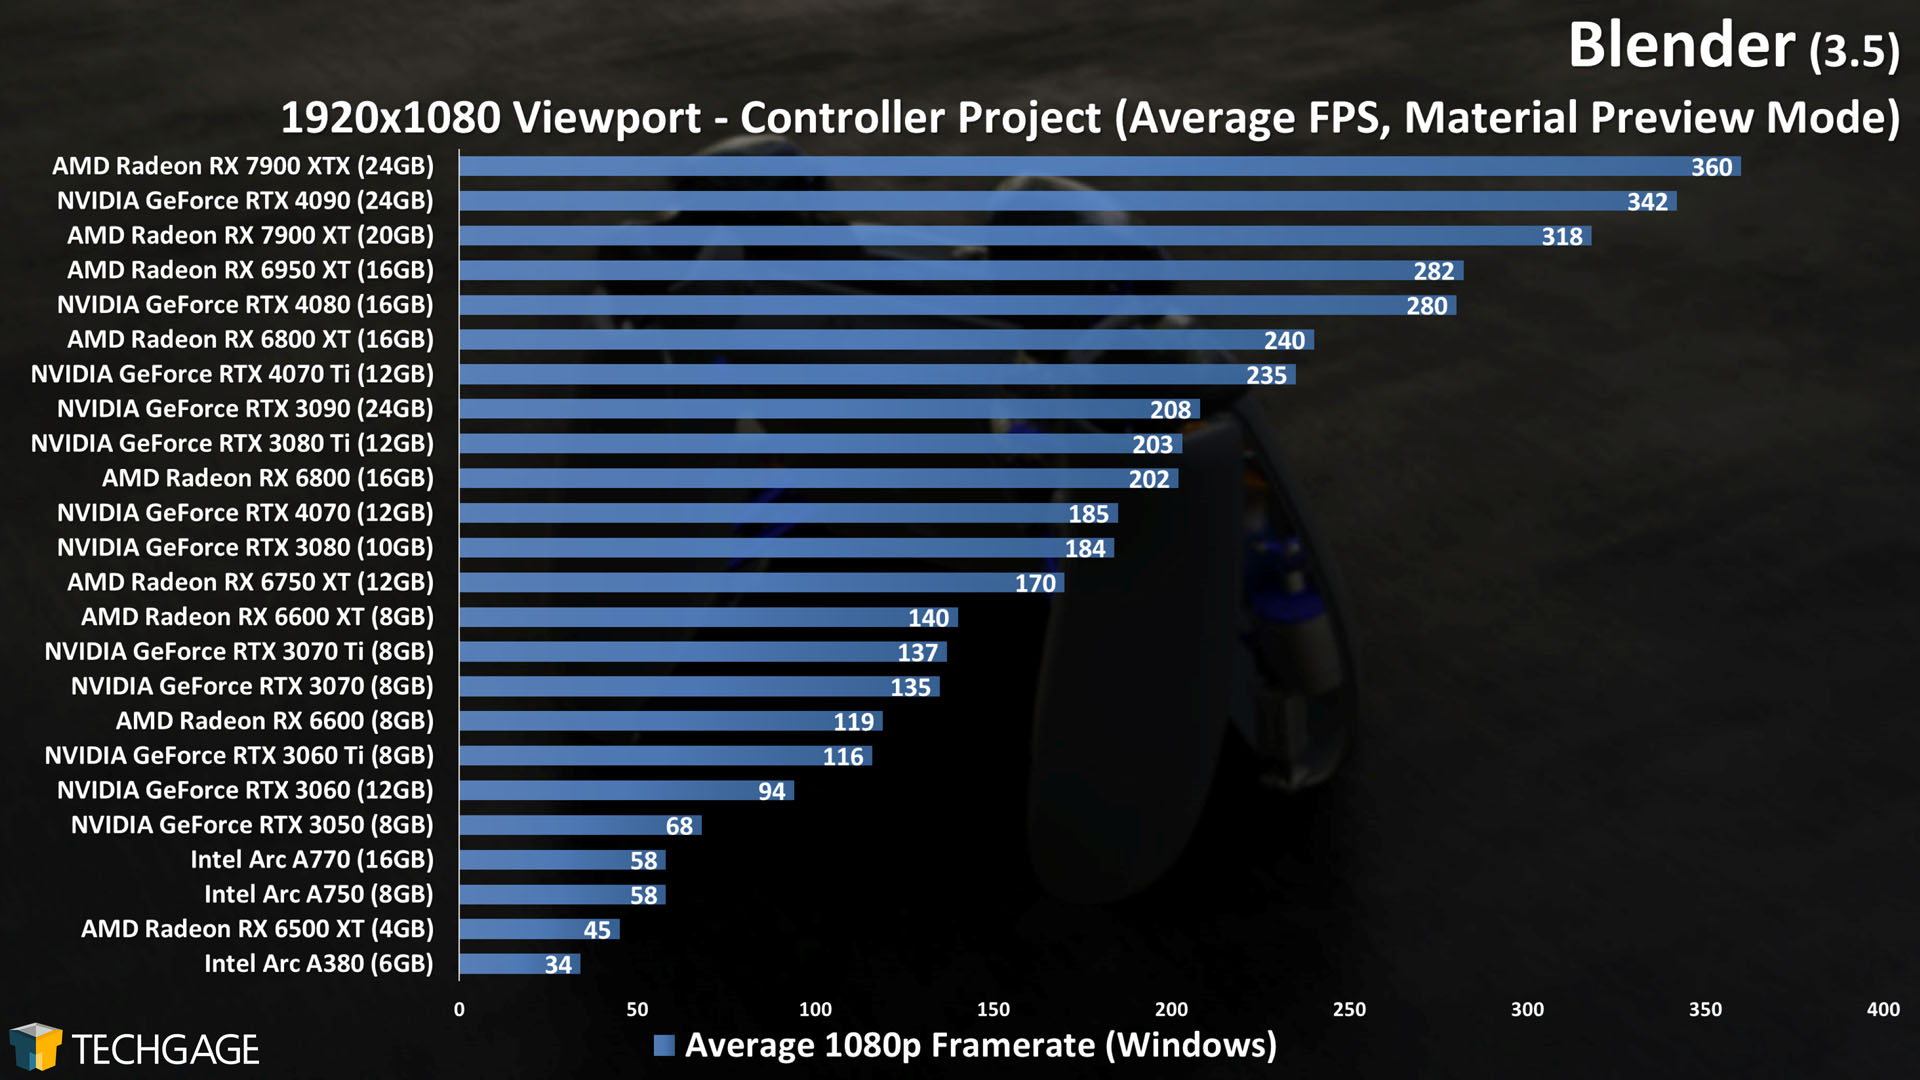
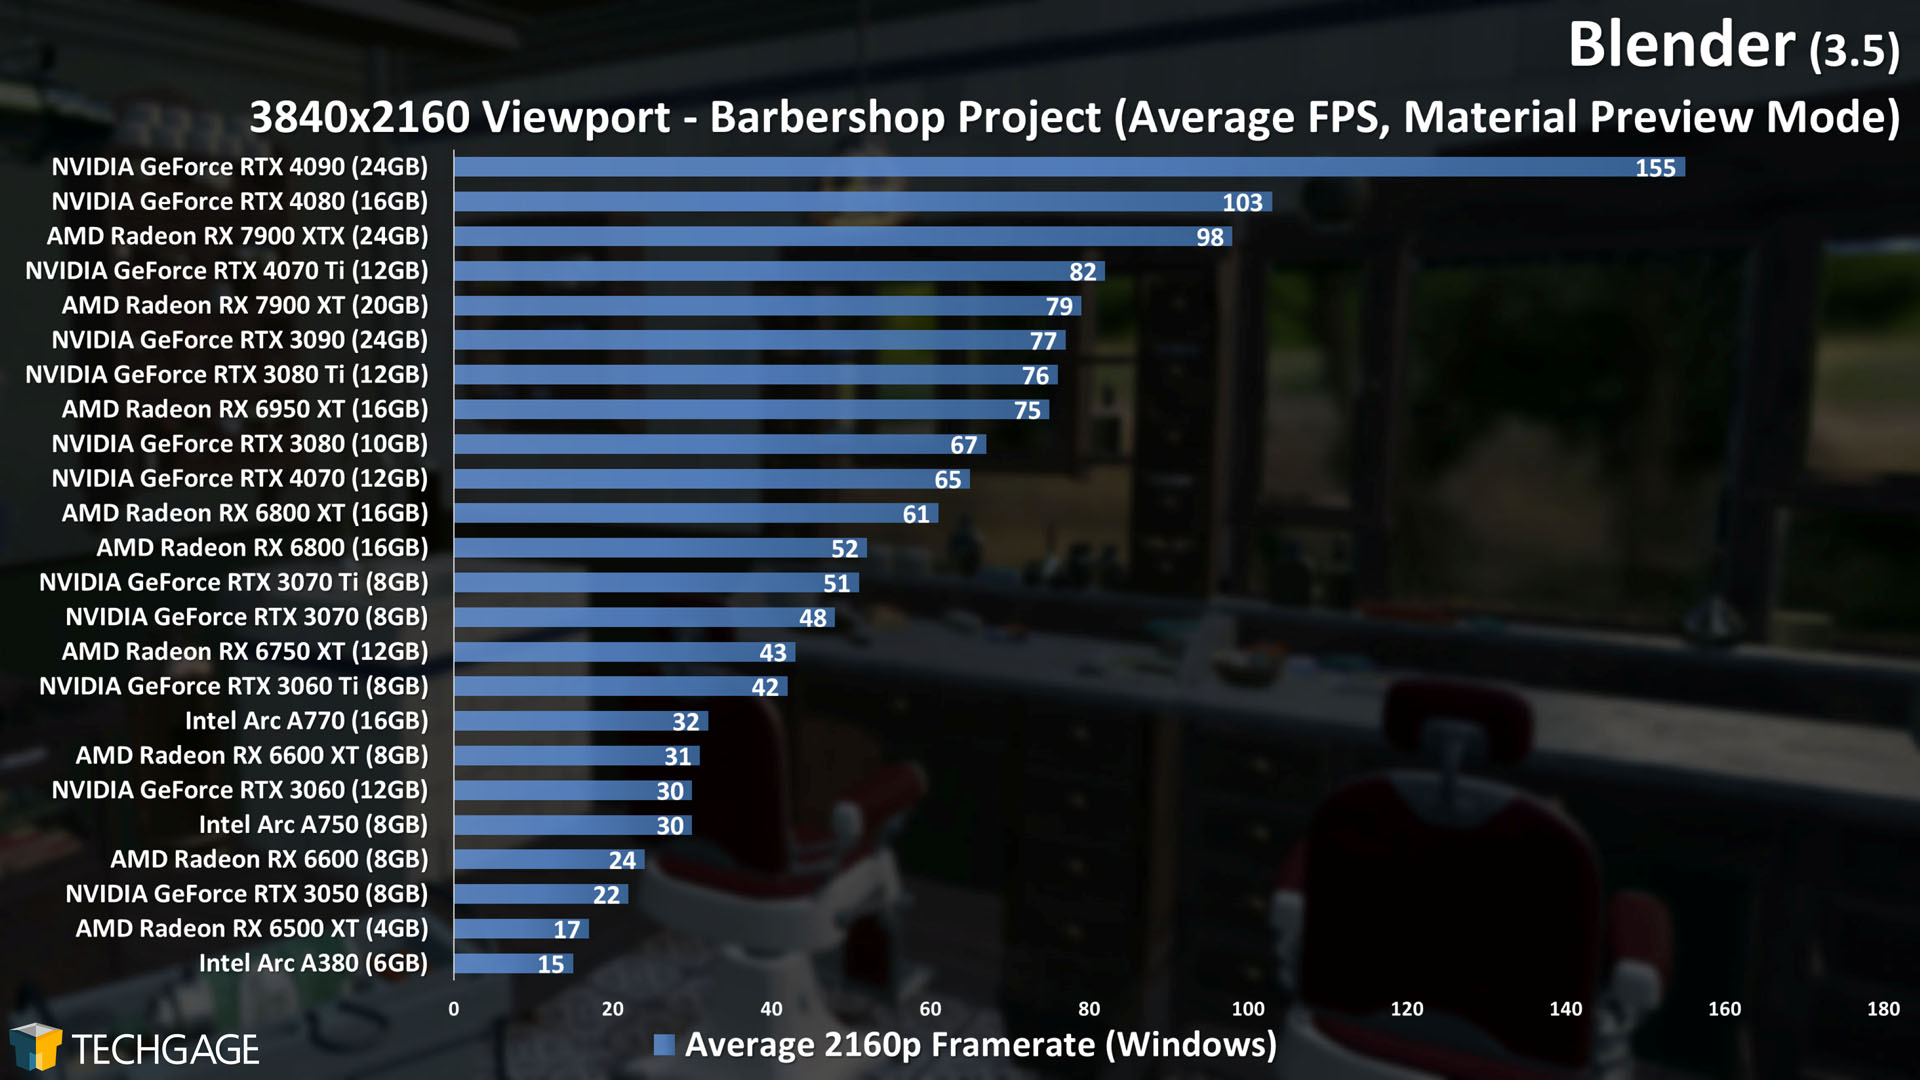
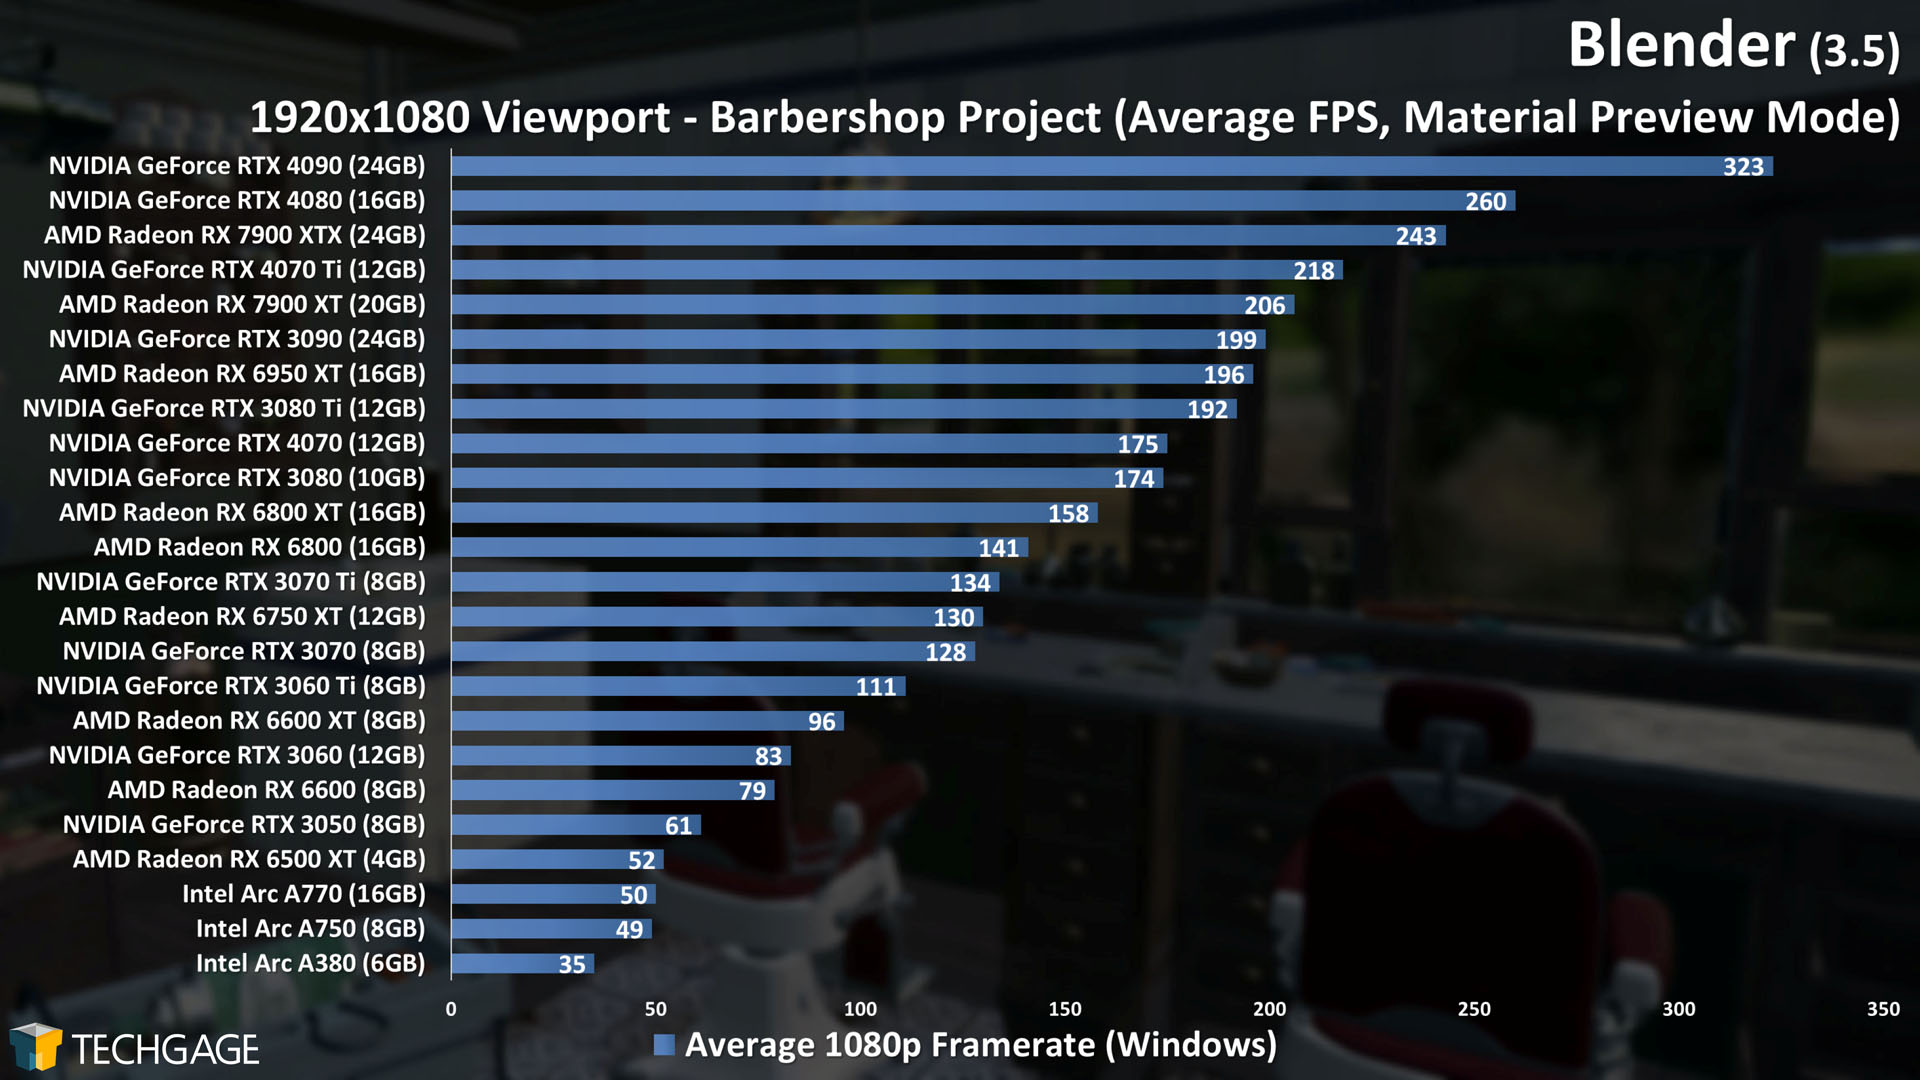
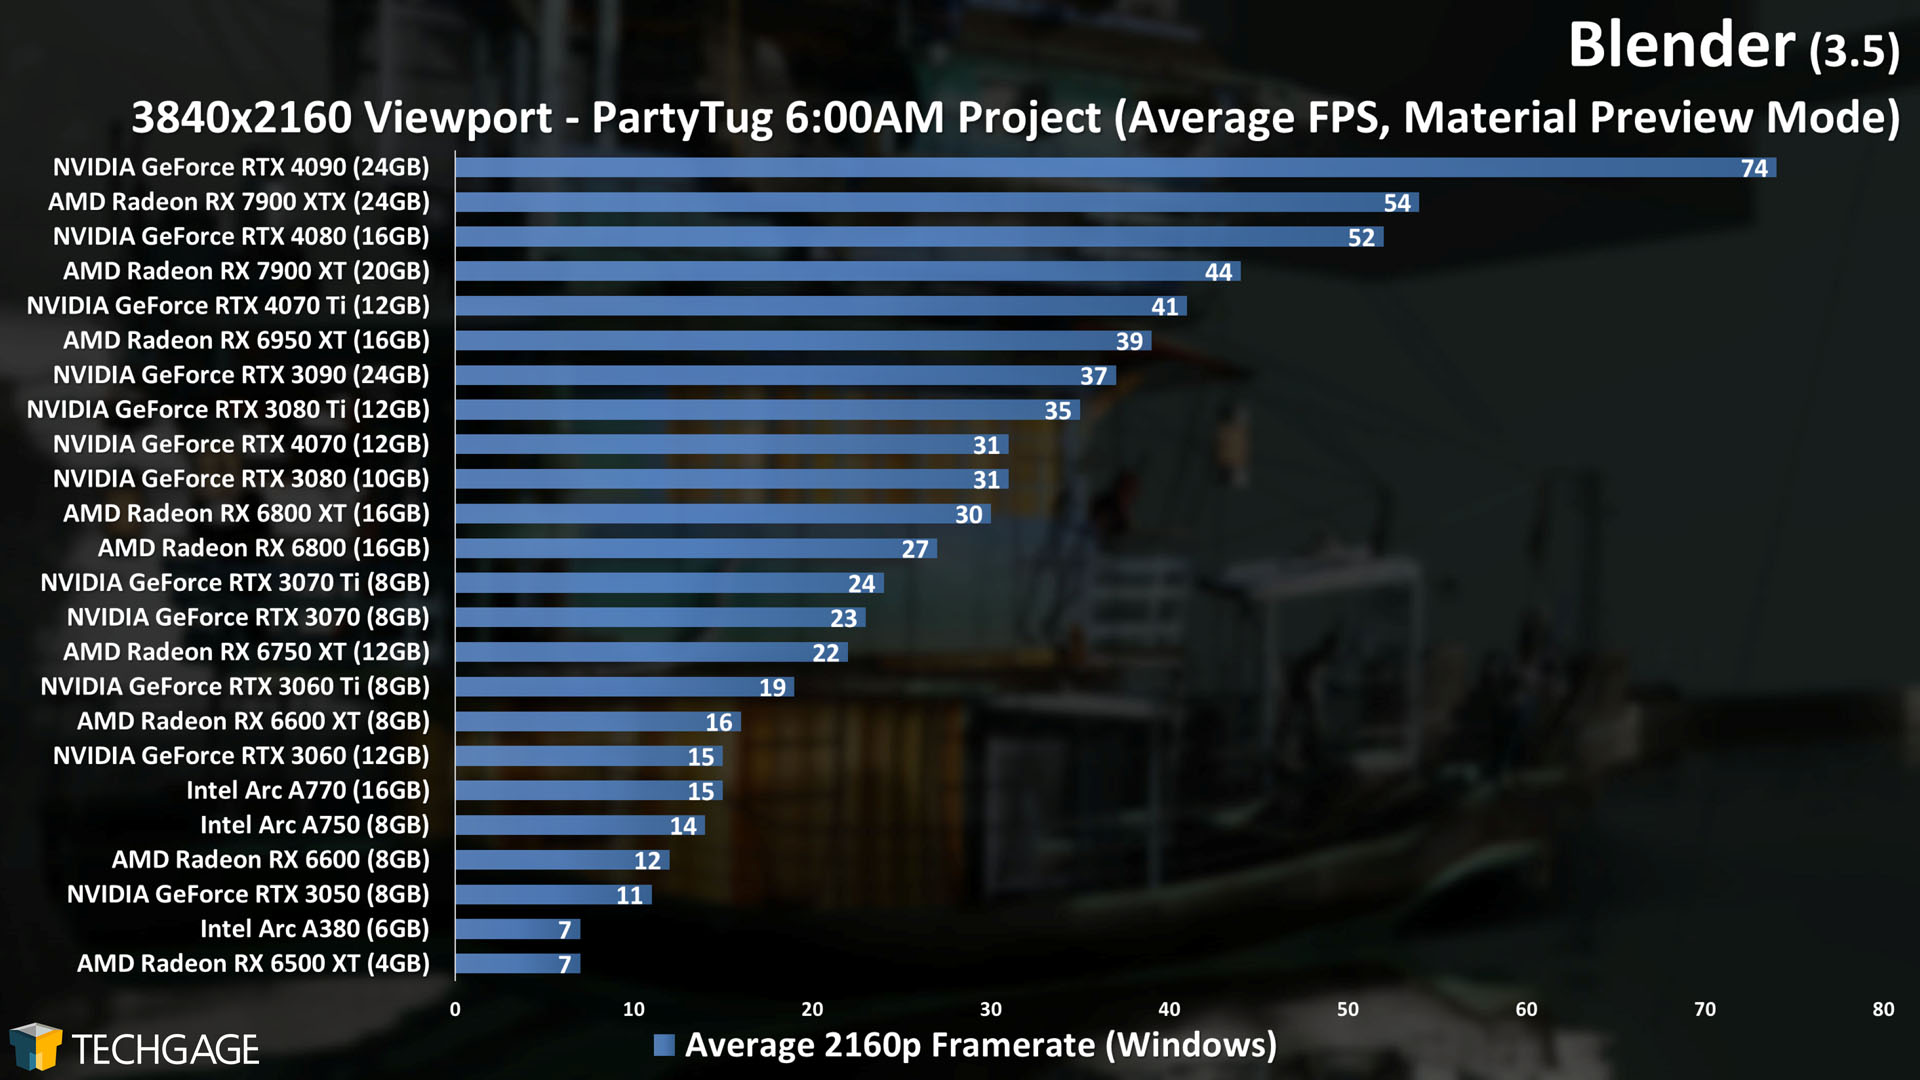
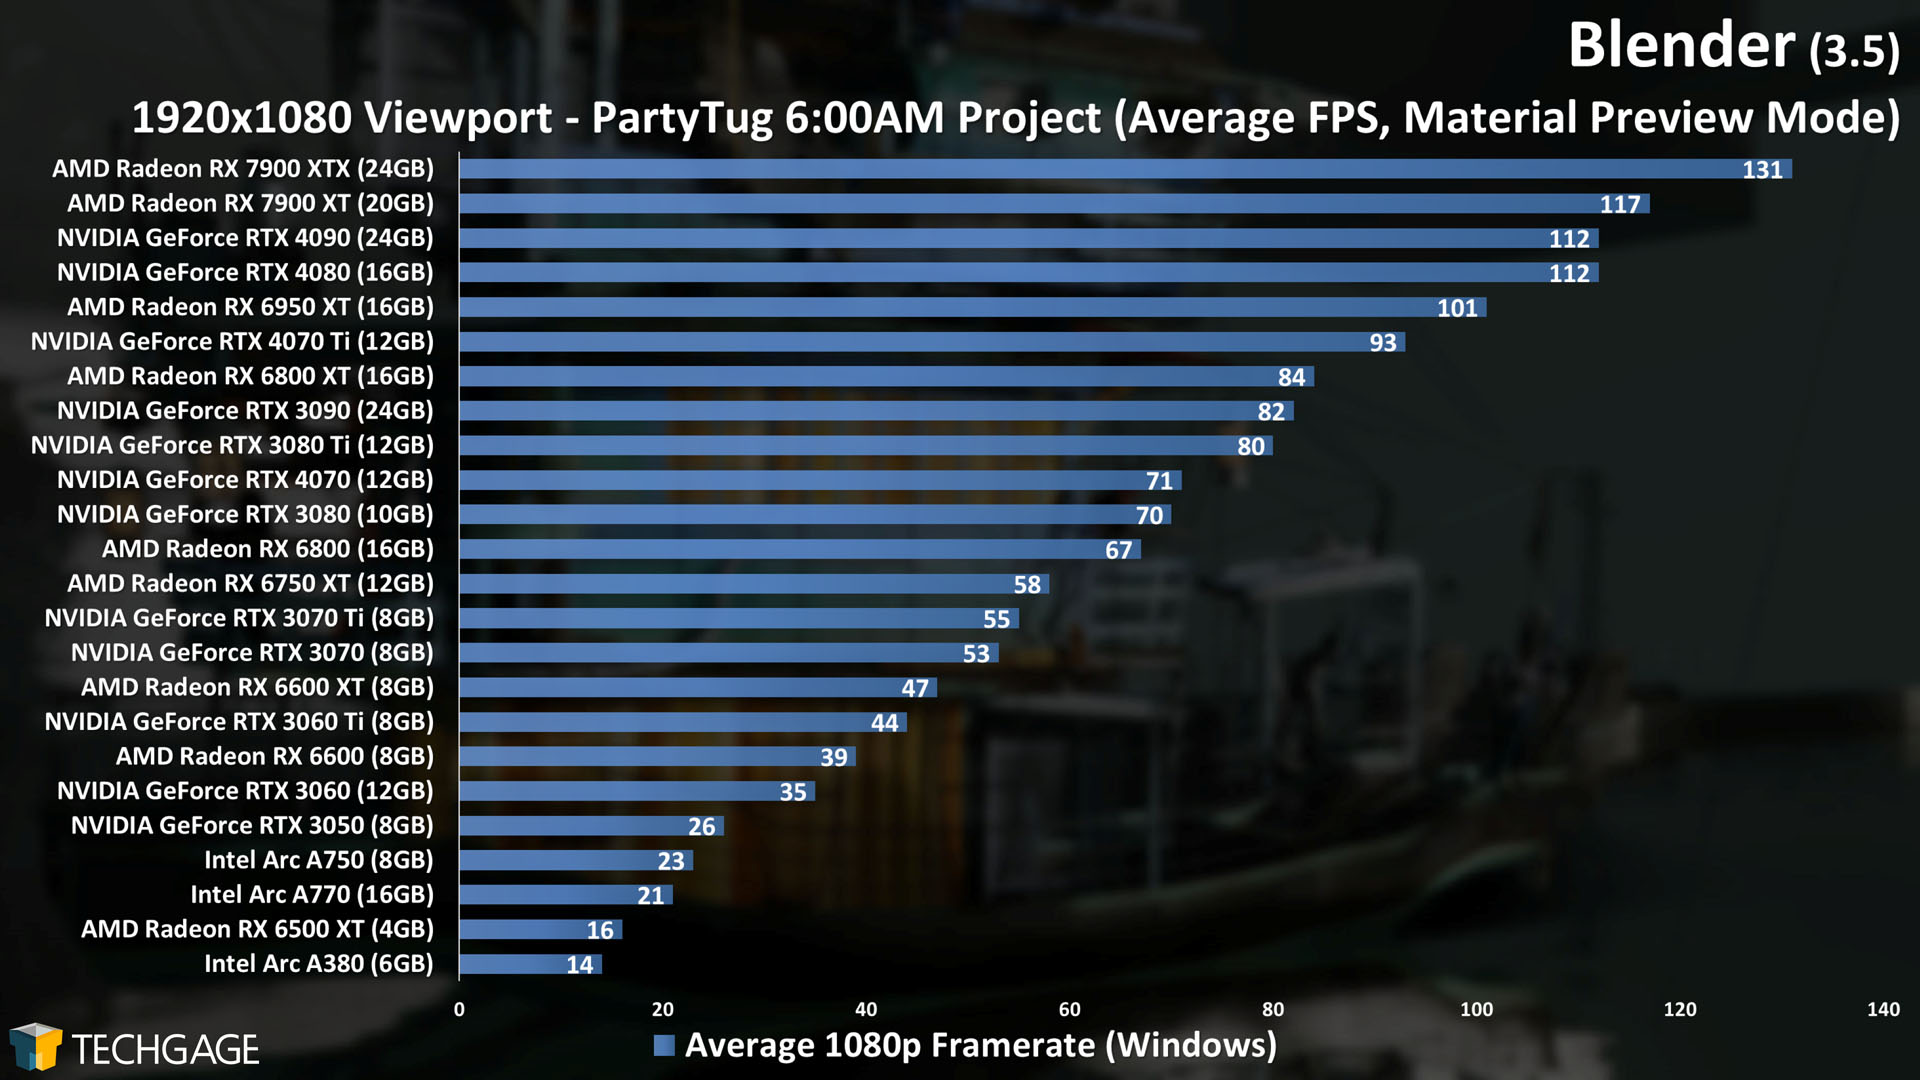
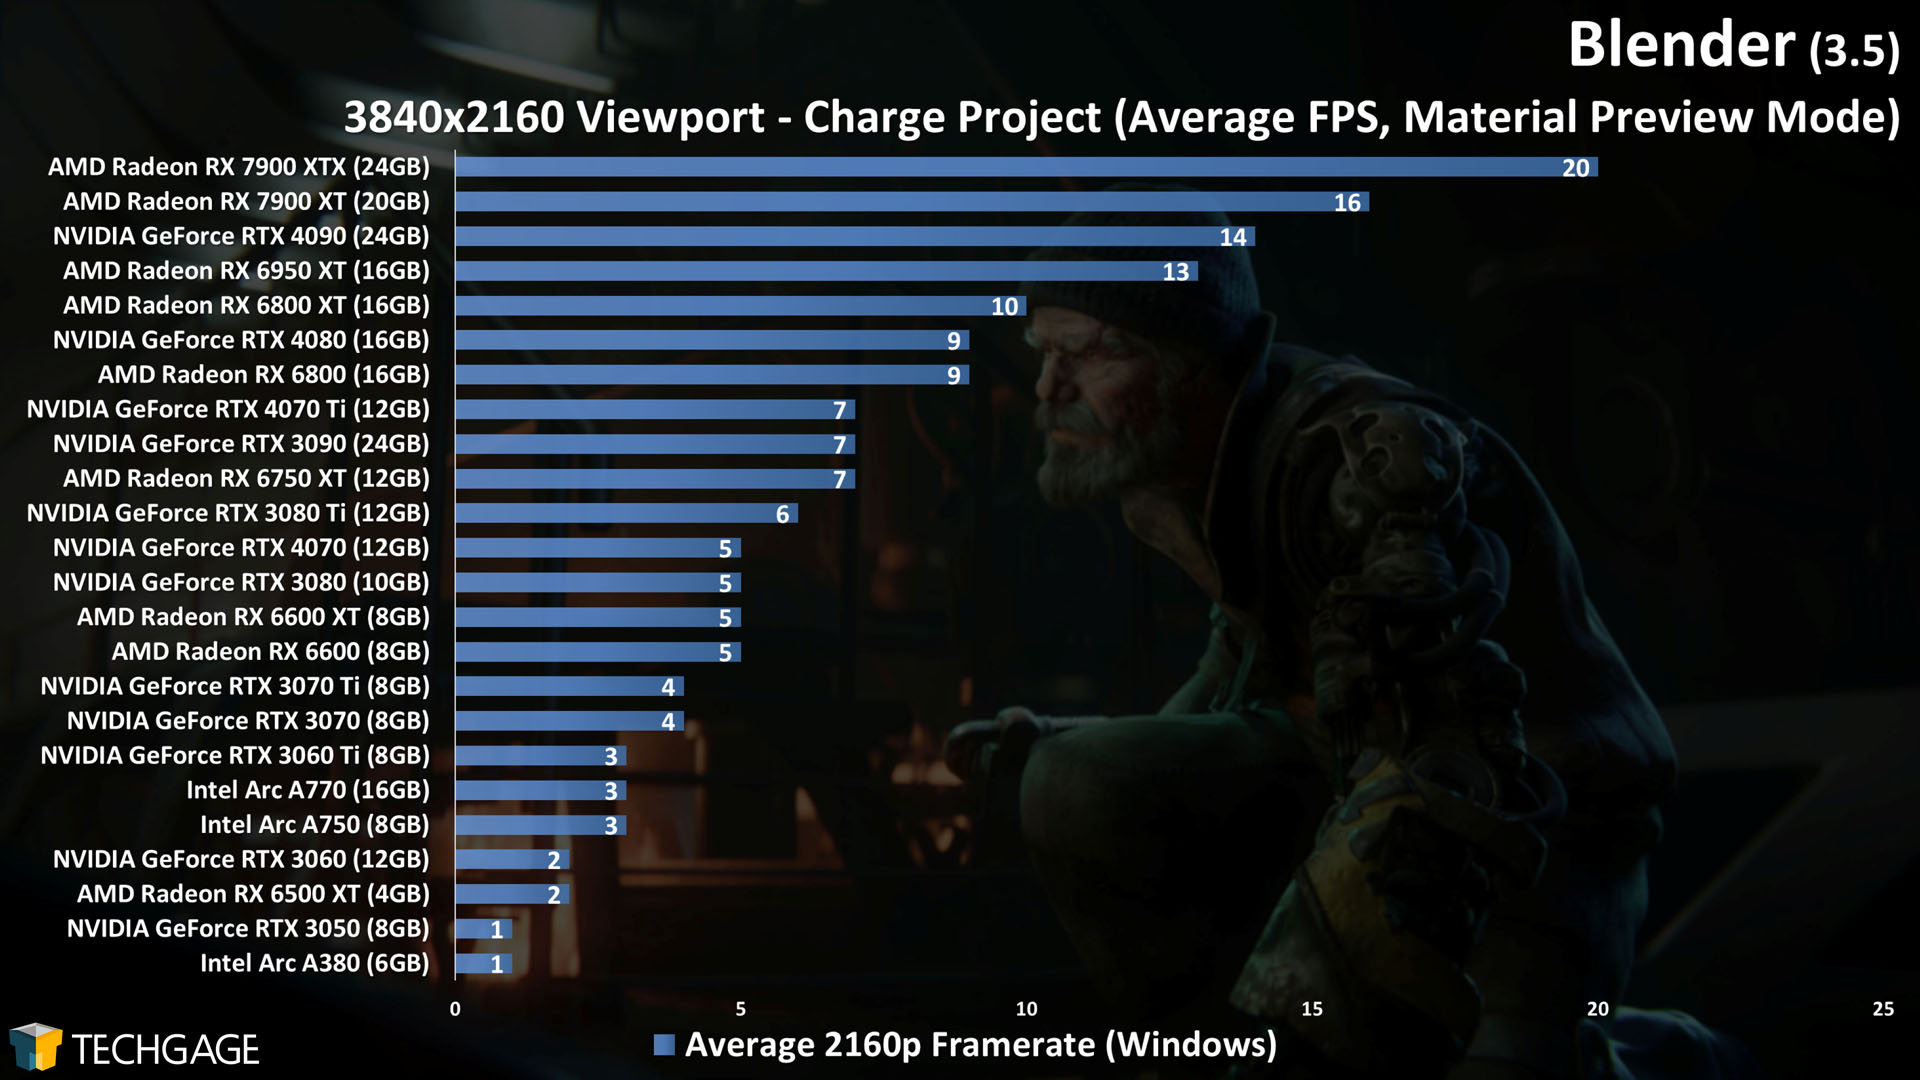
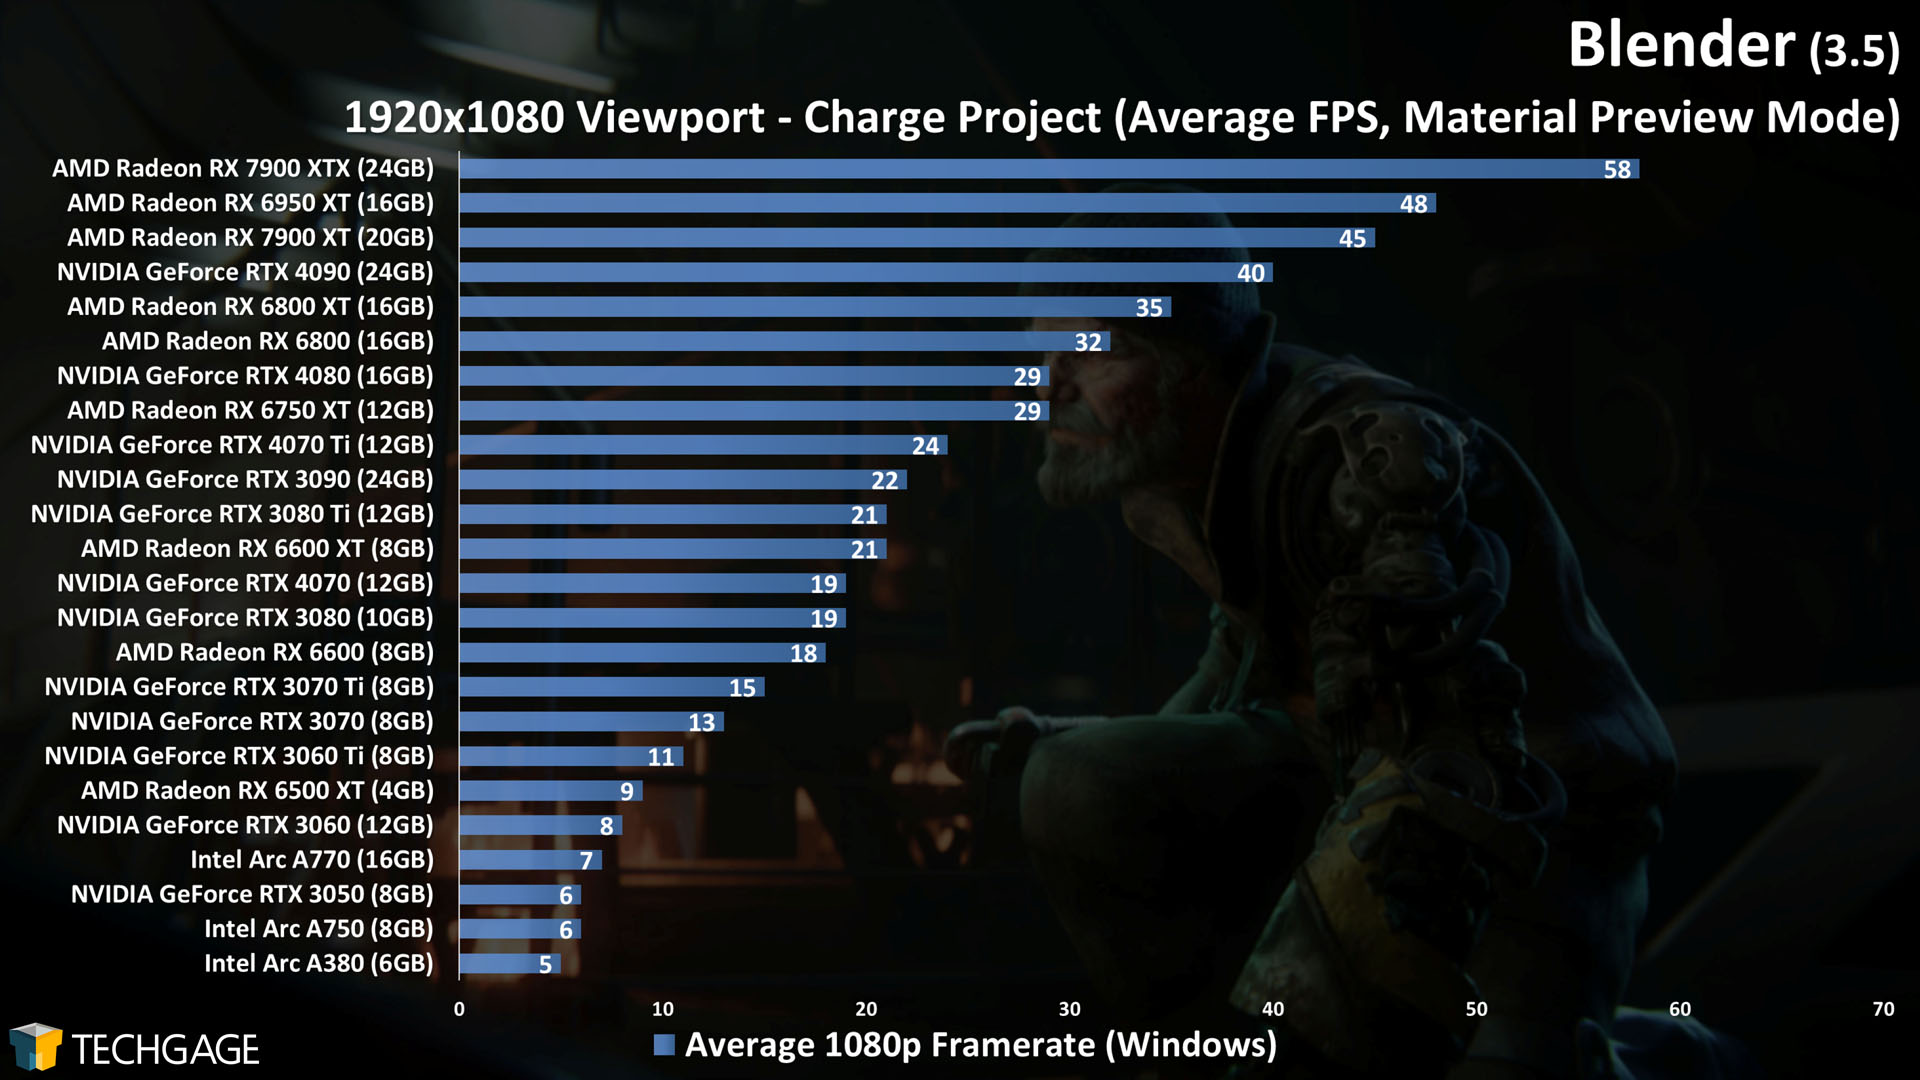
Since the Charge project we just talked about is so demanding, we decided to add it as a viewport test, and see how it fares. As it happens, that project isn’t just demanding for rendering, but also viewport interaction! But first, let’s take a look at the returning projects:
We haven’t been seeing many viewport-related performance changes recently, which is one of the reasons we felt compelled to add a fourth project, just to see what unique perspective we could gain. Interestingly, though, we actually do see some performance changes this time.
When we look back at our previous data, we see almost no change in performance at 4K, but every set of 1080p results highlights notable jumps in performance for most GPUs. We’re not sure what changed under Blender’s hood to lead to this performance increase, but as all three vendors see improvements, we assume the reason must be tethered to Blender itself, rather than GPU drivers.
A few specific comparisons: with the Controller project, AMD’s Radeon RX 7900 XTX improved from 279 FPS to 360 FPS between the current and previous Blender version. In the same test, Intel’s Arc A770 jumped from 44 FPS to 58 FPS, and NVIDIA’s GeForce RTX 4080 went from 220 FPS to 280 FPS.
One thing we did notice about these improvements, though, is that NVIDIA’s Ampere series hasn’t seen much of a change, while the rest of the architectures did – including Ada Lovelace.
With that covered, let’s check out the new beastly viewport test, using the Charge project:
Even the highest-end GPUs available right now will meet their limit quick with this project if a 4K viewport is used, but when we look at the more modest resolution of 1080p, the top-half of the chart will deliver suitable smoothness for altering.
It’s important to bear in mind that our viewport tests are a “worst-case scenario”, in that we configure the projects to take up most of the available workspace. Most workflows involve much smaller viewport windows, nestled in with the rest of the workspace UI, like this. Naturally, when there are fewer pixels to draw due to a smaller viewport window, the performance will jump.
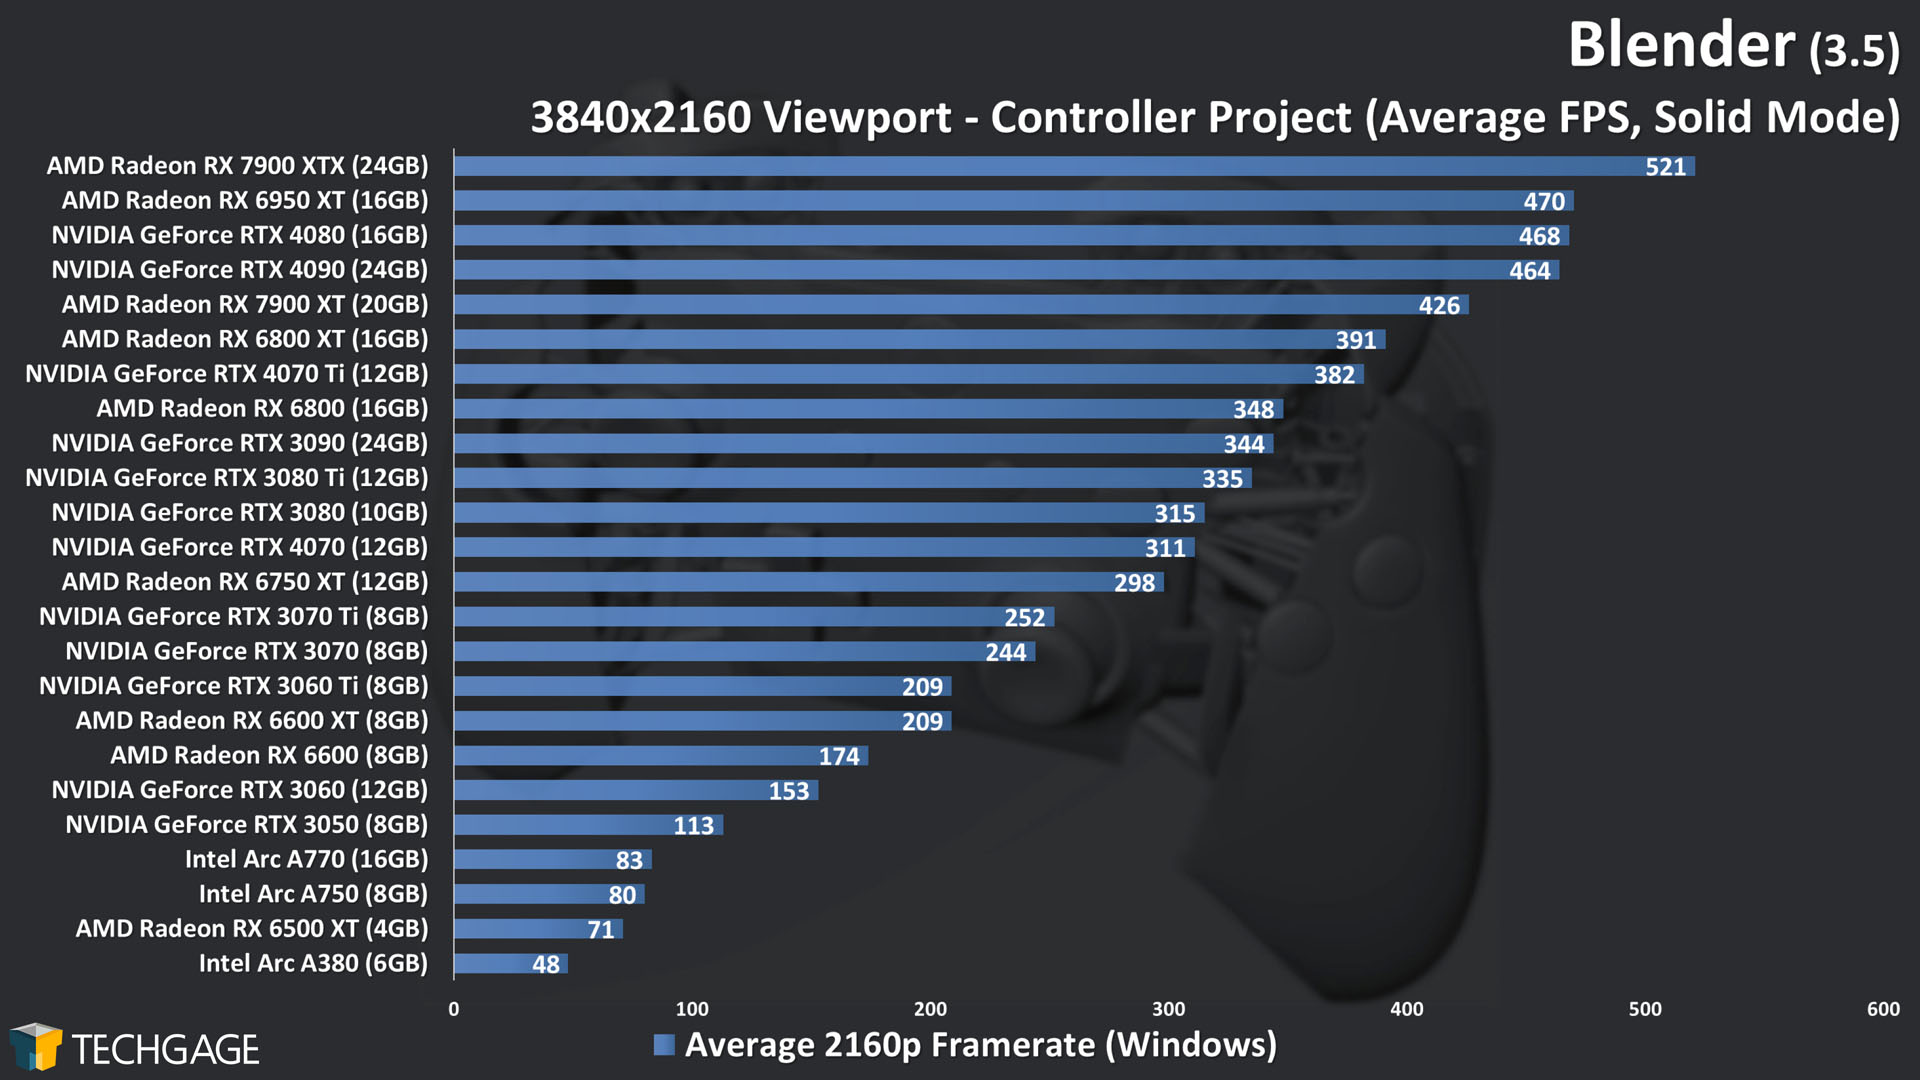
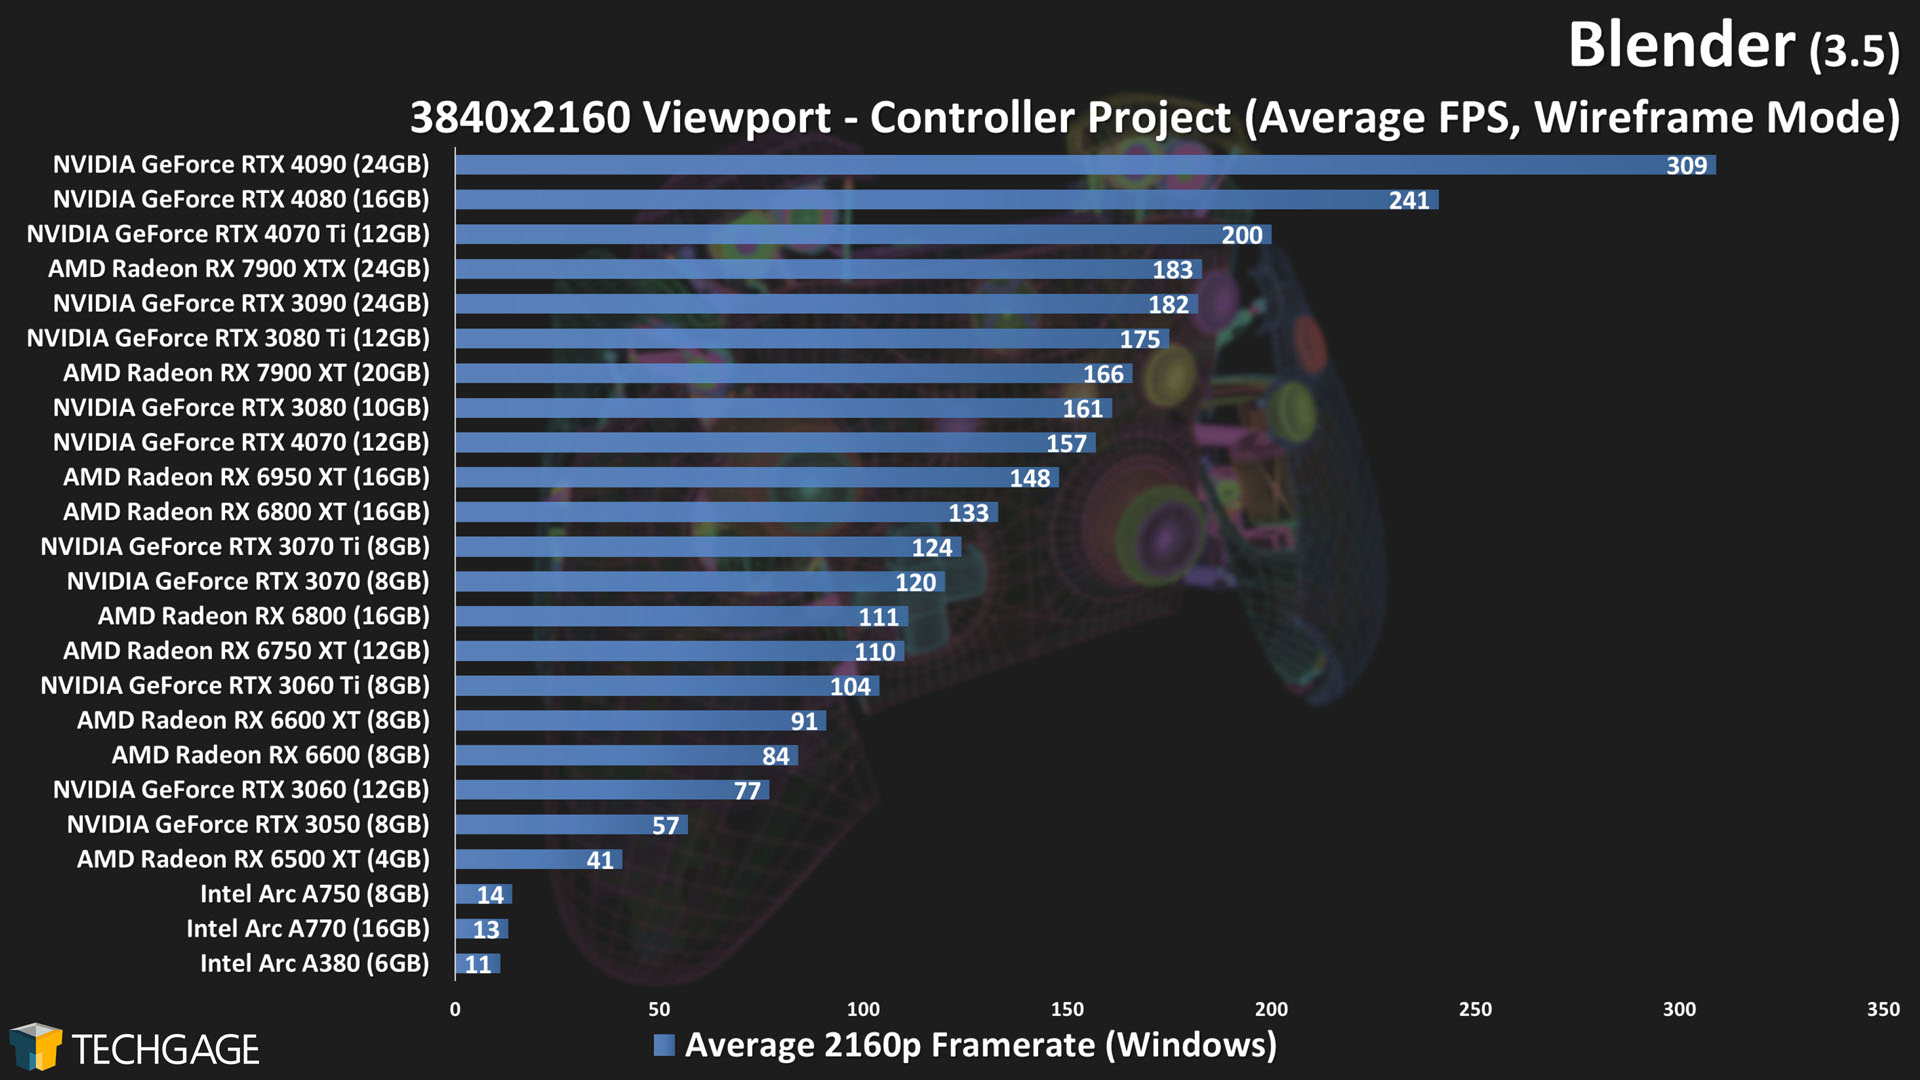
To wrap up our look at Blender’s viewport, here are 4K wireframe and solid mode tests using the Controller project:
As we saw with the 1080p Material Preview tests, performance has improved in both of these modes for most architectures, with the exception that NVIDIA’s Ampere generation hasn’t budged much, even though its Ada Lovelace generation has. Also, while Intel saw slight gains in the solid mode test, its wireframe performance continues to suffer considerably.
Wrapping Up
It’s impossible to properly “wrap up” a performance deep-dive like this, because everyone’s performance concerns are different. That said, we covered quite a bit in this article, including rendering, viewport, and even shader compiles. Hopefully you feel a bit more enlightened about the current state of Blender performance after reading.
Interesting takeaways to us include Intel’s improved shader compiling speed, generally improved viewport performance at 1080p for most GPUs, Charge being a great project for showing the limits of 8GB VRAM, and AMD managing to beat out NVIDIA in the Animal Fur project (thanks in part to some anomaly where CUDA is faster than OptiX).
Sometimes, there isn’t much of a performance change in one aspect of Blender from one version to the next, so it’s nice that we’re able to test multiple projects and scenarios in case something becomes notable. This 3.5 testing actually proved more interesting than we anticipated, and we feel confident that the forthcoming 3.6 launch is going to pull off the same.
Both AMD and Intel will have their respective APIs updated in Blender 3.6 to support ray tracing acceleration. Currently, both API updates are available in the 3.6 beta, which can be snagged here. With that being the case, we expect to dig into testing soon!
May 31 Addendum: Updated conclusion to reflect Intel RT acceleration availability in Blender 3.6 beta.
Support our efforts! With ad revenue at an all-time low for written websites, we're relying more than ever on reader support to help us continue putting so much effort into this type of content. You can support us by becoming a Patron, or by using our Amazon shopping affiliate links listed through our articles. Thanks for your support!


