- Qualcomm Launches Snapdragon 4 Gen 2 Mobile Platform
- AMD Launches Ryzen PRO 7000 Series Mobile & Desktop Platform
- Intel Launches Sleek Single-Slot Arc Pro A60 Workstation Graphics Card
- NVIDIA Announces Latest Ada Lovelace Additions: GeForce RTX 4060 Ti & RTX 4060
- Maxon Redshift With AMD Radeon GPU Rendering Support Now Available
Social & RSS Feeds
Latest Videos


Latest News
Intel Z68 SSD Disk Caching Showdown
by Ryan Perry on June 20, 2011 in Storage
When we tested out Intel’s ‘Smart Response Technology’ last month, we liked what we saw. But at $110 for a 20GB SLC SSD, we wondered if a larger, more cost-effective option could still make the best use of the technology. With that, we’re pitting Kingston’s SSDNow V+100 64GB drive, at $150, against Intel’s, to see if we retain SRT’s effectiveness.
Page 2 – Testing; Synthetic Results
With the exception of PCMark 7, the same group of synthetic and real-world benchmarks that were used in our initial testing will be used again, along with the same test system. The HDD that will be accelerated by the SSDs has been loaded with an exact image of the Windows installation that was used in the previous tests. Just as before, all tests were run through once to cache the data to the SSD and then five additional times to gather the results.
In the original article I covered the what, why and how of our testing, so feel free to brush up on that before proceeding. For now, it’s full steam ahead!
The components used in our test system are:
|
Component
|
Techgage Test System
|
| Processor |
Intel Core i5-2400 – Quad-Core (3.10GHz)
|
| Motherboard |
GIGABYTE Z68X-UD5-B3 – Z68-based
|
| Memory |
Corsair Dominator 2x2GB DDR3 1600mhz 9-9-9-24-2T
|
| Graphics |
Sapphire Radeon HD 6850 Toxic
|
| Audio |
On-Board Audio
|
| Storage |
Intel 20GB 311 SATA II SSD
Kingston 64GB SDnow 100V+ SATA II SSD |
| Power Supply |
Corsair HX650 650W
|
| Chassis |
Thermaltake Armour A90
|
| CPU Cooling |
Stock
|
| Et cetera |
Windows 7 Ultimate 64-bit
|
CrystalDiskMark 3.0.1
Synthetic benchmarks do not provide real-world performance numbers but they do allow for an overall idea of what to expect and are great in head-to-head drive comparison tests. CrystalDiskMark was the first synthetic benchmark that we used to test overall performance with disk caching enabled. It provides sequential read and write speeds but also random read and write speeds for 512KB and 4KB files.

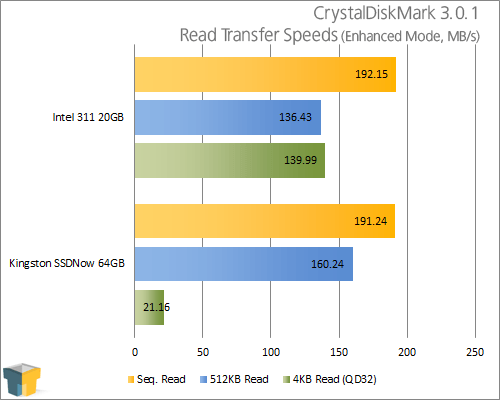
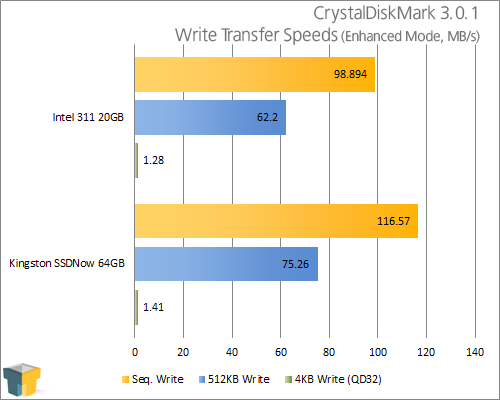
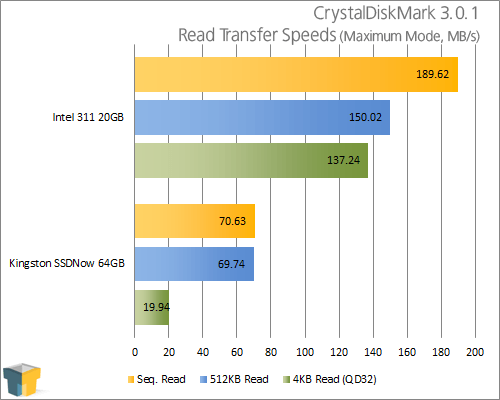
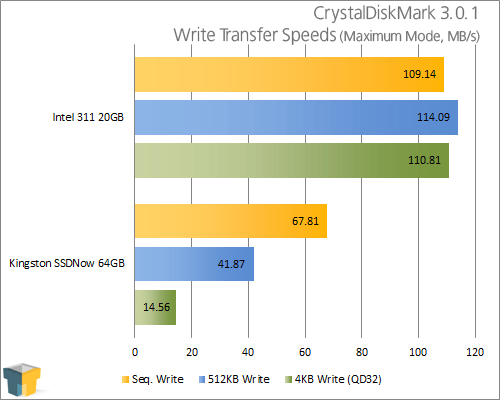
With enhanced mode enabled, I was very happy with how the Kingston drive performed until it came to the 4KB read and write results at a queue depth (QD) of 32. When the switch was flipped for maximum acceleration, the results from the Kingston drive made no sense.
There were huge losses across almost all areas with only the 4KB write speed showing an increase. Seeing how the only difference between the two modes of acceleration should be write speed with maximum acceleration not being limited to the write speed of the HDD, I am at a loss for why these numbers were returned.
PCMark 7 1.04
Futuremark’s newest incarnation of its PCMark benchmark suite has just been released, so to remain current (and to test out a new toy) I decided to discard the previous PCMark Vantage results from the original article and run the storage suite on both drives. PCMark 7 performs several synthetic tests using specific scenarios to simulate real-world use and reports the data in MB/s before turning each result into a final numerical score.

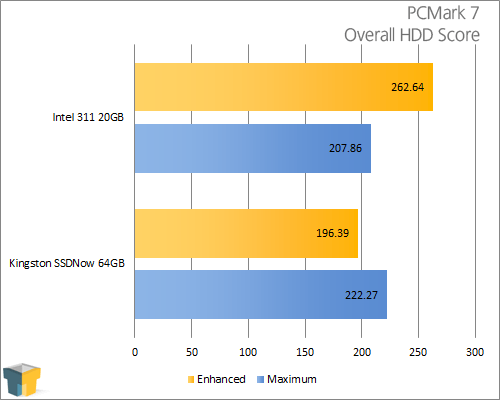
Just like with Vantage, PCMark 7 does not go into detail about what makes up the tests that were run in order to gather the throughput numbers. Despite the higher read and write speed of the Kingston drive, the Intel SSD comes out on top by over 580 points with enhanced acceleration mode enabled and over 800 points when switched to maximum acceleration mode.
A strange trend that seems to carry over from the first round of testing in the original article is that some tests show a decrease in numbers when using maximum acceleration.

Support our efforts! With ad revenue at an all-time low for written websites, we're relying more than ever on reader support to help us continue putting so much effort into this type of content. You can support us by becoming a Patron, or by using our Amazon shopping affiliate links listed through our articles. Thanks for your support!