- Qualcomm Launches Snapdragon 4 Gen 2 Mobile Platform
- AMD Launches Ryzen PRO 7000 Series Mobile & Desktop Platform
- Intel Launches Sleek Single-Slot Arc Pro A60 Workstation Graphics Card
- NVIDIA Announces Latest Ada Lovelace Additions: GeForce RTX 4060 Ti & RTX 4060
- Maxon Redshift With AMD Radeon GPU Rendering Support Now Available
Social & RSS Feeds
Latest Videos


Latest News
Matrox TripleHead2Go
by Greg King on June 22, 2006 in Graphics & Displays
We have all dealt with products that, on paper, are full of promise. These products generate a lot of hype and buzz but once they become hands on, the magic surrounding them seems to disappear. Today we are taking a look at a product that seems almost too good to be true.
Page 4 – Compatibility
The TH2Go offers use with 2D applications as well as 3D gaming. This is all fine and good but there are still compatibility issues with some graphics cards. In the picture below, you can see that NVIDIA works well in both 2D and 3D when used with any GeForce 4 card and up and can do so in the maximum resolution. Sadly, ATI cannot do this as of yet when working at the maximum resolution of 3840×1024.
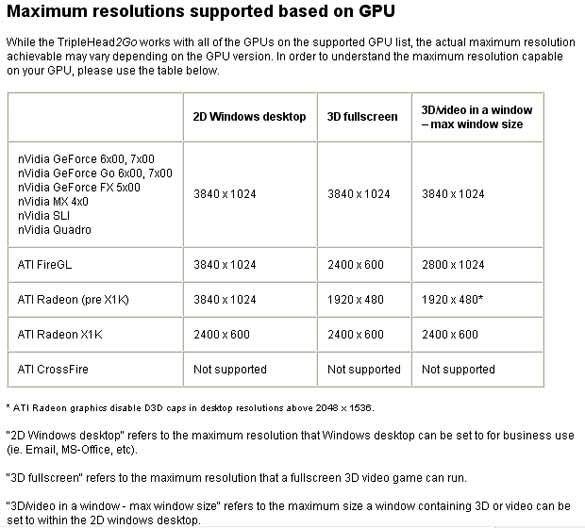
For those of you readers who are working with ATIs Crossfire, the TH2Go will not work for you. For those of you with NVIDIAs SLI, rejoice, as your setups can run with the TH2Go. I currently am running a pair of 7800 GTs and I am curious as to how important SLI will be when running at the ridiculous resolution of 3840×1024.
Test Setup Information:
For this review, I am using my everyday PC at everyday settings. My PC specs are as follows:
- Processor – AMD 3700+ San Diego 1MB L2 @ 2.5 GHz
- Motherboard – DFI LAN Party Ultra – D (SLi mod)
- Video Card – eVga 7800 GT x 2 (445 MHz/1.07 GHz) 84.21 ForceWare
- Power Supply – Silverstone ST56F Strider
- Memory – OCZ Platinum EB 2x1GB PC4000 @ 250 MHz (3-2-3-7)
- Hard Disk – 2 WD Raptor 74 GB (Raid 0) / 2 Seagate 160 GB (Raid 1)
- Sound Card – Creative Audigy ZS2
- Case Antec P180 (Silver)
- OS – Windows XP Pro / SP2
- DirectX 9.0c (4.09.0000.0904)
- Monitors Dell 1907fp (center), Dell e196fp (left and right)
While this isnt the most powerful machine on the planet, I am hoping that there is enough under the hood to power 3,932,160 pixels.
Results and Screenshots:
The results were recorded by using FRAPS. They are averaged on an approximately 15 minute run in each game benchmarked. The results are as follows:
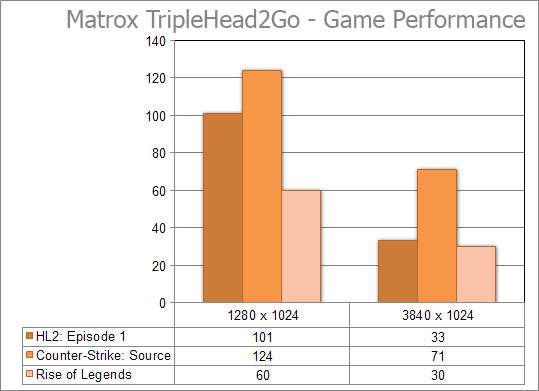
As you can see, the results are somewhat dramatic. There is a significant drop in frames per seconds in each of the three games involved. These tests were taken with all of the eye candy turned on. The Valve games were benched with 4x AA and 16x AF and Rise of Legends was benched using application controlled4x AA and physics turns on. While these frame rates are low, I consider them playable, especially when taking into consideration the sheer size and area that your graphics cards will be asked to render.
You have seen the results, now lets take a look at where these results came from
In each of these sets of pictures, you will see the same picture twice. One version of the picture will be of the game at 1280×1024 and the other will be at 3840×1024.
Cell Factor


Half-Life 2: Episode 1


Counter-Strike: Source


Rise of Nations: Rise of Legends


|
|

Support our efforts! With ad revenue at an all-time low for written websites, we're relying more than ever on reader support to help us continue putting so much effort into this type of content. You can support us by becoming a Patron, or by using our Amazon shopping affiliate links listed through our articles. Thanks for your support!