- Qualcomm Launches Snapdragon 4 Gen 2 Mobile Platform
- AMD Launches Ryzen PRO 7000 Series Mobile & Desktop Platform
- Intel Launches Sleek Single-Slot Arc Pro A60 Workstation Graphics Card
- NVIDIA Announces Latest Ada Lovelace Additions: GeForce RTX 4060 Ti & RTX 4060
- Maxon Redshift With AMD Radeon GPU Rendering Support Now Available
Social & RSS Feeds
Latest Videos


Latest News
Maxwell Hits The Workstation: NVIDIA Quadro M6000 Graphics Card Review
by Rob Williams on July 28, 2015 in Graphics & Displays
What NVIDIA’s GeForce TITAN X does for gaming, its Quadro M6000 does for workstations. As the company’s first Maxwell-based Quadro, the M6000 has a lot going for it: an impressive performance-per-watt rating, support for 4x 4K/60 displays, and despite its 7 TFLOPs performance, requires just a single 8-pin connector.
Page 5 – Sandra: Processing, Cryptography, Scientific, Financial & Bandwidth
On the previous page, I mentioned that SPEC is an organization that crafts some of the best benchmarks going, and in a similar vein, I can compliment SiSoftware. This is a company that thrives on offering support for certain technologies before those technologies are even available to the consumer. In that regard, its Sandra benchmark might seem a little bleeding-edge, but at the same time, its tests are established, refined, and really accurate across multiple runs.
For the purposes of a workstation graphics card review, we focus on four main tests: general GPU processing, cryptography, financial analysis, and scientific analysis. Some of these tests produce complex results, so those will be displayed in a table rather than a graph.

GPU Processing
| Sandra 2015 – GPU Processing | ||||
| M6000 | K5200 | K5000 | TITAN X | |
| CUDA: Single-Float | 9.13 GPix/s | 4.16 GPix/s | 2.57 GPix/s | 9.40 GPix/s |
| OpenCL: Single-Float | 8.10 GPix/s | 3.37 GPix/s | 2 GPix/s | 7.75 GPix/s |
| CUDA: Half-Float | 9.05 GPix/s | 4.13 GPix/s | 2.57 GPix/s | 8.53 GPix/s |
| OpenCL: Half-Float | 8.2 GPix/s | 3.39 GPix/s | 2 GPix/s | 7.53 GPix/s |
| CUDA: Double-Float | 344.16 MPix/s | 272.68 MPix/s | 144 MPix/s | 348.07 MPix/s |
| OpenCL: Double-Float | 347.83 GPix/s | 268.22 MPix/s | 140 MPix/s | 351.54 MPix/s |
| CUDA: Quad-Float | 12.69 MPix/s | 11.54 MPix/s | 6 MPix/s | 12.83 MPix/s |
| OpenCL: Quad-Float | 13.59 MPix/s | 19.62 MPix/s | 5 MPix/s | 13.76 MPix/s |
| Results in pixels-per-second. 1 GPix = 1,000 MPix; 1 MPix = 1,000 kPix. | ||||
For the most part, the performance differences between CUDA and OpenCL processing are minimal, though it is notable that the latter is faster in the quad-float test. This is another test where the M6000 and TITAN X are close to being equals, but that’s not much of a surprise given NVIDIA wouldn’t optimize its drivers for synthetic tests like these. Compared to the previous-generation K5200, though, the performance differences are stark in both the single- and double-float tests.
Cryptography
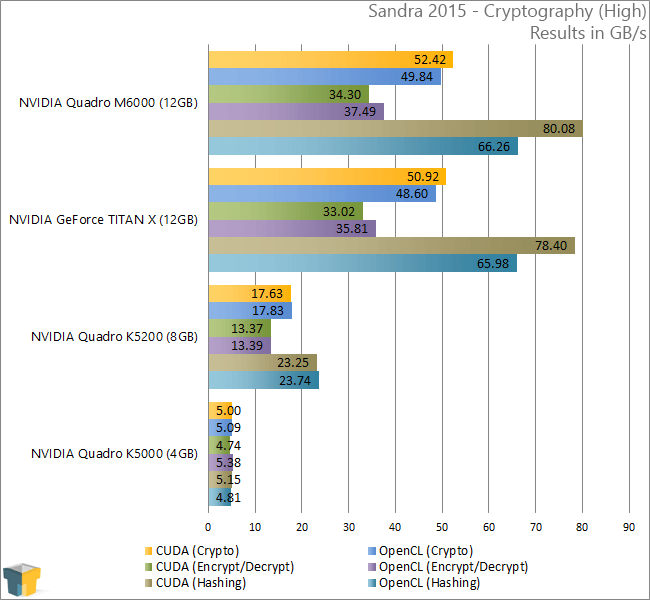
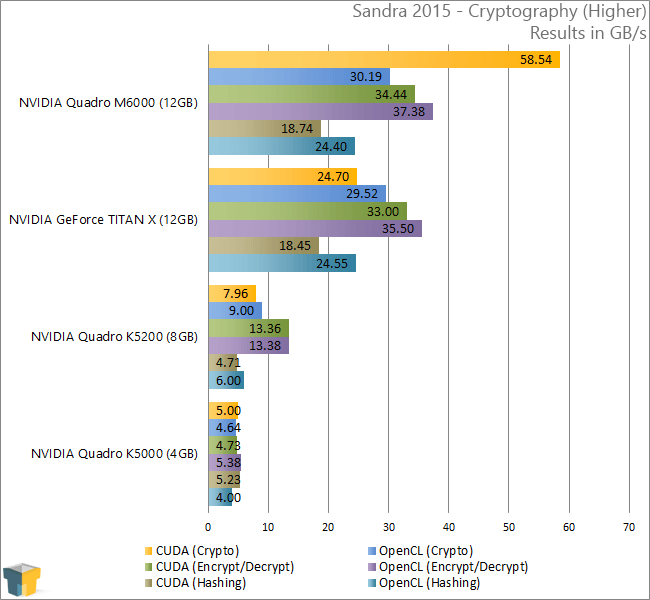
This is another great test for showing the dramatic improvements Maxwell can offer over Kepler. I regret not being able to offer up K6000 results here, but comparing to the K5200, it doesn’t take much to understand that we’ve at least doubled performance from one generation to the next. The results are most impressive in the “Higher” test, which represents AES256 and SHA512 testing (versus AES256 + SHA2-256); the M6000 is 7x faster than the K5200 when using CUDA, and 3x faster when using OpenCL.
Financial Analysis
| Sandra 2015 – Financial Analysis (Single Precision) | ||||
| M6000 | K5200 | K5000 | TITAN X | |
| CUDA: Black-Scholes | 8.14 G/s | 3.44 G/s | 1.47 G/s | 8.14 G/s |
| OpenCL: Black-Scholes | 8.10 G/s | 4.49 G/s | 1.48 G/s | 8.11 G/s |
| CUDA: Binomial | 1.58 M/s | 676.64 k/s | 381.43 k/s | 1.54 M/s |
| OpenCL: Binomial | 1.60 M/s | 645.42 k/s | 379.64 k/s | 1.53 M/s |
| CUDA: Monte Carlo | 3 M/s | 1.20 M/s | 771.30 k/s | 3 M/s |
| OpenCL: Monte Carlo | 2.81 M/s | 1.18 M/s | 689.37 k/s | 2.67 M/s |
| Results in options-per-second. 1 GOPS = 1,000 MOPS; 1 MOPS = 1,000 kOPS. | ||||
| Sandra 2015 – Financial Analysis (Double Precision) | ||||
| M6000 | K5200 | K5000 | TITAN X | |
| CUDA: Black-Scholes | 700 M/s | 541.32 M/s | 286.48 M/s | 705.90 M/s |
| OpenCL: Black-Scholes | 691.82 M/s | 533.91 M/s | 266.76 M/s | 699.64 M/s |
| CUDA: Binomial | 70.32 k/s | 52.55 k/s | 28.75 k/s | 71.14 k/s |
| OpenCL: Binomial | 71.45 k/s | 52.93 k/s | 28.79 k/s | 72.48 k/s |
| CUDA: Monte Carlo | 147.71 k/s | 112.53 k/s | 58.53 k/s | 149.18 k/s |
| OpenCL: Monte Carlo | 147.79 k/s | 112.43 k/s | 58.57 k/s | 149.16 k/s |
| Results in options-per-second. 1 GOPS = 1,000 MOPS; 1 MOPS = 1,000 kOPS. | ||||
It’s here where the results become complex really fast. While some of the performance is measured in the thousands of options-per-second, some is measured in the millions – that’s an obvious problem when trying to sort it all in a graph.
Nonetheless, as with the cryptography test we can see some great performance improvements over the K5200, and also repeating itself is the fact that CUDA and OpenCL performance is quite close.
Scientific Analysis
| Sandra 2015 – Scientific Analysis (Single Precision) | ||||
| M6000 | K5200 | K5000 | TITAN X | |
| CUDA: GEMM | 3.2 TFLOPS | 1.1 TFLOPS | 83.2 GFLOPS | 3.2 TFLOPS |
| OpenCL: GEMM | 3.6 TFLOPS | 1 TFLOPS | 374.1 GFLOPS | 3.4 TFLOPS |
| CUDA: FFT | 204.3 GFLOPS | 80.8 GFLOPS | 71.4 GFLOPS | 205 GFLOPS |
| OpenCL: FFT | 220.7 GFLOPS | 97.0 GFLOPS | 81 GFLOPS | 221.5 GFLOPS |
| CUDA: NBDY | 2.9 TFLOPS | 1 TFLOPS | 718.3 GFLOPS | 2.9 TFLOPS |
| OpenCL: NBDY | 3 TFLOPS | 1 TFLOPS | 622 GFLOPS | 2.9 TFLOPS |
| Results in floating-point operations-per-second. GEMM = General Matrix Multiply; FFT = Fast Fourier Transform; NBDY = N-Body Simulation. | ||||
| Sandra 2015 – Scientific Analysis (Double Precision) | ||||
| M6000 | K5200 | K5000 | TITAN X | |
| CUDA: GEMM | 175.1 GFLOPS | 147.8 GFLOPS | 10.6 GFLOPS | 177.2 GFLOPS |
| OpenCL: GEMM | 174.6 GFLOPS | 148.0 GFLOPS | 28.2 GFLOPS | 176.4 GFLOPS |
| CUDA: FFT | 89.1 GFLOPS | 48.7 GFLOPS | 18.5 GFLOPS | 89.3 GFLOPS |
| OpenCL: FFT | 120.3 GFLOPS | 58.6 GFLOPS | 22.5 GFLOPS | 120.9 GFLOPS |
| CUDA: NBDY | 103.0 GFLOPS | 112.1 GFLOPS | 63.3 GFLOPS | 101.4 GFLOPS |
| OpenCL: NBDY | 103.6 GFLOPS | 111.9 GFLOPS | 63.4 GFLOPS | 105.0 GFLOPS |
| Results in floating-point operations-per-second. GEMM = General Matrix Multiply; FFT = Fast Fourier Transform; NBDY = N-Body Simulation. | ||||
Wrapping up our Sandra testing is a set of results that backs up what we’ve seen with the others so far on this page: the M6000 is on par with the TITAN X overall in non-optimized applications, and in most cases, it’s dramatically faster than the K5200.

Support our efforts! With ad revenue at an all-time low for written websites, we're relying more than ever on reader support to help us continue putting so much effort into this type of content. You can support us by becoming a Patron, or by using our Amazon shopping affiliate links listed through our articles. Thanks for your support!

Rob Williams
Rob founded Techgage in 2005 to be an 'Advocate of the consumer', focusing on fair reviews and keeping people apprised of news in the tech world. Catering to both enthusiasts and businesses alike; from desktop gaming to professional workstations, and all the supporting software.


