- Qualcomm Launches Snapdragon 4 Gen 2 Mobile Platform
- AMD Launches Ryzen PRO 7000 Series Mobile & Desktop Platform
- Intel Launches Sleek Single-Slot Arc Pro A60 Workstation Graphics Card
- NVIDIA Announces Latest Ada Lovelace Additions: GeForce RTX 4060 Ti & RTX 4060
- Maxon Redshift With AMD Radeon GPU Rendering Support Now Available
Social & RSS Feeds
Latest Videos


Latest News
Maxwell Quadro For All: NVIDIA Quadro M2000 Workstation Graphics Card Review
by Rob Williams on May 5, 2016 in Graphics & Displays
To those who’ve been waiting for a mid-range Maxwell Quadro to come along: your wait is over. To help wrap up its Maxwell-based lineup, NVIDIA’s Quadro team has released the ~$500 M2000. This card is largely targeted at CAD users and those with lighter 3D design needs, and promises to be much more efficient – and faster overall – than its predecessor. We gave the card a thorough test to see just how true that is.
Page 5 – Sandra: Processing, Cryptography, Scientific, Financial & Bandwidth
On the previous page, I mentioned that SPEC is an organization that crafts some of the best benchmarks going, and in a similar vein, I can compliment SiSoftware. This is a company that thrives on offering support for certain technologies before those technologies are even available to the consumer. In that regard, its Sandra benchmark might seem a little bleeding-edge, but at the same time, its tests are established, refined, and really accurate across multiple runs.
For the purposes of a workstation graphics card review, we focus on four main tests: general GPU processing, cryptography, financial analysis, and scientific analysis. Some of these tests produce complex results, so those will be displayed in a table rather than a graph.

GPU Processing
| Sandra 2015 – GPU Processing | ||||
| M6000 | K5200 | K5000 | M2000 | |
| CUDA: Single-Float | 9.13 GPix/s | 4.16 GPix/s | 2.57 GPix/s | 2.48 GPix/s |
| OpenCL: Single-Float | 8.10 GPix/s | 3.37 GPix/s | 2 GPix/s | 2.19 GPix/s |
| CUDA: Half-Float | 9.05 GPix/s | 4.13 GPix/s | 2.57 GPix/s | 2.47 GPix/s |
| OpenCL: Half-Float | 8.2 GPix/s | 3.39 GPix/s | 2 GPix/s | 2.19 GPix/s |
| CUDA: Double-Float | 344.16 MPix/s | 272.68 MPix/s | 144 MPix/s | 92.89 MPix/s |
| OpenCL: Double-Float | 347.83 GPix/s | 268.22 MPix/s | 140 MPix/s | 185.1 MPix/s |
| CUDA: Quad-Float | 12.69 MPix/s | 11.54 MPix/s | 6 MPix/s | 4 MPix/s |
| OpenCL: Quad-Float | 13.59 MPix/s | 19.62 MPix/s | 5 MPix/s | 8.37 MPix/s |
| Results in pixels-per-second. 1 GPix = 1,000 MPix; 1 MPix = 1,000 kPix. | ||||
For both the single- and double-precision tests, the M2000 and K5000 are effective equals, at least where CUDA is concerned. With OpenCL, the M2000 is much faster overall, especially with the double- and quad-precision tests.
Cryptography
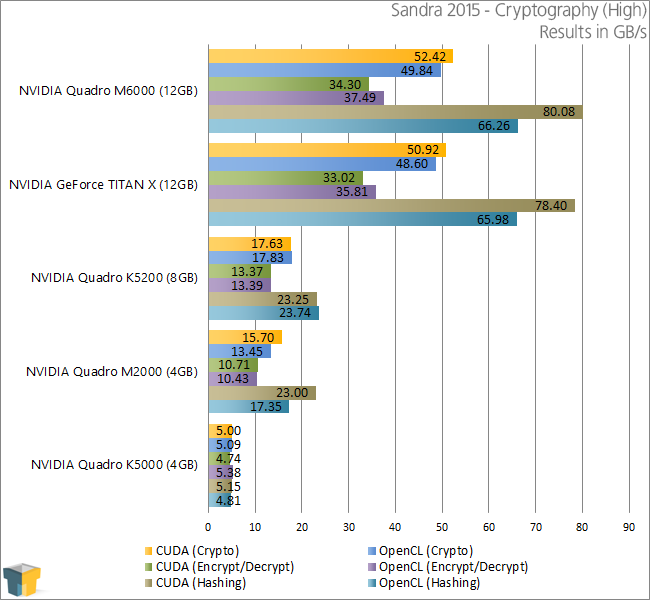
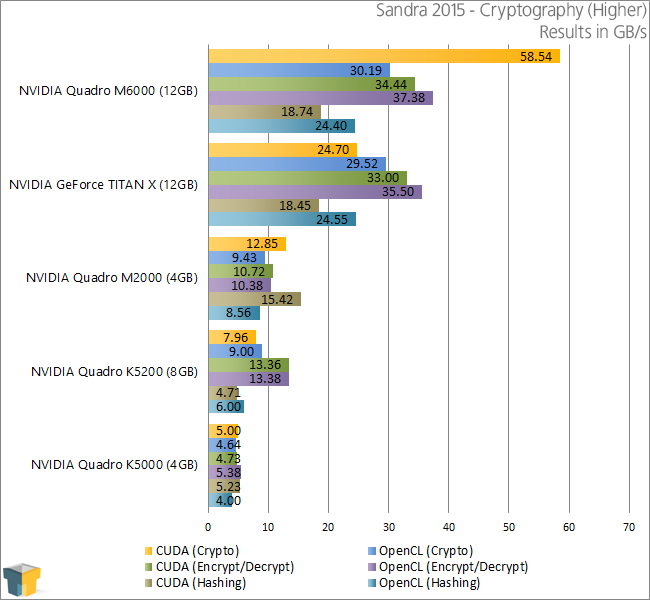
It’s clear from these results that NVIDIA has made great strides with the cryptography performance on its Maxwell-based Quadros. The M2000 makes a complete mockery of the K5000 here – a card that has more often than not outperformed the M2000 in our other tests.
Financial Analysis
| Sandra 2015 – Financial Analysis (Single Precision) | ||||
| M6000 | K5200 | K5000 | M2000 | |
| CUDA: Black-Scholes | 8.14 G/s | 3.44 G/s | 1.47 G/s | 2.12 G/s |
| OpenCL: Black-Scholes | 8.10 G/s | 4.49 G/s | 1.48 G/s | 1.58 G/s |
| CUDA: Binomial | 1.58 M/s | 676.64 k/s | 381.43 k/s | 445.48 k/s |
| OpenCL: Binomial | 1.60 M/s | 645.42 k/s | 379.64 k/s | 375.33 k/s |
| CUDA: Monte Carlo | 3 M/s | 1.20 M/s | 771.30 k/s | 883.6 k/s |
| OpenCL: Monte Carlo | 2.81 M/s | 1.18 M/s | 689.37 k/s | 756.45 k/s |
| Results in options-per-second. 1 GOPS = 1,000 MOPS; 1 MOPS = 1,000 kOPS. | ||||
| Sandra 2015 – Financial Analysis (Double Precision) | ||||
| M6000 | K5200 | K5000 | M2000 | |
| CUDA: Black-Scholes | 700 M/s | 541.32 M/s | 286.48 M/s | 193.91 M/s |
| OpenCL: Black-Scholes | 691.82 M/s | 533.91 M/s | 266.76 M/s | 235.91 M/s |
| CUDA: Binomial | 70.32 k/s | 52.55 k/s | 28.75 k/s | 19 k/s |
| OpenCL: Binomial | 71.45 k/s | 52.93 k/s | 28.79 k/s | 15.79 k/s |
| CUDA: Monte Carlo | 147.71 k/s | 112.53 k/s | 58.53 k/s | 40 k/s |
| OpenCL: Monte Carlo | 147.79 k/s | 112.43 k/s | 58.57 k/s | 35.86 k/s |
| Results in options-per-second. 1 GOPS = 1,000 MOPS; 1 MOPS = 1,000 kOPS. | ||||
The results are quite cut-and-dried here. The Maxwell-based M2000 dominates the single-precision test, versus the K5000, but it falls short in the double-precision test. Maxwell was released with notably decreased DP performance versus the previous generation Kepler cards, so a result like this isn’t surprising.
Scientific Analysis
| Sandra 2015 – Scientific Analysis (Single Precision) | ||||
| M6000 | K5200 | K5000 | M2000 | |
| CUDA: GEMM | 3.2 TFLOPS | 1.1 TFLOPS | 83.2 GFLOPS | 951.73 GFLOPS |
| OpenCL: GEMM | 3.6 TFLOPS | 1 TFLOPS | 374.1 GFLOPS | 983.37 GFLOPS |
| CUDA: FFT | 204.3 GFLOPS | 80.8 GFLOPS | 71.4 GFLOPS | 54.77 GFLOPS |
| OpenCL: FFT | 220.7 GFLOPS | 97.0 GFLOPS | 81 GFLOPS | 65.24 GFLOPS |
| CUDA: NBDY | 2.9 TFLOPS | 1 TFLOPS | 718.3 GFLOPS | 915.53 GFLOPS |
| OpenCL: NBDY | 3 TFLOPS | 1 TFLOPS | 622 GFLOPS | 601.82 GFLOPS |
| Results in floating-point operations-per-second. GEMM = General Matrix Multiply; FFT = Fast Fourier Transform; NBDY = N-Body Simulation. | ||||
| Sandra 2015 – Scientific Analysis (Double Precision) | ||||
| M6000 | K5200 | K5000 | M2000 | |
| CUDA: GEMM | 175.1 GFLOPS | 147.8 GFLOPS | 10.6 GFLOPS | 48.11 GFLOPS |
| OpenCL: GEMM | 174.6 GFLOPS | 148.0 GFLOPS | 28.2 GFLOPS | 49.64 GFLOPS |
| CUDA: FFT | 89.1 GFLOPS | 48.7 GFLOPS | 18.5 GFLOPS | 28 GFLOPS |
| OpenCL: FFT | 120.3 GFLOPS | 58.6 GFLOPS | 22.5 GFLOPS | 36.16 GFLOPS |
| CUDA: NBDY | 103.0 GFLOPS | 112.1 GFLOPS | 63.3 GFLOPS | 38.17 GFLOPS |
| OpenCL: NBDY | 103.6 GFLOPS | 111.9 GFLOPS | 63.4 GFLOPS | 51.18 GFLOPS |
| Results in floating-point operations-per-second. GEMM = General Matrix Multiply; FFT = Fast Fourier Transform; NBDY = N-Body Simulation. | ||||
It looks like we couldn’t finish off our regular performance results without another doozy. Here, the M2000 dramatically outperforms the K5000 in most single-precision and double-precision tests. The newer and higher-end Kepler-based K5200 delivers its own impressive results, although the M6000 chimes in to remind us all that it’s the big dog in NVIDIA’s current Quadro line-up (well, aside from the 24GB variant released last month.)

Support our efforts! With ad revenue at an all-time low for written websites, we're relying more than ever on reader support to help us continue putting so much effort into this type of content. You can support us by becoming a Patron, or by using our Amazon shopping affiliate links listed through our articles. Thanks for your support!

Rob Williams
Rob founded Techgage in 2005 to be an 'Advocate of the consumer', focusing on fair reviews and keeping people apprised of news in the tech world. Catering to both enthusiasts and businesses alike; from desktop gaming to professional workstations, and all the supporting software.


