- Qualcomm Launches Snapdragon 4 Gen 2 Mobile Platform
- AMD Launches Ryzen PRO 7000 Series Mobile & Desktop Platform
- Intel Launches Sleek Single-Slot Arc Pro A60 Workstation Graphics Card
- NVIDIA Announces Latest Ada Lovelace Additions: GeForce RTX 4060 Ti & RTX 4060
- Maxon Redshift With AMD Radeon GPU Rendering Support Now Available
Social & RSS Feeds
Latest Videos


Latest News
Radeon Pro vs. Quadro: A Fresh Look At Workstation GPU Performance
by Rob Williams on April 30, 2018 in Graphics & Displays
There hasn’t been a great deal of movement on the ProViz side of the graphics card market in recent months, so now seems like a great time to get up to speed on the current performance outlook. Equipped with 12 GPUs, one multi-GPU config, current drivers, and a gauntlet of tests, let’s find out which cards deserve your attention.
Page 3 – Encode & Render: Adobe Premiere Pro, Cinebench, LuxMark, OctaneBench, V-Ray Benchmark
Adobe Premiere Pro CC 2018
To test the accelerated encoding perks of different GPUs, Adobe’s Premiere Pro 2018 is used. For production, the best use of GPUs is to render the countless number of filters, or accelerate the scaling down to lower resolutions. Encoding one 1080p video to another might not exhibit much of a speed-up (if one at all) on the GPU, but 4K to 1080p could benefit.
Three projects are used for testing here. The Music Video one came straight from NVIDIA, so it’s clearly optimized for CUDA, but encodes fine on OpenCL. The 4K (~300Mbps) and 8K (~1.1Gbps) RED files are processed as straight-forward reencodes to lower resolutions.

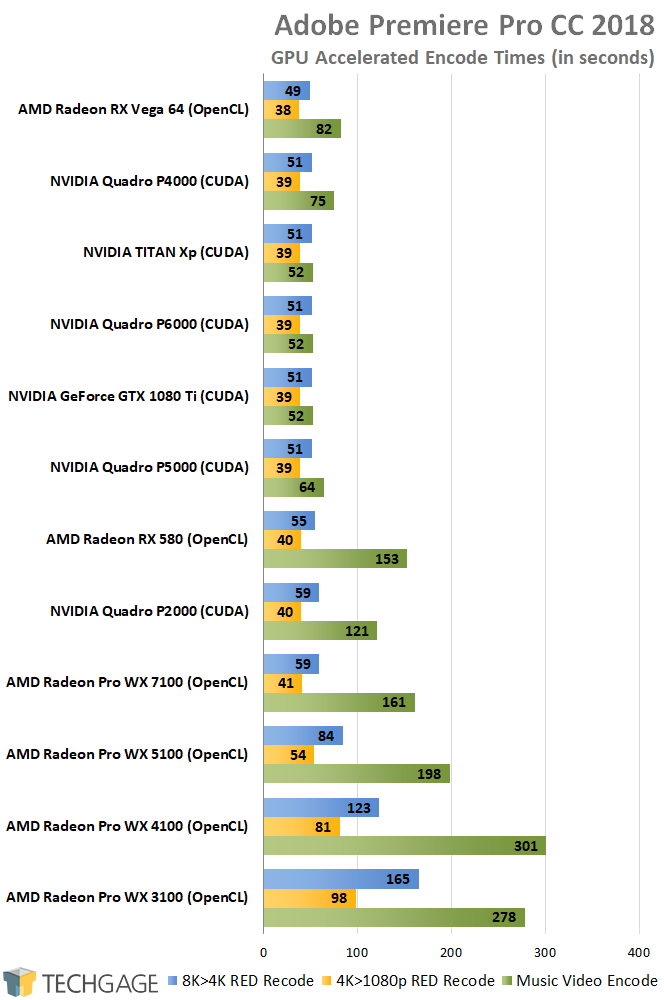
Dropping the requirement for rendering effects, AMD claws its way to the very top, beating out NVIDIA’s entire stack, by a single second (and yes, it’s repeatedly 1 second quicker in both tests). 1 second difference is obviously pretty minor in the grand scheme, even when you take a full-length project into account, but for both 4K and 8K, you’ll definitely want to go higher than the WX 5100 series.
Synthetic Renders
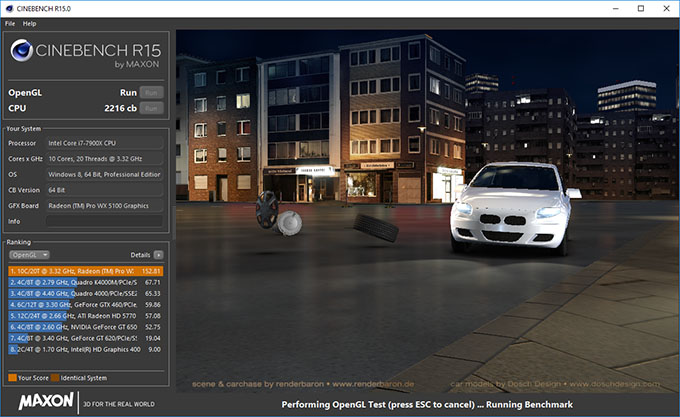


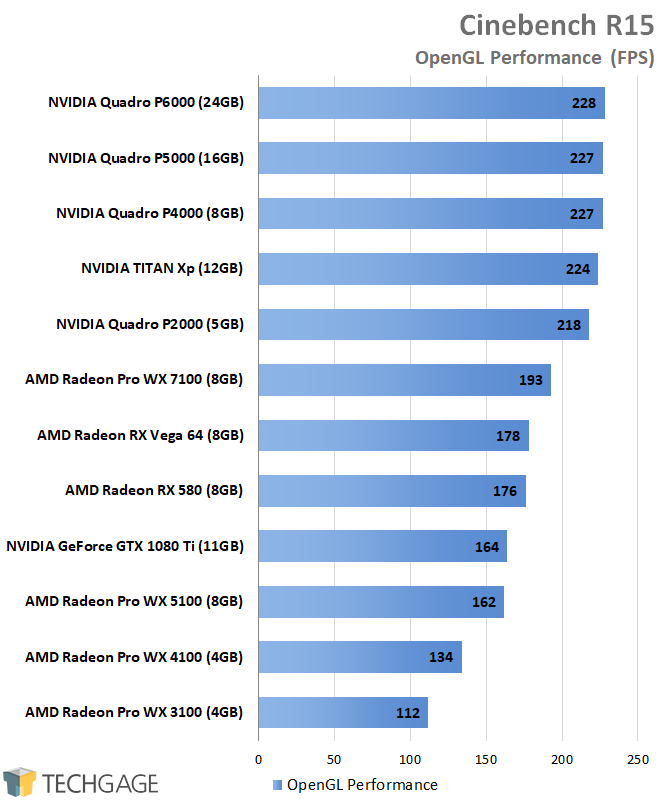
AMD might kick Intel’s ass on the CPU side of Cinebench, but it falls short against NVIDIA on the GPU side. But, so does NVIDIA’s own GeForce lineup, which falls quite a bit behind the Quadro cards, and surprisingly, behind AMD’s WX 7100, RX 580, and Vega 64. For the ultimate performance, NVIDIA has the definite lead here; even the P2000 beats out AMD’s top offerings.
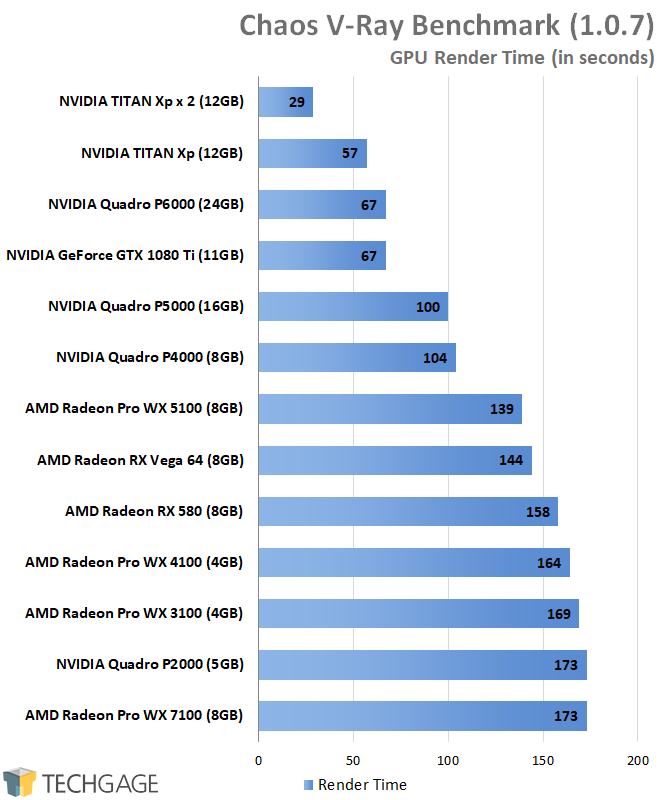
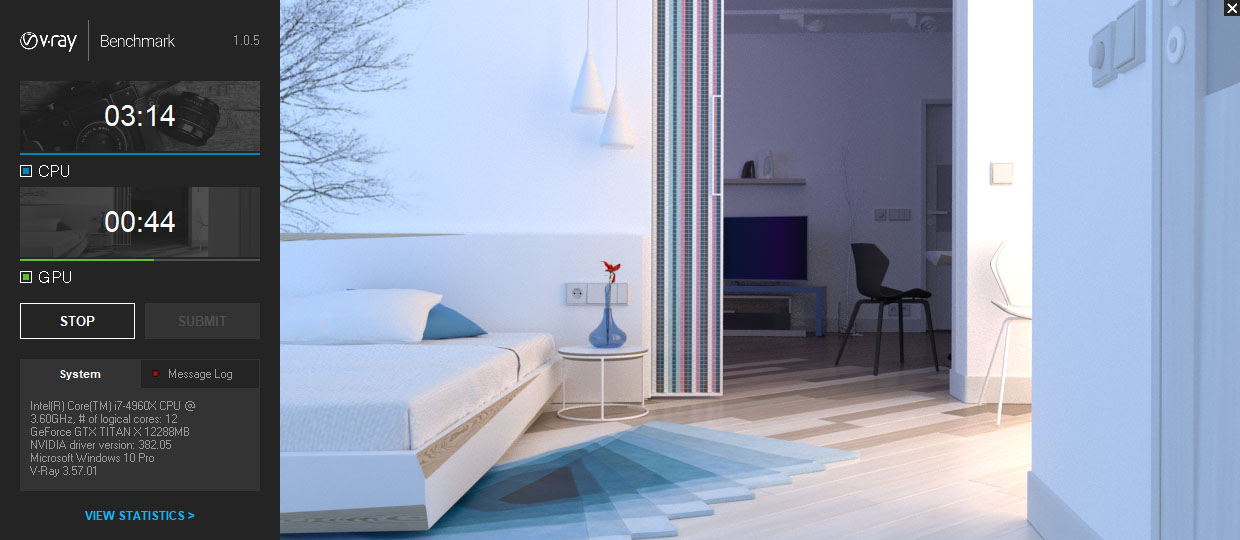
This V-Ray benchmark is different from the real-world scene render on the previous page. This test is completely free to download, and uses CUDA for NVIDIA, and OpenCL for AMD. I do admittedly question the accuracy of the latter, and the results above can highlight why.
An obvious discrepancy here is that the WX 7100 falls behind every single other lower-tier WX card. What’s more, I often get very different results from run-to-run on Radeon cards in general, whereas I don’t on NVIDIA. For example, one run on a single card might be 4 minutes, whereas the second run will be 3 minutes (or vice-versa; I’ve had it start low and go higher on the second run).
On AMD, take these results with a grain of salt. On all of the AMD cards, I ran the test as many times as it took to get a scalable result, but with the WX 7100, no amount of runs would change that result. It’s not the first time I’ve run into issues with V-Ray bench’s results, and it’s unfortunate that fresh issues have seemingly replaced the old ones. If you happen to run AMD, and don’t have this same issue (especially with the WX 7100 in particular), please leave a comment.
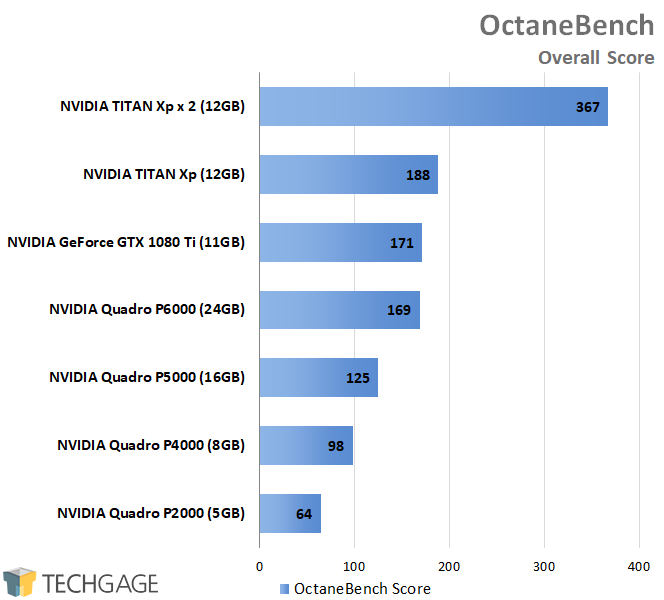
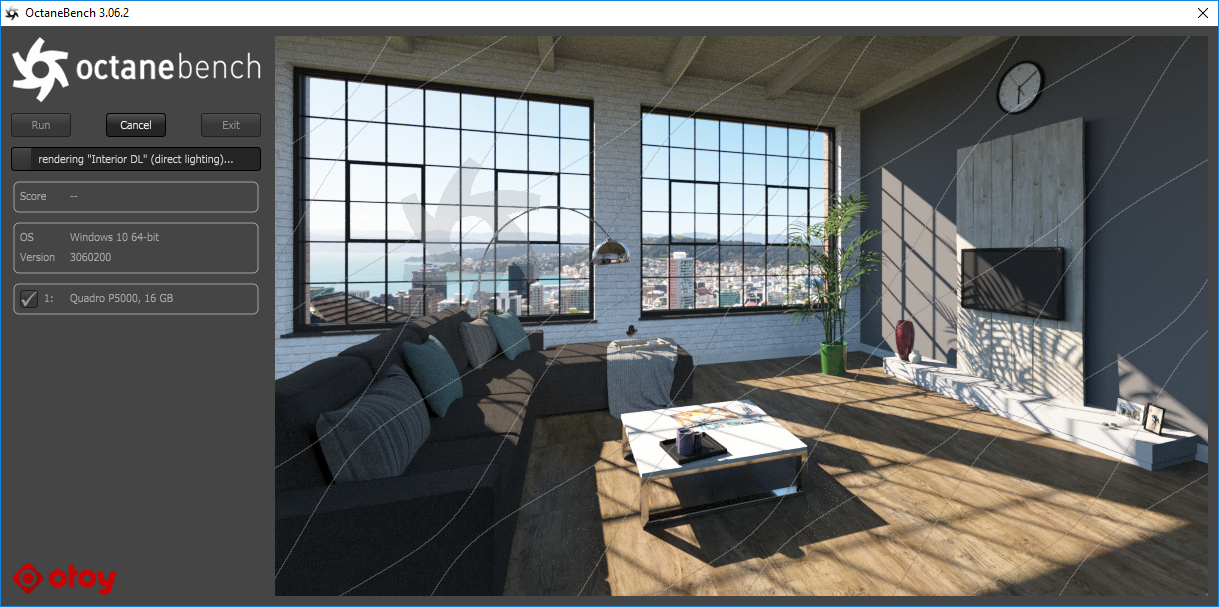
OctaneBench is a CUDA-only benchmark, hence the complete lack of Team Red. These results pretty much scale as one would expect, especially since Quadro has no apparent advantage here; the faster the hardware, the better the performance. Especially if you pile on additional GPUs.
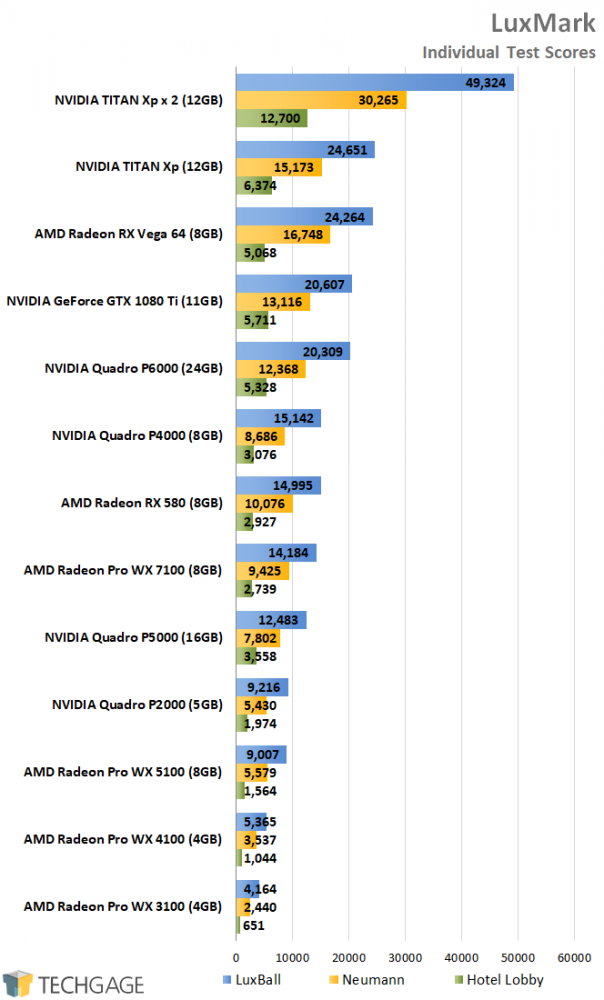
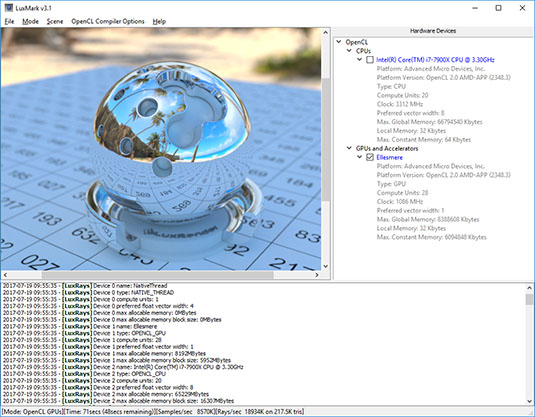
With LuxMark, we once again see AMD’s strong OpenCL performance delivering great results, sliding the RX Vega 64 right in behind NVIDIA’s TITAN Xp. Oddly, the Quadro P5000 runs worse than the P4000 in two of the renders, which is something I can’t explain. I encountered the same results last summer, so whatever causes the difference isn’t something as simple as a driver issue.

Support our efforts! With ad revenue at an all-time low for written websites, we're relying more than ever on reader support to help us continue putting so much effort into this type of content. You can support us by becoming a Patron, or by using our Amazon shopping affiliate links listed through our articles. Thanks for your support!

Rob Williams
Rob founded Techgage in 2005 to be an 'Advocate of the consumer', focusing on fair reviews and keeping people apprised of news in the tech world. Catering to both enthusiasts and businesses alike; from desktop gaming to professional workstations, and all the supporting software.


