- Qualcomm Launches Snapdragon 4 Gen 2 Mobile Platform
- AMD Launches Ryzen PRO 7000 Series Mobile & Desktop Platform
- Intel Launches Sleek Single-Slot Arc Pro A60 Workstation Graphics Card
- NVIDIA Announces Latest Ada Lovelace Additions: GeForce RTX 4060 Ti & RTX 4060
- Maxon Redshift With AMD Radeon GPU Rendering Support Now Available
Social & RSS Feeds
Latest Videos


Latest News
Radeon Pro vs. Quadro: A Fresh Look At Workstation GPU Performance
by Rob Williams on April 30, 2018 in Graphics & Displays
There hasn’t been a great deal of movement on the ProViz side of the graphics card market in recent months, so now seems like a great time to get up to speed on the current performance outlook. Equipped with 12 GPUs, one multi-GPU config, current drivers, and a gauntlet of tests, let’s find out which cards deserve your attention.
Page 5 – SiSoftware Sandra: Cryptography, Financial & Scientific Analysis
On the previous page, I mentioned that SPEC is an organization that crafts some of the best, most comprehensive benchmarks going, and in a similar vein, I can compliment SiSoftware. This is a company that thrives on offering support for certain technologies before those technologies are even available to the consumer. In that regard, its Sandra benchmark might seem a little bleeding-edge, but at the same time, its tests are established, refined, and accurate across multiple runs.
While Sandra offers a huge number of benchmarks, just three of the GPU ones are focused on: Cryptography, Financial Analysis, and Scientific Analysis. Some of the results are a bit too complex for a graph, so a handful of tables are coming your way.

Cryptography
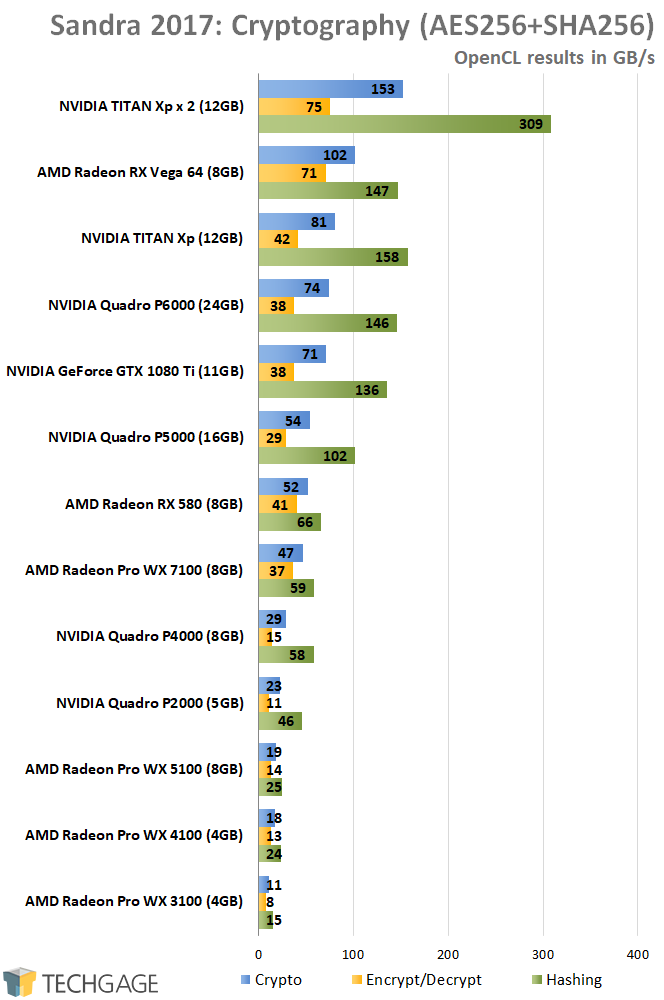
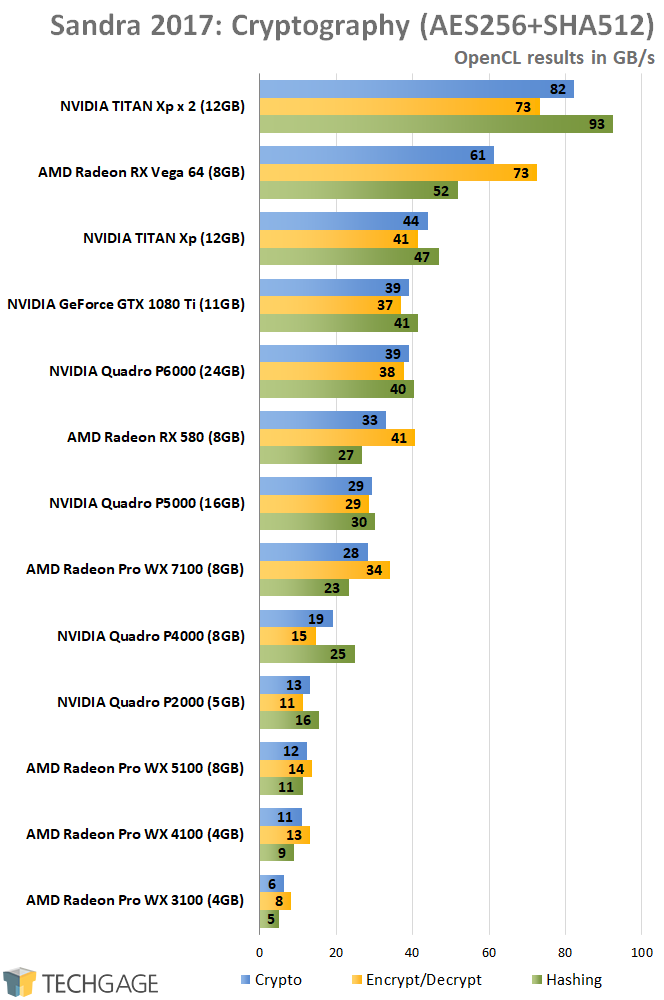
It’s hard to talk about these results without first drawing attention to the top: Vega 64 manages to match SLI’d TITAN Xps (which actually scale properly) in both the encrypt/decrypt process, improves-upon the crypto test against the TITAN Xp, and comes close to the same GPU for the hashing test. Where crypto and hashing are concerned, nothing can touch the dual-GPU test, but this will come as a surprise to no GPU miner.
For cryptography, AMD easily wins here. The company must care an awful lot about crypto, because we’ve seen similar gains on the Ryzen side of things as well. For a fun comparison, look at the WX 3100 versus the Vega 64. The difference is close to being 1:10, but of course, they target very different customer bases. Even so, there’s a lot of value to be had from Vega.
Financial Analysis
| Sandra 2017 – Financial Analysis (FP32) | |||
| Black-Scholes | Binomial | Monte Carlo | |
| NVIDIA TITAN Xp x 2 | 26 G/s | 4.4 M/s | 11.1 M/s |
| NVIDIA TITAN Xp | 14 G/s | 2.3 M/s | 5.7 M/s |
| NVIDIA GeForce GTX 1080 Ti | 11.6 G/s | 2.1 M/s | 5.38 M/s |
| NVIDIA Quadro P6000 | 11.6 G/s | 2.2 M/s | 5.9 M/s |
| AMD Radeon RX Vega 64 | 9.3 G/s | 2.7 M/s | 4.2 M/s |
| NVIDIA Quadro P5000 | 7.8 G/s | 1.7 M/s | 4.2 M/s |
| NVIDIA Quadro P4000 | 6.6 G/s | 845.6 k/s | 2.2 M/s |
| AMD Radeon RX 580 | 5.8 G/s | 1.5 M/s | 2.3 M/s |
| AMD Radeon Pro WX 7100 | 5.3 G/s | 1.3 M/s | 1.9 M/s |
| NVIDIA Quadro P2000 | 3.8 G/s | 653.7 k/s | 1.6 M/s |
| AMD Radeon Pro WX 5100 | 3.7 G/s | 530.3 k/s | 736.2 k/s |
| AMD Radeon Pro WX 4100 | 2.2 G/s | 497.8 k/s | 728 k/s |
| AMD Radeon Pro WX 3100 | 2.5 G/s | 320.6 k/s | 467.4 k/s |
| Results in options-per-second. 1 GOPS = 1,000 MOPS; 1 MOPS = 1,000 kOPS. | |||
| Sandra 2017 – Financial Analysis (FP64) | |||
| Black-Scholes | Binomial | Monte Carlo | |
| NVIDIA TITAN Xp x 2 | 2.7 G/s | 274 k/s | 554 k/s |
| AMD Radeon RX Vega 64 | 2.1 G/s | 181 k/s | 515.1 k/s |
| NVIDIA TITAN Xp | 1.5 G/s | 143.4 k/s | 297.2 k/s |
| NVIDIA GeForce GTX 1080 Ti | 1.4 G/s | 135.4 k/s | 265.8 k/s |
| NVIDIA Quadro P6000 | 1.3 G/s | 131.3 k/s | 271.3 k/s |
| AMD Radeon RX 580 | 1.1 G/s | 90.1 k/s | 280.4 k/s |
| NVIDIA Quadro P5000 | 908.7 M/s | 91.7 k/s | 188.4 k/s |
| AMD Radeon Pro WX 7100 | 962.6 M/s | 81.27 k/s | 239.2 k/s |
| NVIDIA Quadro P4000 | 565.9 M/s | 55.5 k/s | 110.7 k/s |
| AMD Radeon Pro WX 5100 | 456.2 M/s | 52.7 k/s | 108.8 k/s |
| AMD Radeon Pro WX 4100 | 384 M/s | 34 k/s | 95.2 k/s |
| NVIDIA Quadro P2000 | 359.6 M/s | 36 k/s | 74.8 k/s |
| AMD Radeon Pro WX 3100 | 219.1 M/s | 17.9 k/s | 54.8 k/s |
| Results in options-per-second. 1 GOPS = 1,000 MOPS; 1 MOPS = 1,000 kOPS. | |||
Not a single one of the GPUs featured here supports proper double-precision performance (like a Radeon Instinct, NVIDIA Tesla, or Quadro GP100/GV100 would provide), so all of the performance on that side of the fence is kind of pointless, because no one revolves their work around FP64 and opts for capped hardware. That said, when we compare the Vega 64 to 1080 Ti, there are some clear advantages from the red team.
For the most part, raw performance pretty much dictates the ranking here, so NVIDIA’s TITAN Xp keeps glued to the top for the single-precision tests. The rest of the cards slot in pretty much where we’d expect. Neither vendor seems to have exclusive optimizations for these computations, but overall, Vega 64 once again brings some great performance for its (SRP) price point.
Scientific Analysis
| Sandra 2017 – Scientific Analysis (FP32) | |||
| GEMM | FFT | N-Body | |
| NVIDIA TITAN Xp x 2 | 13 TFLOPS | 503.2 GFLOPS | 10.2 TFLOPS |
| NVIDIA TITAN Xp | 6.8 TFLOPS | 257.5 GFLOPS | 5.2 TFLOPS |
| NVIDIA Quadro P6000 | 6.6 TFLOPS | 157.2 GFLOPS | 5.08 TFLOPS |
| NVIDIA GeForce GTX 1080 Ti | 6 TFLOPS | 216.3 GFLOPS | 5 TFLOPS |
| AMD Radeon RX Vega 64 | 6 TFLOPS | 326.9 GFLOPS | 4.8 TFLOPS |
| NVIDIA Quadro P5000 | 4.6 TFLOPS | 106.7 GFLOPS | 3.5 TFLOPS |
| NVIDIA Quadro P4000 | 3.1 TFLOPS | 128.8 GFLOPS | 1.8 TFLOPS |
| AMD Radeon RX 580 | 3.5 TFLOPS | 227.6 GFLOPS | 3.2 TFLOPS |
| AMD Radeon Pro WX 7100 | 2.8 TFLOPS | 205 GFLOPS | 2.2 TFLOPS |
| NVIDIA Quadro P2000 | 1.9 TFLOPS | 86 GFLOPS | 1.6 TFLOPS |
| AMD Radeon Pro WX 5100 | 1.1 TFLOPS | 143.2 GFLOPS | 860.8 GFLOPS |
| AMD Radeon Pro WX 4100 | 1.1 TFLOPS | 83 GFLOPS | 875.3 GFLOPS |
| AMD Radeon Pro WX 3100 | 750.6 GFLOPS | 69.5 GFLOPS | 646.4 GFLOPS |
| GEMM = General Matrix Multiply; FFT = Fast Fourier Transform; N-Body = N-Body Simulation. | |||
| Sandra 2017 – Scientific Analysis (FP64) | |||
| GEMM | FFT | N-Body | |
| NVIDIA TITAN Xp x 2 | 661.8 GFLOPS | 365.5 GFLOPS | 482.4 GFLOPS |
| AMD Radeon RX Vega 64 | 608.6 GFLOPS | 154.8 GFLOPS | 460.3 GFLOPS |
| NVIDIA TITAN Xp | 357.2 GFLOPS | 198.2 GFLOPS | 279.3 GFLOPS |
| AMD Radeon RX 580 | 342.3 GFLOPS | 88.7 GFLOPS | 223.9 GFLOPS |
| NVIDIA GeForce GTX 1080 Ti | 336.8 GFLOPS | 166.5 GFLOPS | 266.4 GFLOPS |
| NVIDIA Quadro P6000 | 322.7 GFLOPS | 133.4 GFLOPS | 252.6 GFLOPS |
| AMD Radeon Pro WX 7100 | 299.6 GFLOPS | 81.7 GFLOPS | 201.6 GFLOPS |
| NVIDIA Quadro P5000 | 225.5 GFLOPS | 84.8 GFLOPS | 180.8 GFLOPS |
| AMD Radeon Pro WX 5100 | 148.7 GFLOPS | 58.9 GFLOPS | 114.9 GFLOPS |
| NVIDIA Quadro P4000 | 133.7 GFLOPS | 87 GFLOPS | 113.9 GFLOPS |
| AMD Radeon Pro WX 4100 | 113.6 GFLOPS | 33.2 GFLOPS | 84.6 GFLOPS |
| NVIDIA Quadro P2000 | 89.1 GFLOPS | 54.3 GFLOPS | 83.7 GFLOPS |
| AMD Radeon Pro WX 3100 | 66.4 GFLOPS | 33.4 GFLOPS | 50.1 GFLOPS |
| GEMM = General Matrix Multiply; FFT = Fast Fourier Transform; N-Body = N-Body Simulation. | |||
Once again, the Vega 64 proved one of the mightiest options for the double-precision test, and it battles nicely with the (technically) faster GTX 1080 Ti. For single-precision, a single TITAN Xp proves best, but the more, the merrier: the scaling seen is fantastic.

Support our efforts! With ad revenue at an all-time low for written websites, we're relying more than ever on reader support to help us continue putting so much effort into this type of content. You can support us by becoming a Patron, or by using our Amazon shopping affiliate links listed through our articles. Thanks for your support!

Rob Williams
Rob founded Techgage in 2005 to be an 'Advocate of the consumer', focusing on fair reviews and keeping people apprised of news in the tech world. Catering to both enthusiasts and businesses alike; from desktop gaming to professional workstations, and all the supporting software.


