- Qualcomm Launches Snapdragon 4 Gen 2 Mobile Platform
- AMD Launches Ryzen PRO 7000 Series Mobile & Desktop Platform
- Intel Launches Sleek Single-Slot Arc Pro A60 Workstation Graphics Card
- NVIDIA Announces Latest Ada Lovelace Additions: GeForce RTX 4060 Ti & RTX 4060
- Maxon Redshift With AMD Radeon GPU Rendering Support Now Available
Social & RSS Feeds
Latest Videos


Latest News
AMD Radeon ProRender: GPU, Multi-GPU & CPU+GPU Rendering Performance

by Rob Williams on October 27, 2018 in Graphics & Displays
It’s been some time since we’ve dug deep into the performance of AMD’s Radeon ProRender, so with the latest version now supporting heterogeneous rendering, the time is right to get to business. Included within is performance of 15 GPU configurations, including multi-GPU, as well as CPU+GPU.
Things might be quiet on the gaming side of Radeon lately, but that’s hardly the case with the workstation side. There, the team seems to be hellbent on not only making sure the company’s Radeon Pros and ProRender solutions are as good as they can be, they also want people to know they exist to begin with, and know what they can do.
I give AMD props for its efforts here. I follow a few Radeon Pro folk on Twitter, and am regularly treated to some stellar examples of what can be done with ProRender. I don’t even need to seek this stuff out – it’s right there for the taking, because the people behind the technologies are so proud of what’s being done.
When I was at SIGGRAPH in August, I made it a point to ask every designer I came into contact with if they had ever used ProRender, and unfortunately, the amount of people who told me that they’ve never even heard of it was almost disappointing. Clearly, ProRender has become quite refined over the short amount of time it’s existed, and it’s well worth using, but this is a super-hard market to crack. With constant development, and an open-source nature, I do see things improving a lot as time goes on.

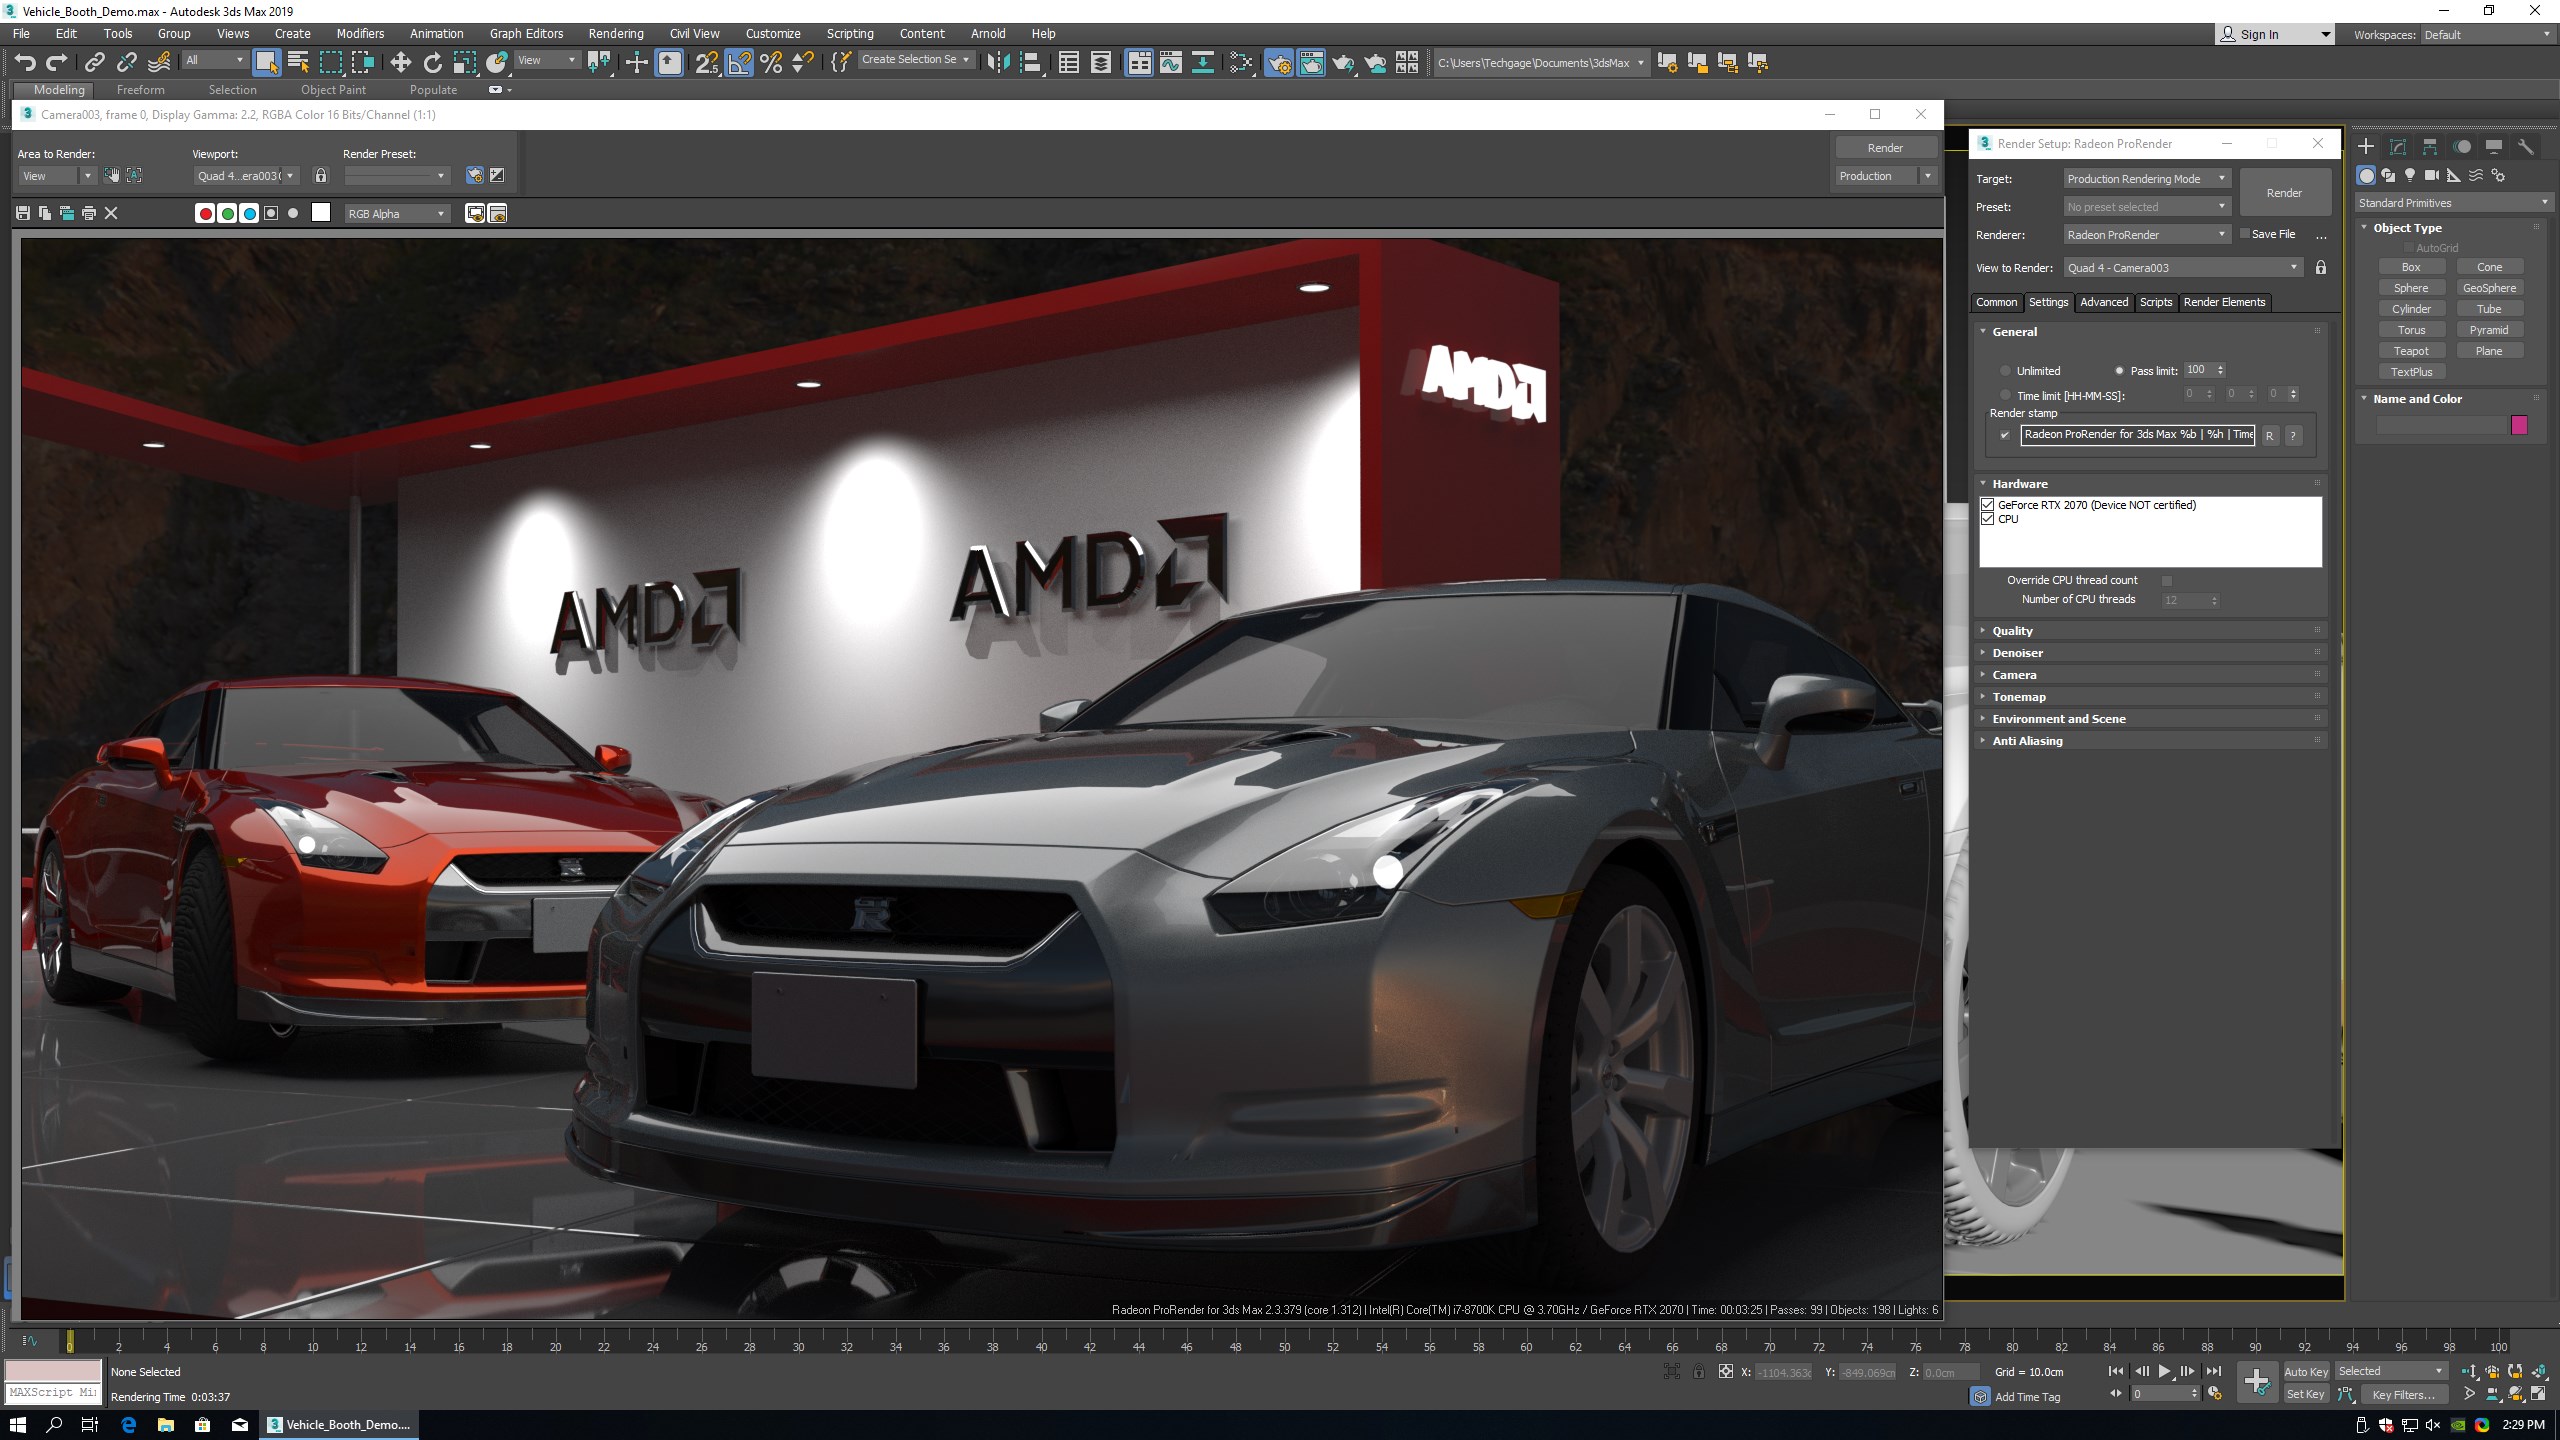
AMD Radeon ProRender in Autodesk 3ds Max
That said, I took an in-depth look at what ProRender could do in 3ds Max back in April. Not even one full month later, the company released a new version of the plugin that delivered notable performance boosts. Not long after that, yet another feature-packed version came out – this one supporting heterogeneous rendering (CPU+GPU). Having tested heterogeneous (what a fun word!) rendering in Chaos Group’s V-Ray, I can say that the gains can sometimes be (legitimately) jaw-dropping. As long as a beefy CPU is the complement to the GPU, at least. And assuming the renderer does its job well.
For this performance look, I’m going to be testing with five Radeon Pro and four Quadro cards for the workstation side, and for the gaming side, AMD has two present, while NVIDIA has three – the third being the brand-new Turing-based RTX 2080 Ti. The goal here isn’t to include only the proper workstation cards, but also the top gaming card available from each vendor to see how things fare on those. With NVIDIA, the TITAN Xp is used in addition to the 1080 Ti because it has additional workstation optimizations not found elsewhere in the GeForce stack.
Here’s an overall view of both company’s current graphics lineups (tested GPUs italicized):
| AMD’s Radeon Pro Workstation GPU Lineup | |||||||
| Cores | Base MHz | Peak FP32 | Memory | Bandwidth | TDP | Price | |
| SSG | 4096 | 1440 | 12.3 TFLOPS | 16 GB 8 | 484 GB/s | 260W | $6999 |
| WX 9100 | 4096 | 1200 | 12.3 TFLOPS | 16 GB 8 | 484 GB/s | 230W | $1399 |
| WX 8200 | 3584 | 1200 | 10.8 TFLOPS | 8 GB 8 | 512 GB/s | 230W | $999 |
| Frontier | 4096 | 1382 | 13.1 TFLOPS | 16 GB 4 | 484 GB/s | 300W | $499 |
| Pro Duo | 2304 x2 | 1243 | 5.7 TFLOPS | 32 GB 3 | 448 GB/s | 250W | $449 |
| WX 7100 | 2304 | 1188 | 5.73 TFLOPS | 8 GB 3 | 224 GB/s | 130W | $549 |
| WX 5100 | 1792 | 713 | 3.89 TFLOPS | 8 GB 3 | 160 GB/s | 75W | $359 |
| WX 4100 | 1024 | 1125 | 2.46 TFLOPS | 4 GB 3 | 96 GB/s | 50W | $259 |
| WX 3100 | 512 | 925 | 1.25 TFLOPS | 4 GB 3 | 96 GB/s | 50W | $169 |
| WX 2100 | 512 | 925 | 1.25 TFLOPS | 2 GB 3 | 56 GB/s | 50W | $129 |
| Notes | 1 GDDR6; 2 GDDR5X; 3 GDDR5; 4 HBM2 5 GDDR6 (ECC); 6 GDDR5X (ECC); 7 GDDR5 (ECC); 8 HBM2 (ECC) Architecture: WX 2100~7100 = Polaris; WX 8200, 9100 & SSG = Vega |
||||||
| AMD’s Radeon Gaming GPU Lineup | |||||||
| Cores | Base MHz | Peak FP32 | Memory | Bandwidth | TDP | Price | |
| Vega 64 | 4096 | 1247 | 10.2 TFLOPS | 8 GB 4 | 484 GB/s | 295W | $499 |
| Vega 56 | 3584 | 1156 | 8.28 TFLOPS | 8 GB 4 | 410 GB/s | 210W | $449 |
| RX 580 | 2304 | 1257 | 5.79 TFLOPS | 8 GB 3 | 256 GB/s | 185W | $229 |
| RX 570 | 2048 | 1168 | 4.78 TFLOPS | 8 GB 3 | 224 GB/s | 150W | $179 |
| RX 560 | 896 | 1175 | 1.95 TFLOPS | 4 GB 3 | 112 GB/s | 80W | $119 |
| RX 550 | 640 | 1100 | 1.13 TFLOPS | 2 GB 3 | 112 GB/s | 50W | $99 |
| Notes | 1 GDDR6; 2 GDDR5X; 3 GDDR5; 4 HBM2 Architecture: RX 550~580 = Polaris; RX Vega 56 & 64 = Vega |
||||||
| NVIDIA’s Quadro Workstation GPU Lineup | |||||||
| Cores | Base MHz | Peak FP32 | Memory | Bandwidth | TDP | Price | |
| GV100 | 5120 | 1200 | 14.9 TFLOPS | 32 GB 8 | 870 GB/s | 185W | $8,999 |
| RTX 8000 | 4608 | 1440 | 16.3 TFLOPS | 48 GB 5 | 624 GB/s | ???W | $10,000 |
| RTX 6000 | 4608 | 1440 | 16.3 TFLOPS | 24 GB 5 | 624 GB/s | 295W | $6,300 |
| RTX 5000 | 3072 | 1350 | 11.2 TFLOPS | 16 GB 5 | 870 GB/s | 265W | $2,300 |
| TITAN V | 5120 | 1200 | 14.9 TFLOPS | 12 GB 4 | 653 GB/s | 250W | $2,999 |
| P6000 | 3840 | 1417 | 11.8 TFLOPS | 24 GB 6 | 432 GB/s | 250W | $4,999 |
| P5000 | 2560 | 1607 | 8.9 TFLOPS | 16 GB 6 | 288 GB/s | 180W | $1,999 |
| P4000 | 1792 | 1227 | 5.3 TFLOPS | 8 GB 3 | 243 GB/s | 105W | $799 |
| P2000 | 1024 | 1370 | 3.0 TFLOPS | 5 GB 3 | 140 GB/s | 75W | $399 |
| Notes | 1 GDDR6; 2 GDDR5X; 3 GDDR5; 4 HBM2 5 GDDR6 (ECC); 6 GDDR5X (ECC); 7 GDDR5 (ECC); 8 HBM2 (ECC) Architecture: P = Pascal; V = Volta; RTX = Turing |
||||||
| NVIDIA’s GeForce Gaming GPU Lineup | |||||||
| Cores | Base MHz | Peak FP32 | Memory | Bandwidth | TDP | Price | |
| RTX 2080 Ti | 4352 | 1350 | 13.4 TFLOPS | 11GB 1 | 616 GB/s | 250W | $999 |
| RTX 2080 | 2944 | 1515 | 10.0 TFLOPS | 8GB 1 | 448 GB/s | 215W | $699 |
| RTX 2070 | 2304 | 1410 | 7.4 TFLOPS | 8GB 1 | 448 GB/s | 175W | $499 |
| TITAN Xp | 3840 | 1480 | 12.1 TFLOPS | 12GB 2 | 548 GB/s | 250W | $1,199 |
| GTX 1080 Ti | 3584 | 1480 | 11.3 TFLOPS | 11GB 2 | 484 GB/s | 250W | $699 |
| GTX 1080 | 2560 | 1607 | 8.8 TFLOPS | 8GB 2 | 320 GB/s | 180W | $499 |
| GTX 1070 Ti | 2432 | 1607 | 8.1 TFLOPS | 8GB 3 | 256 GB/s | 180W | $449 |
| GTX 1070 | 1920 | 1506 | 6.4 TFLOPS | 8GB 3 | 256 GB/s | 150W | $379 |
| GTX 1060 | 1280 | 1700 | 4.3 TFLOPS | 6GB 3 | 192 GB/s | 120W | $299 |
| GTX 1050 Ti | 768 | 1392 | 2.1 TFLOPS | 4GB 3 | 112 GB/s | 75W | $139 |
| GTX 1050 | 640 | 1455 | 1.8 TFLOPS | 2GB 3 | 112 GB/s | 75W | $109 |
| Notes | 1 GDDR6; 2 GDDR5X; 3 GDDR5; 4 HBM2 Architecture: GTX & TITAN = Pascal; RTX = Turing |
||||||
And here’s the PC used for testing:
| Techgage Workstation Test System | |
| Processor | Intel Core i9-7980XE (18-core; 2.6GHz) |
| Motherboard | ASUS ROG STRIX X299-E GAMING |
| Memory | HyperX FURY (4x16GB; DDR4-2666 16-18-18) |
| Graphics | AMD Radeon RX Vega 64 8GB (18.10.1) AMD Radeon RX 580 8GB (Red Devil; 18.10.1) AMD Radeon Pro WX 8200 8GB (18.Q3.1) AMD Radeon Pro WX 7100 8GB (18.Q3.1) AMD Radeon Pro WX 5100 4GB (18.Q3.1) AMD Radeon Pro WX 4100 4GB (18.Q3.1) AMD Radeon Pro WX 3100 4GB (18.Q3.1) NVIDIA GeForce RTX 2080 Ti 11GB (NVIDIA FE; 416.34) NVIDIA TITAN Xp 12GB (416.34) NVIDIA GeForce GTX 1080 Ti 11GB (416.34) NVIDIA Quadro P6000 24GB (416.30) NVIDIA Quadro P5000 16GB (416.30) NVIDIA Quadro P4000 8GB (416.30) NVIDIA Quadro P2000 5GB (416.30) |
| Audio | Onboard |
| Storage | Kingston KC1000 960GB M.2 SSD |
| Power Supply | Corsair 80 Plus Gold AX1200 |
| Chassis | Corsair Carbide 600C Inverted Full-Tower |
| Cooling | NZXT Kraken X62 AIO Liquid Cooler |
| Et cetera | Windows 10 Pro build 17763 (1809) |
| For an in-depth pictorial look at this build, head here. | |
There’s not too much else to note aside from the fact that the latest version of both Autodesk’s 3ds Max 2019 was used, as well as AMD’s Radeon ProRender 2.3.379 renderer. Here are (some) notes about our OS and test setup:
- Windows and installed software is updated (and Windows Update is paused afterwards).
- All testing is done using a 4K (3840×2160) desktop resolution and 1920×1080 render resolution.
- G-SYNC, FreeSync, 3D, and screen timeouts are disabled.
- Windows features disabled: Cortana, Firewall, Defender, Search, Event Log.
- Most preinstalled Windows Store bloat is uninstalled, as is OneDrive.
- Ultimate Performance power profile is used.
- All non-essential services are disabled in Task Manager’s “Startup” tab.
- Windows’ dark mode is enabled (now you know it exists!).
- EFI configuration is default, as the memory defaults to XMP settings.
With all of that covered, let’s dive into the reason this article exists:
Radeon ProRender Performance Testing


There’s a lot to dissect here, so let’s start from the top.
Clearly, NVIDIA has one hell of a good thing going with its Turing RTX GeForce graphics cards. The 2080 Ti dominates everything else in the chart – even the dual-GPU configuration. Technically, that shouldn’t be the case, and I feel like it wouldn’t be if ProRender used NVIDIA cards a little more efficiently. It could also be that NVIDIA’s own driver lacks ProRender optimizations; I’m not too sure. Either way, with NVIDIA’s placement in this chart, it’s not as though we’re being held back in comparison to the competition.
Even though TITAN Xp is a bit faster than a WX 9100 on the FP32 front, two of AMD’s top cards are likely to outperform two TITAN Xps, since ProRender is (unsurprisingly) optimized on Radeon Pro. The situation isn’t at all “bad” on the NVIDIA side, though. Back in April, dual TITAN Xps performed worse than a single TITAN Xp, so clearly, major strides have been made to improve that situation.
Ultimately, NVIDIA rules the roost here, hogging the top five spots. In sixth place is the Radeon RX Vega 64, which improves upon the WX 8200 a little bit. The new WX 8200 performs almost identically to how a Vega 56 would, and here, it doesn’t really fall too far behind the Vega 64.
For sanity’s sake, none of the Polaris-based WX cards, or the Quadro P2000, are in any way “ideal” for ProRender work. 644 seconds might not seem so bad for the GT-R render, but you must bear in mind that our tests are not done with production-level quality. If you want to get closer to that, you can multiply any one of these results by 25 (for 2500 iterations) to get a better idea of a realistic render time. That’d be ~268 minutes with a WX 7100, ~136 minutes with a Vega 64, or ~52 minutes with 2080 Ti.
I mentioned before that ProRender now supports heterogeneous rendering, so I couldn’t tackle performance and pretend it didn’t exist. When I first tested the feature a couple of months ago, I actually saw worse performance than I did when I only rendered using the GPU. Fast-forward to today, and the situation seems to have improved – at least a little bit.

With the CPU introduced into the rendering process, some of the placements change up a little bit. The 2080 Ti drops from the first position to second, surpassed by the dual TITAN Xps. The Quadro P6000 managed to outperform the TITAN Xp, as well – another reversal from the original graph.
Given how some of the scaling changed after the CPU was added to the mix, it’s hard to figure out why it’s happening. Did the dual TITAN Xps somehow become more efficient with heterogeneous rendering? Why did a GPU like the 2080 Ti see vastly reduced performance in the GT-R render?
Here’s a direct comparison between GPU and CPU+GPU:

Here, some of the faults in testing can be seen, such as how the 2080 Ti managed to get worse performance once heterogeneous rendering was engaged. Meanwhile, TITAN Xp performance barely changed, but TITAN Xp x2 performance gained fairly significantly.
On the whole, ProRender doesn’t seem to love NVIDIA GPUs, but that’s not necessarily a fault of the renderer. It could be that NVIDIA itself could optimize performance in the driver, and I’m not sure the company is even concerned with ProRender performance right now. Not that the company has much to fuss over, since its GPUs are dominating these charts overall.
As we look at the chart from the bottom up, it becomes clear that the beefier the GPU, the smaller the advantage adding a CPU will give. That’s not the case with all renderers, and changed performance will of course depend on the choice of CPU. Our 18-core might exhibit gains in areas where an 8700K wouldn’t.
Conveniently, I did decide to test the 8700K with an RTX 2070, since that PC was close.


In this test, the RTX 2070 managed to render the project in 2m 52s, whereas the heterogeneous render took 3m 25s, or about 19% longer. Clearly, this kind of rendering is not optimized for NVIDIA, but it is for AMD. Again, I am not sure why it’s so poor for NVIDIA, but it’s likely to improve in the future.
I hate to bring another renderer into this discussion, but to highlight the differences of performance scaling, I must. Here are the results from testing the same feature with V-Ray earlier this year (with the beta version, no less):

In the same system, the WX 3100 was 219% faster with the CPU+GPU render than it was with the GPU render. In V-Ray, the P2000 proved 448% faster with CPU+GPU over GPU only. Could this be the difference between a renderer which was developed from the start with CPU support, and one built from the start with only GPU support? Probably, but that’s not to discredit AMD’s efforts. I’ve already seen major improvement over the past six months, and I see nothing to suggest that things won’t keep improving.
Final Thoughts
When I sat down to figure out how I wanted to test ProRender in an updated test suite, I figured I’d give Autodesk’s Maya some love since I use 3ds Max in so many other places. I am not experienced with Max, but I am even less experienced with Maya, and unfortunately, headache after headache prevented me from testing with that.
For some reason, ProRender in Maya does not save most render settings, which means that I can’t very well automate the benchmarking unless I want to use the (very poor) default settings. I am also unable to render from the command line and have the render time print out on the outputted image, and when Maya takes many seconds to load, you can’t simply blanket record the time the entire process takes.
Nonetheless, ProRender isn’t identical across all design suites, but it’s definitely familiar from one to another. 3ds Max has no problem saving ProRender settings inside the project file itself. In Maya, you must manually export the settings in order to import them again later. It’s clunky.

AMD’s Radeon Pro WX 8200
I didn’t decide to rant a little bit about this hassle because I spent more than a dozen hours on it, but because with all of the praise I’ve heaped on ProRender since it came out, it should be clear that it still has some niggles. With heterogeneous rendering, NVIDIA cards don’t see much benefit (despite the opposite being true in V-Ray, or even with the Radeon cards), and then there’s odd issues like your settings not saving.
The focus of this article has revolved entirely around performance, and since this was a performance look, that’s probably fine. However, there’s a lot more to ProRender than just its performance. Why you’d want to check it out is because it’s free, open-source, and physically based. This OpenCL renderer isn’t just for Windows, either, but also Mac OS and Linux. Current supported suites include 3ds Max, Maya, SolidWorks, and even Blender. With Blender and ProRender, you’d have a 100% free and open-source PBR solution. That’s pretty awesome.
As I’ve said a few times, ProRender continues to get better over time. This is the third dedicated look Techgage has had of ProRender this year, and with the constant improvement being made, it seems likely that another performance look is only a few months off.

Support our efforts! With ad revenue at an all-time low for written websites, we're relying more than ever on reader support to help us continue putting so much effort into this type of content. You can support us by becoming a Patron, or by using our Amazon shopping affiliate links listed through our articles. Thanks for your support!

Rob Williams
Rob founded Techgage in 2005 to be an 'Advocate of the consumer', focusing on fair reviews and keeping people apprised of news in the tech world. Catering to both enthusiasts and businesses alike; from desktop gaming to professional workstations, and all the supporting software.


