- Qualcomm Launches Snapdragon 4 Gen 2 Mobile Platform
- AMD Launches Ryzen PRO 7000 Series Mobile & Desktop Platform
- Intel Launches Sleek Single-Slot Arc Pro A60 Workstation Graphics Card
- NVIDIA Announces Latest Ada Lovelace Additions: GeForce RTX 4060 Ti & RTX 4060
- Maxon Redshift With AMD Radeon GPU Rendering Support Now Available
Social & RSS Feeds
Latest Videos


Latest News
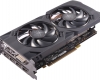
AMD Radeon RX 470 4GB Graphics Card Review
by Rob Williams on August 5, 2016 in Graphics & Displays
AMD’s second Polaris graphics card has arrived, and it comes to us in the form of the Radeon RX 470. As its name implies, AMD’s latest model slots in just under the RX 480 – really close. The SRP difference between these two cards is a mere $20, so let’s dive in and see what you can expect from either one.
Page 1 – Introduction, About The RX 470 & Testing Notes
It sure has been an active summer for graphics so far. It all kicked-off in May, with the release of NVIDIA’s GeForce GTX 1080, which was quickly followed by the launch of the GeForce GTX 1070. Fast-forward to the following month, and AMD unleashed its Radeon RX 480, a card that saw NVIDIA leap into action to release the GeForce GTX 1060.
As if that wasn’t enough for a two-month span, both AMD and NVIDIA announced their brand-new Radeon Pro and Quadro workstation graphics cards at SIGGRAPH. Then, for good measure, and in advance of this review, we posted a look at 2560×1080 ultrawide performance of both the GTX 1060 and RX 480.
Whew. It’s been busy, and it doesn’t look like things are going to be slowing down. On the test bench today is AMD’s second Polaris-based release, the Radeon RX 470. The card comes in at $179 SRP, and it aims to become the ultimate “HD gaming” (1080p) card for the money.
| AMD Radeon Series | Cores | Core MHz | Memory | Mem MHz | Mem Bus | TDP |
| Radeon RX 480 | 2304 | 1266 | ≤8192MB | 8000 | 256-bit | 150W |
| Radeon RX 470 | 2048 | 1206 | 4096MB | 7000 | 256-bit | 120W |
| Radeon RX 460 | 896 | 1090 | 4096MB | 7000 | 128-bit | 75W |
| Radeon Pro Duo | 4096*2 | 1000 | 4096MB*2 | 1000 | 4096-bit*2 | 350W |
| Radeon R9 Fury X | 4096 | 1050 | 4096MB | 1000 | 4096-bit | 275W |
| Radeon R9 Fury | 3584 | 1000 | 4096MB | 1000 | 4096-bit | 275W |
| Radeon R9 Nano | 4096 | 1000 | 4096MB | 1000 | 4096-bit | 175W |
| Radeon R9 390X | 2816 | 1050 | 8192MB | 6000 | 512-bit | 275W |
| Radeon R9 390 | 2560 | 1000 | 8192MB | 6000 | 512-bit | 275W |
| Radeon R9 380X | 2048 | 970 | 4096MB | 5700 | 256-bit | 190W |
| Radeon R9 380 | 1792 | 970 | 4096MB | 5700 | 256-bit | 190W |
Based on the RX 470’s specs, it’s not hard to glean that it should prove just a bit slower than the top-dog RX 480. That makes it a bit of an odd model in AMD’s current lineup, but that’s not as odd as the pricing. The RX 480 4GB costs $200 SRP, while this RX 470 has an SRP of $180. It’d be nice to see some greater separation here, but AMD is in a bit of a rough spot since it’s currently only catering to the $200-and-under market (minus the 8GB RX 480).
Despite the odd pricing and minor specs difference, if performance scaling matches what we’d expect, then it kind of makes sense that this card would be priced at $180, $20 price difference be damned.
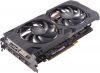
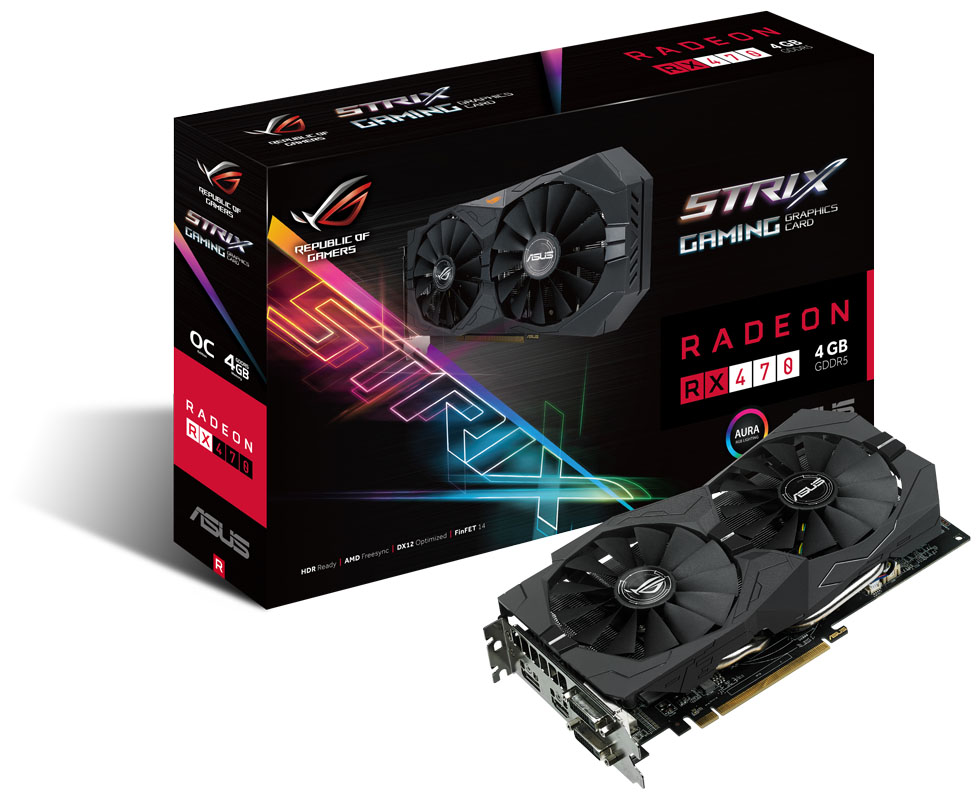
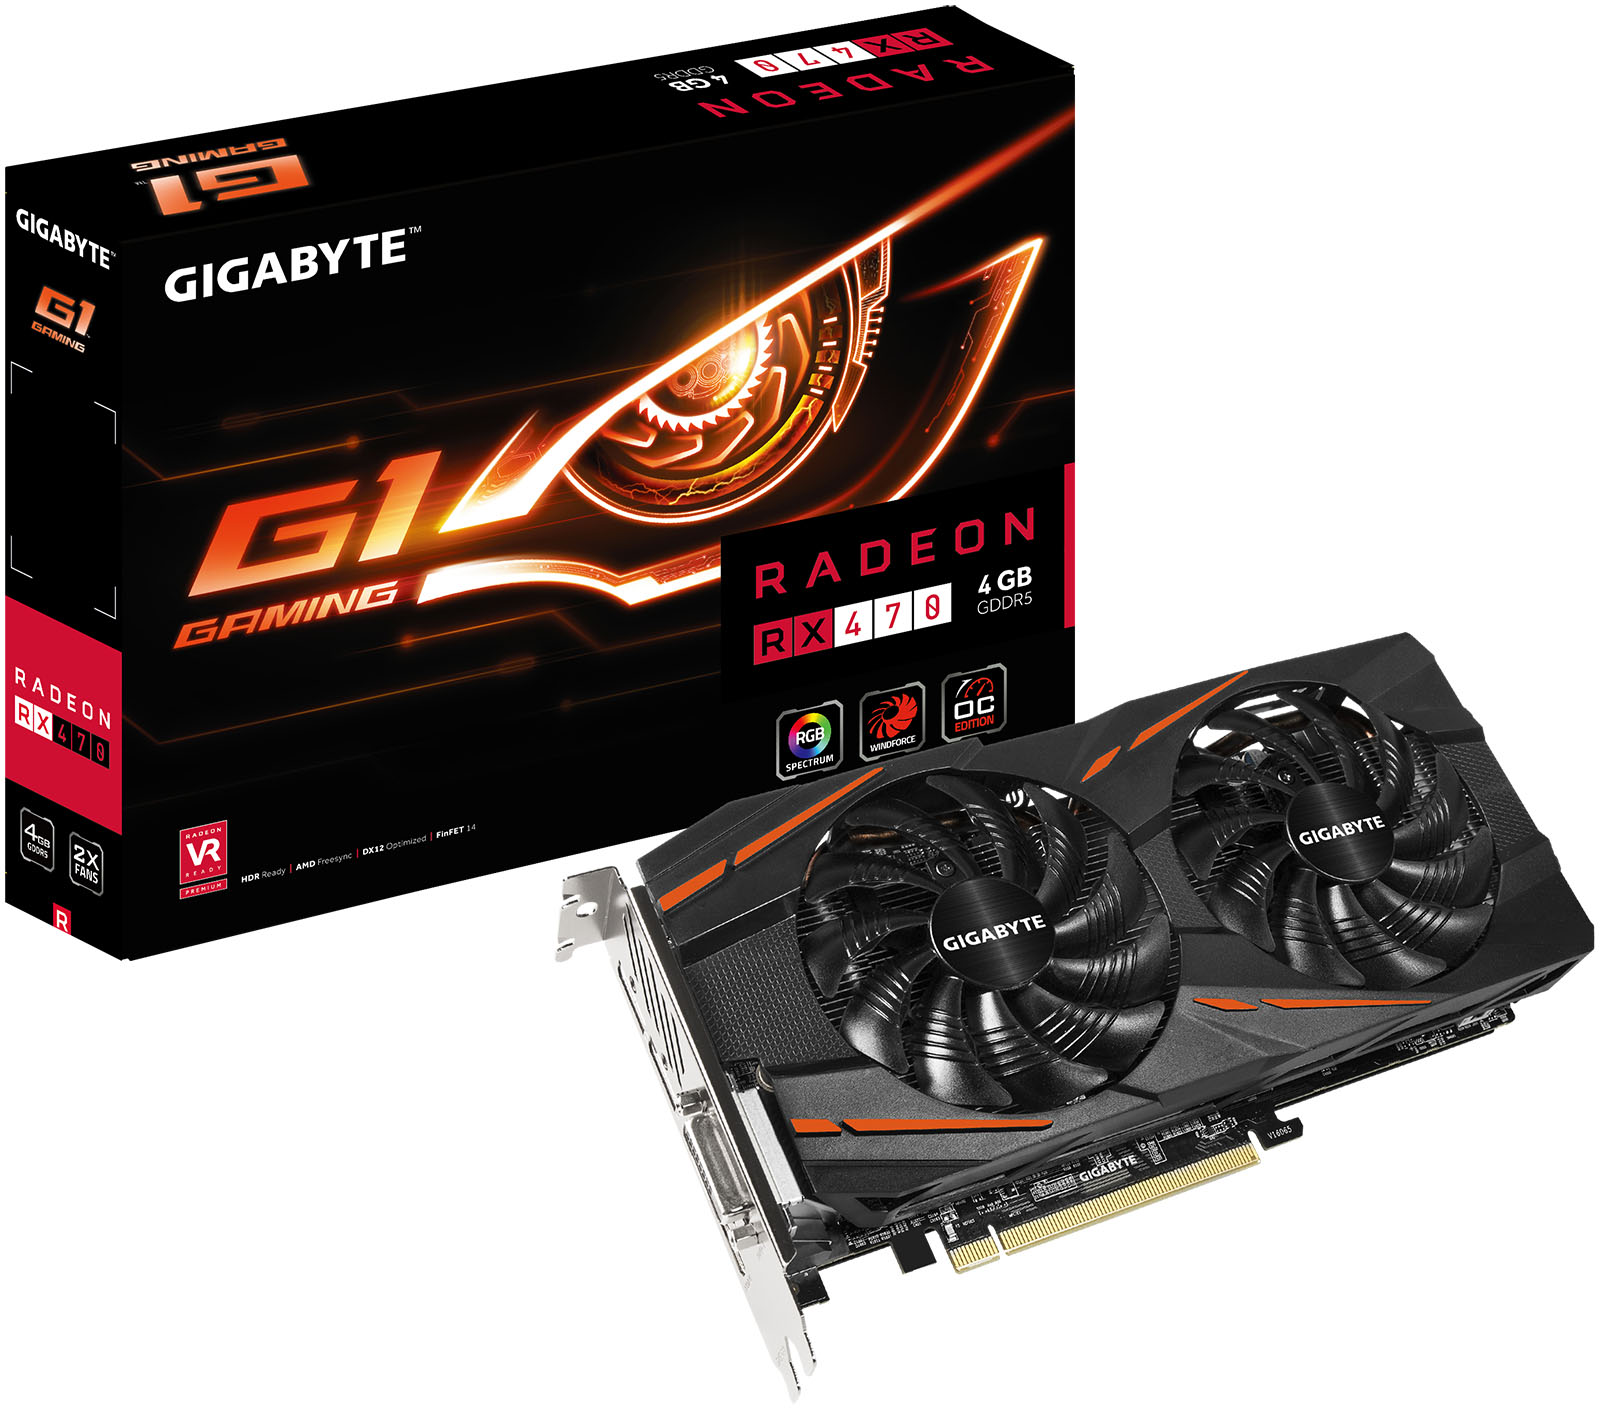
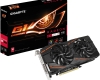
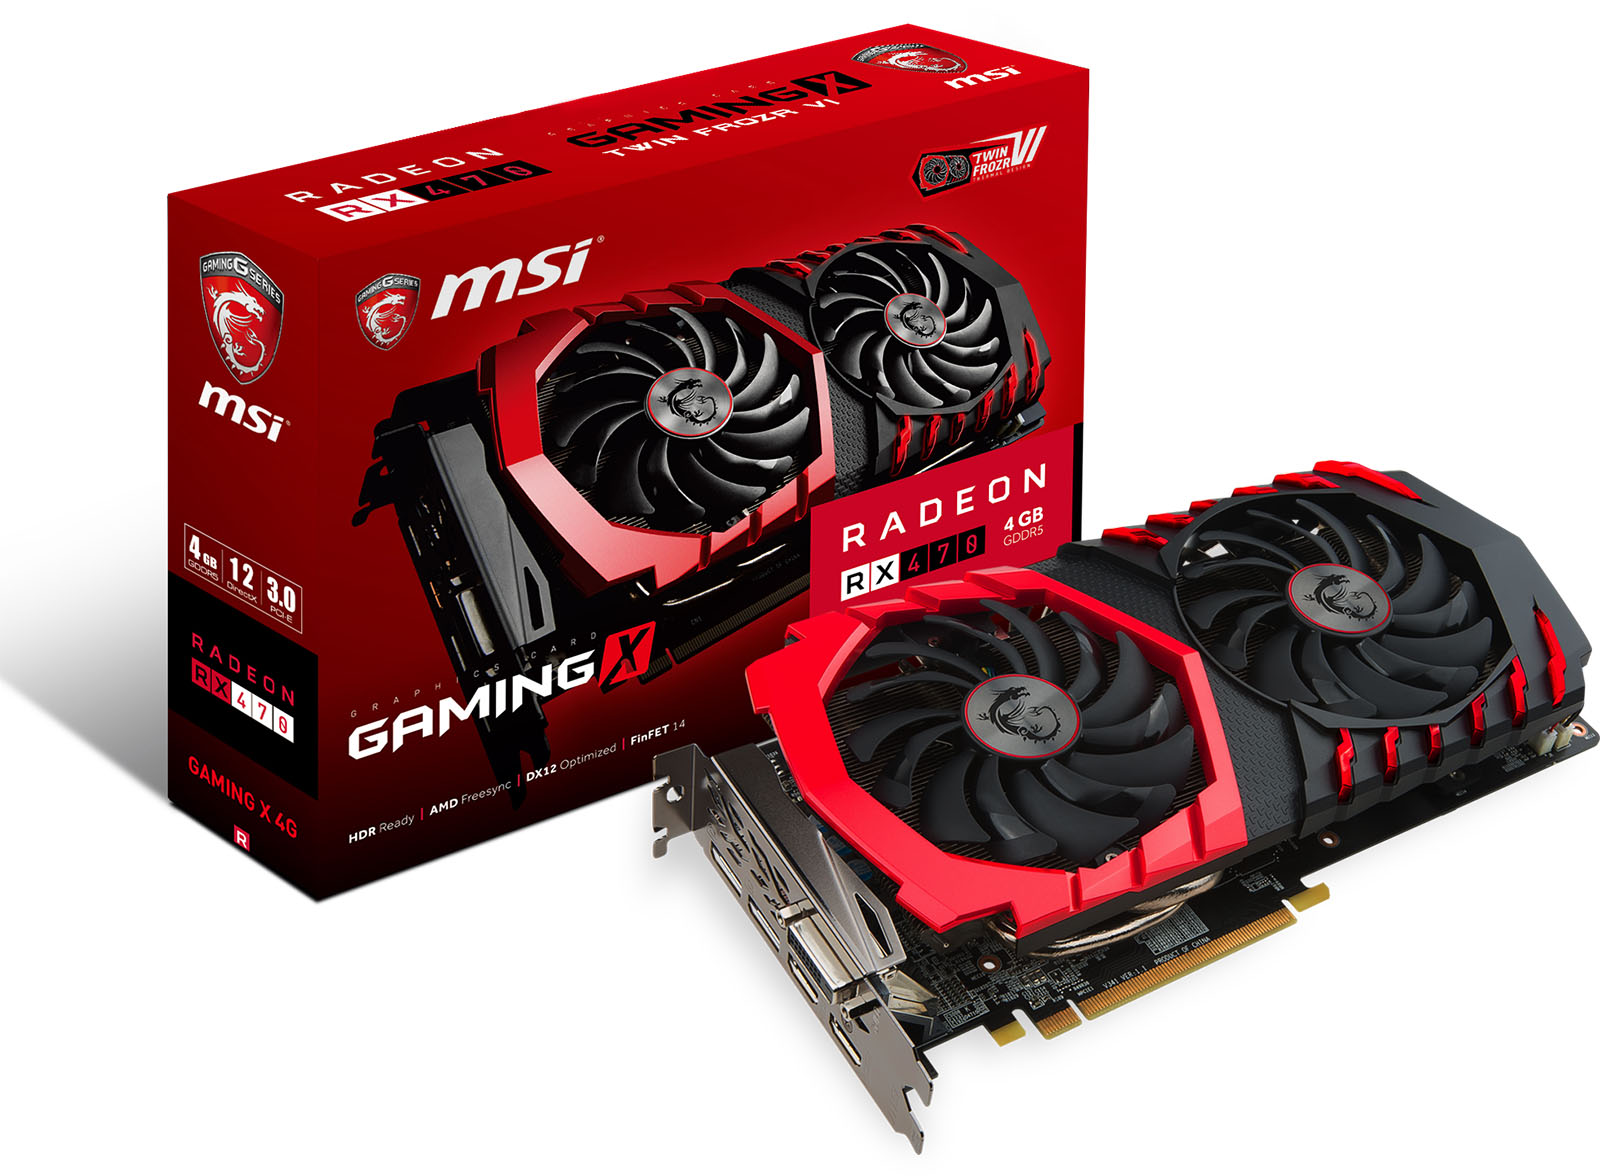
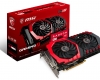
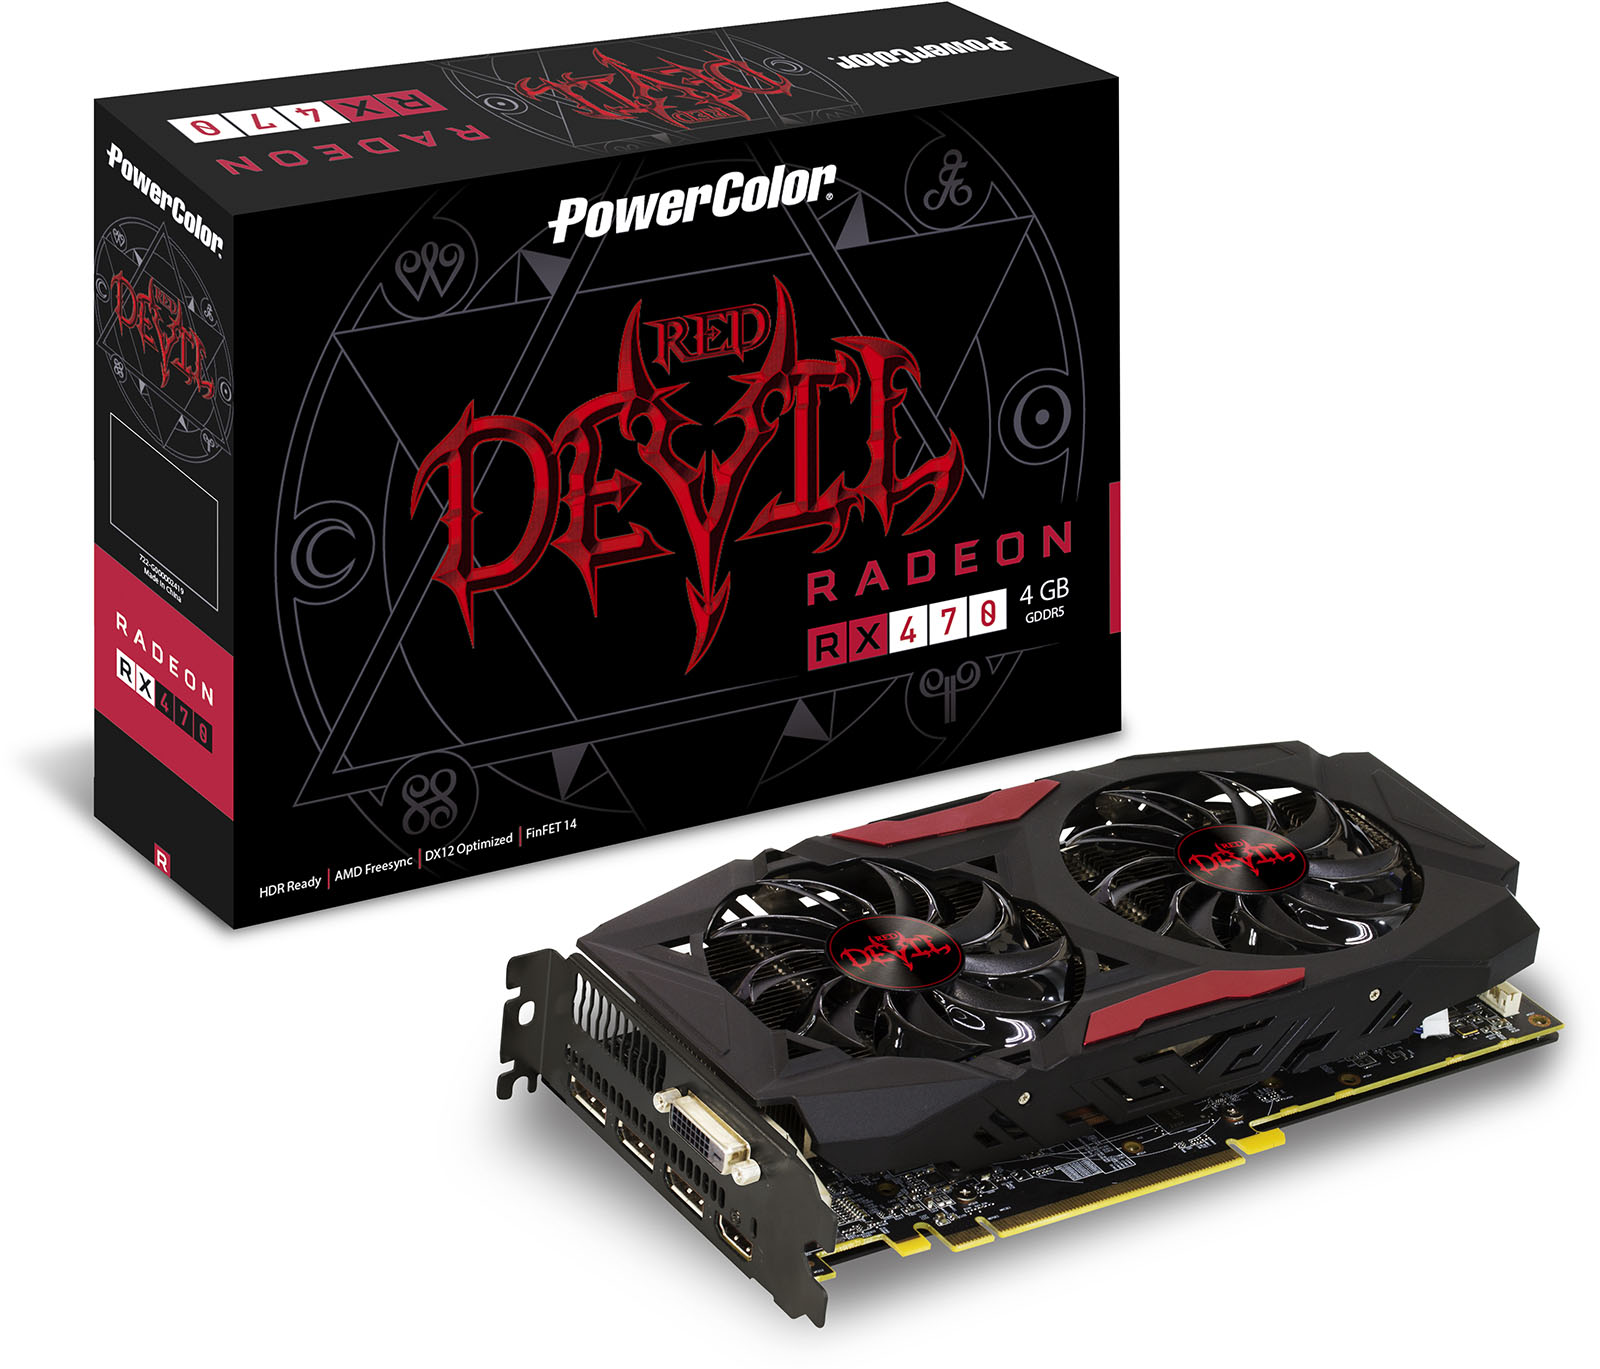
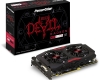
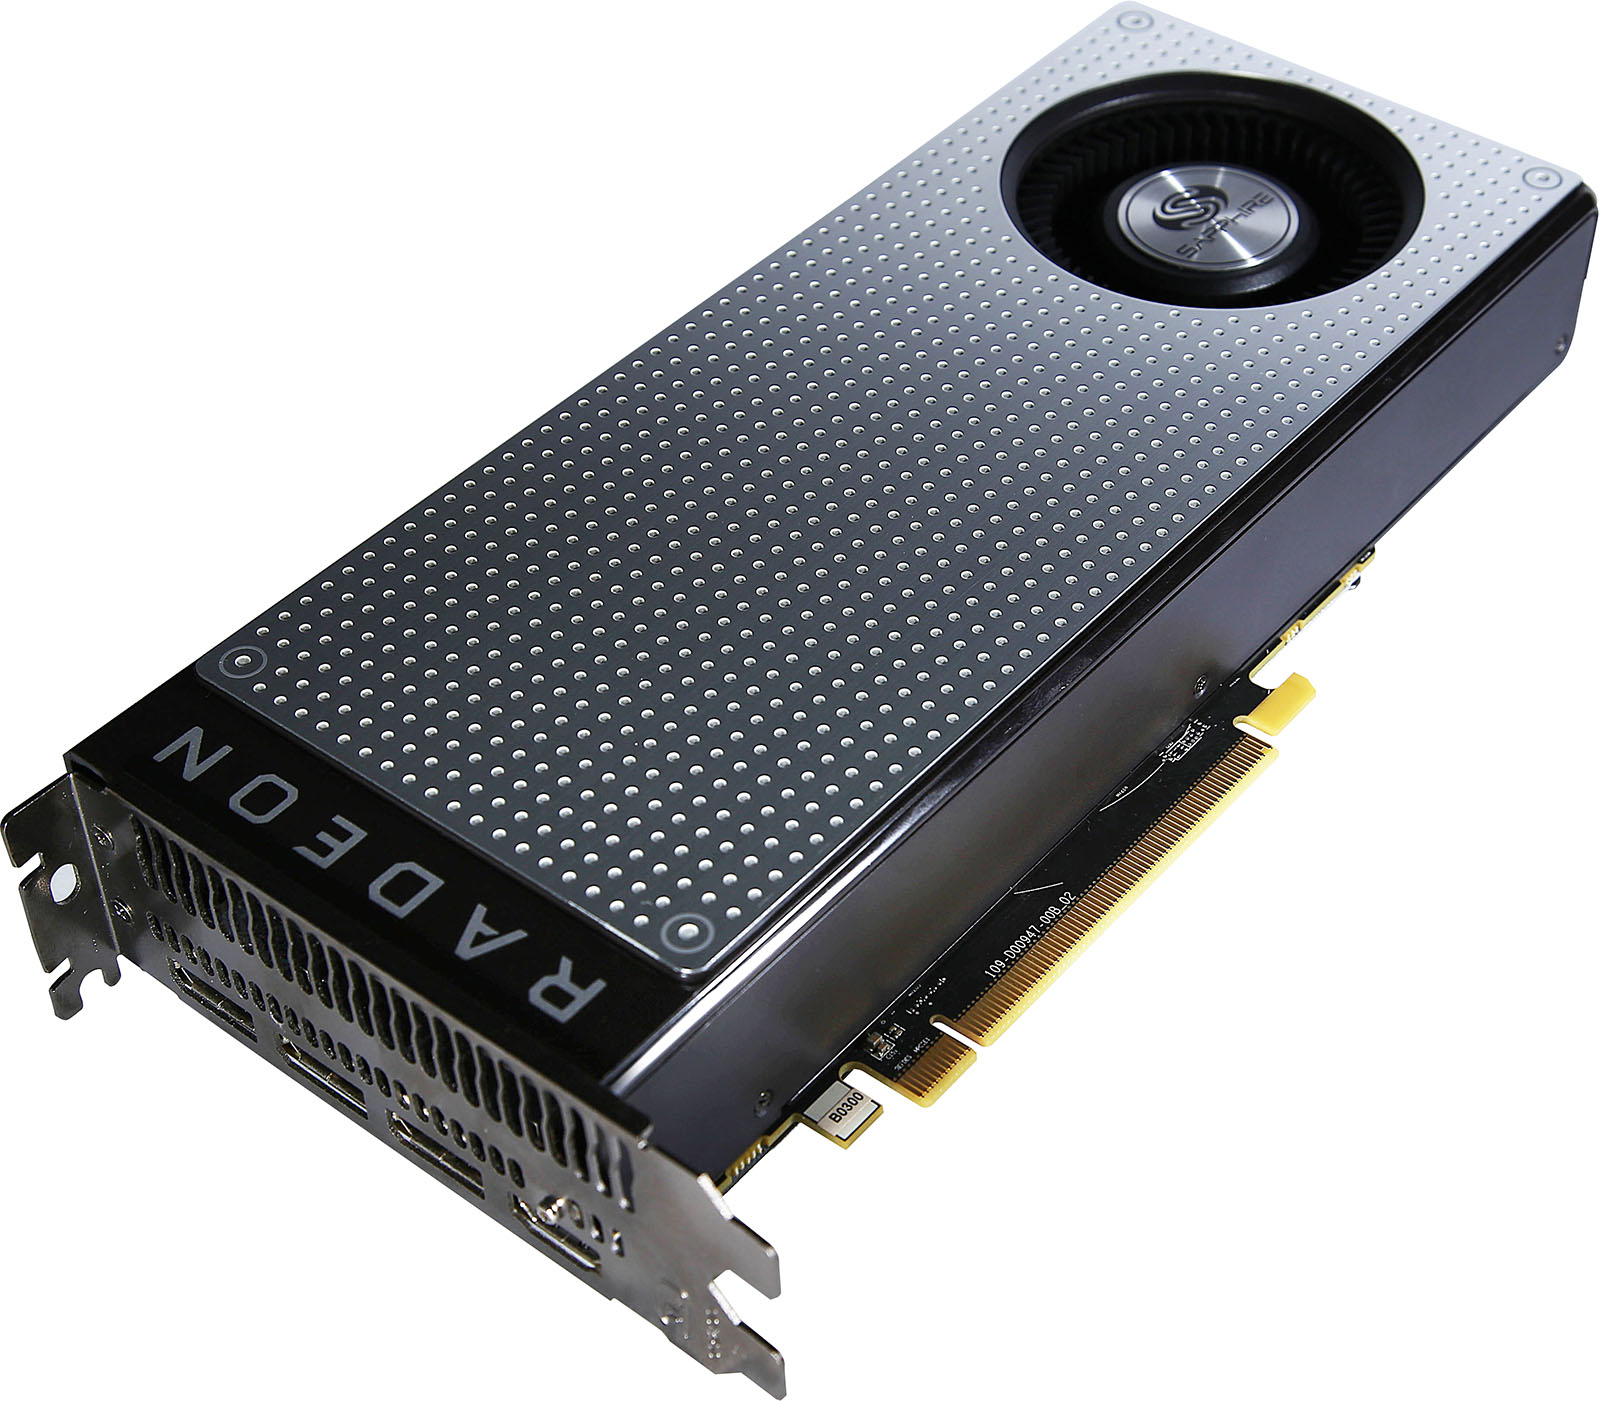
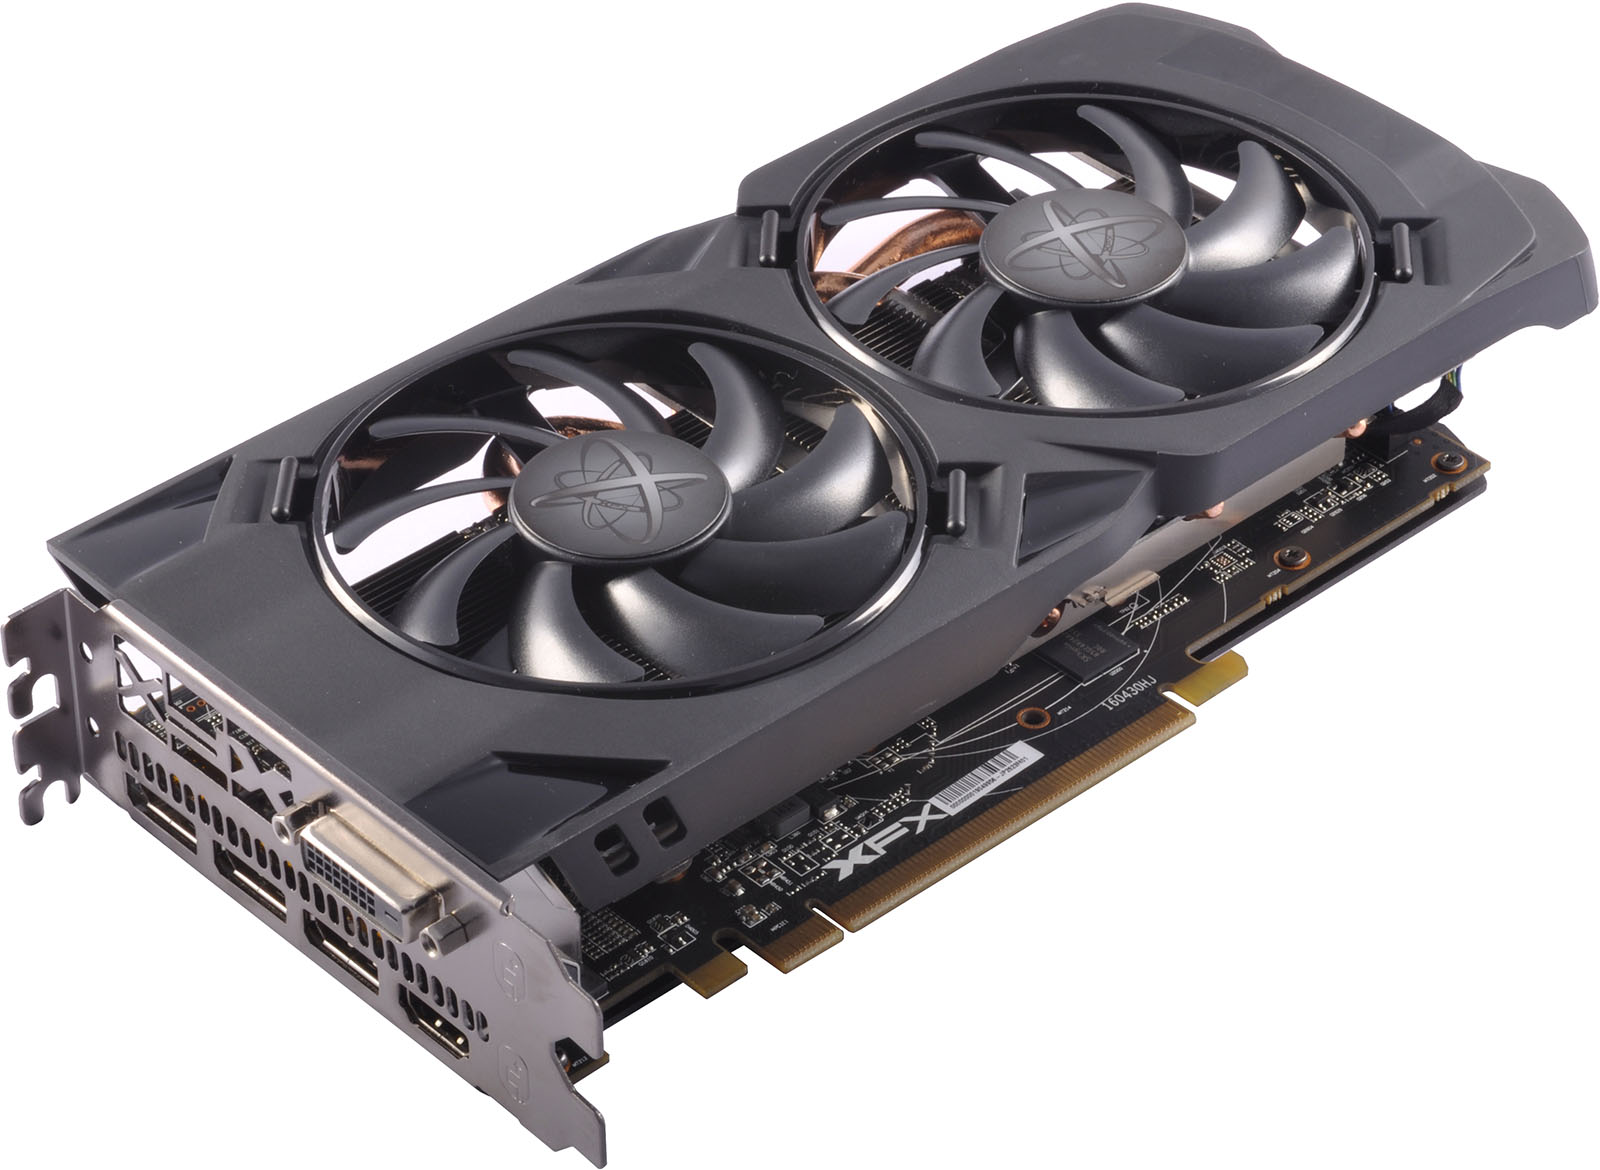
Unlike the RX 480, which AMD produced a reference model for, the company is relying entirely on AIB vendors to craft cards around its GPU. A fleet of such cards can be seen below. An overclocked (+50MHz) XFX model is the one we received for testing.
There’s not much else to say about the RX 470, because we’ve known about the card for so long, and we know what to expect from its performance. So without further ado, let’s just get right into testing – right after a quick look at our test system and methodologies.
Testing Notes
When we need to build a test PC for performance testing, “no bottleneck” is the name of the game. While we admit that few of our readers are going to be equipped with an Intel 8-core processor clocked to 4GHz, we opt for such a build to make sure our GPU testing is as apples-to-apples as possible, with as little variation as possible. Ultimately, the only thing that matters here is the performance of the GPUs, so the more we can rule out a bottleneck, the better.
That all said, our test PC:
| Graphics Card Test System | |
| Processors | Intel Core i7-5960X (8-core) @ 4.0GHz |
| Motherboard | ASUS X99 DELUXE |
| Memory | Kingston HyperX Beast 32GB (4x8GB) – DDR4-2133 11-12-11 |
| Graphics | AMD Radeon R9 Nano 4GB – Catalyst 16.5.3 AMD Radeon RX 470 4GB – Catalyst 16.8.1 Beta AMD Radeon RX 480 8GB – Catalyst 16.6.2 Beta NVIDIA GeForce GTX 980 4GB – GeForce 365.22 NVIDIA GeForce GTX TITAN X (First-gen) 12GB – GeForce 365.22 NVIDIA GeForce GTX 1060 6GB – GeForce 368.64 (Beta) NVIDIA GeForce GTX 1070 8GB – GeForce 368.19 (Beta) NVIDIA GeForce GTX 1080 8GB – GeForce 368.25 |
| Audio | Onboard |
| Storage | Kingston SSDNow V310 1TB SSD |
| Power Supply | Cooler Master Silent Pro Hybrid 1300W |
| Chassis | Cooler Master Storm Trooper Full-Tower |
| Cooling | Thermaltake WATER3.0 Extreme Liquid Cooler |
| Displays | Acer Predator X34 34″ Ultra-wide Acer XB280HK 28″ 4K G-SYNC ASUS MG279Q 27″ 1440p FreeSync |
| Et cetera | Windows 10 Pro (10586) 64-bit |
Framerate information for all tests – with the exception of certain time demos and DirectX 12 tests – are recorded with the help of Fraps. For tests where Fraps use is not ideal, I use the game’s built-in test (the only option for DX12 titles right now). In the past, I’ve tweaked the Windows OS as much as possible to rule out test variations, but over time, such optimizations have proven fruitless. As a result, the Windows 10 installation I use is about as stock as possible, with minor modifications to suit personal preferences.
In all, I use 8 different games for regular game testing, 3 for DirectX 12 testing, and 1 for Vulkan testing. That’s in addition to the use of three synthetic benchmarks. Because some games are sponsored, the list below helps oust potential bias in our testing.
(AMD) – Ashes of the Singularity (DirectX 12)
(AMD) – Battlefield 4
(AMD) – Crysis 3
(AMD) – Hitman (DirectX 12)
(NVIDIA) – Metro: Last Light Redux
(NVIDIA) – Rise Of The Tomb Raider (incl. DirectX 12)
(NVIDIA) – The Witcher 3: Wild Hunt
(Neutral) – DOOM (incl. Vulkan)
(Neutral) – Grand Theft Auto V
(Neutral) – Total War: ATTILA
If you’re interested in benchmarking your own configuration to compare to our results, you can download this file (5MB) and make sure you’re using the exact same graphics settings. I’ll lightly explain how I benchmark each test before I get into each game’s performance results.

Support our efforts! With ad revenue at an all-time low for written websites, we're relying more than ever on reader support to help us continue putting so much effort into this type of content. You can support us by becoming a Patron, or by using our Amazon shopping affiliate links listed through our articles. Thanks for your support!

Rob Williams
Rob founded Techgage in 2005 to be an 'Advocate of the consumer', focusing on fair reviews and keeping people apprised of news in the tech world. Catering to both enthusiasts and businesses alike; from desktop gaming to professional workstations, and all the supporting software.


