- Qualcomm Launches Snapdragon 4 Gen 2 Mobile Platform
- AMD Launches Ryzen PRO 7000 Series Mobile & Desktop Platform
- Intel Launches Sleek Single-Slot Arc Pro A60 Workstation Graphics Card
- NVIDIA Announces Latest Ada Lovelace Additions: GeForce RTX 4060 Ti & RTX 4060
- Maxon Redshift With AMD Radeon GPU Rendering Support Now Available
Social & RSS Feeds
Latest Videos


Latest News
Fresh Air Comes To The Cloud: Airthinx Air Quality Monitor Review
by Tom Roeder on December 20, 2018 in Mobile
How much time do you spend indoors? If you’re like me, it’s far more than it should be. Today, modern smartphones and even computer monitors are filtering out certain light spectrums (like blue light), as studies have found them to be disruptive to sleep, concentration, and even long-term vision. But do you ever think about air quality, and what you’re breathing in?
How bad is your air quality? It’s not something I ever paid much attention to, because… what could you really do about it?
If you suspect your air quality is poor, you can always invest in air filtration, for which there is quite a market, but how do you know what you need to buy?
Some filtration systems are better suited for one type of pollutant, others are better suited for another, and some are more general purpose. Without knowing what your pollutants are, where do you start? Good air purifiers (aside from the gimmicks you see with the “As Seen On TV” badge) can be quite expensive.
If you decide to plunk down your hard-earned money on an air purifier, you’ll likely need to investigate what you need to clean first. Before I get too far in the article, here is a link you can follow if you want to learn more about what the US EPA has designated as indoor air pollutants.
Today we look at an air quality monitor from Airthinx. The Airthinx is really at the top end of the spectrum as far as price goes for the average consumer, however the Airthinx isn’t just your standard app-enabled Wi-Fi only air sniffer.
A Tour of the Features
The Airthinx has an integrated sensor array that measures the following:
PM 1 – These are extremely fine particulate matter (PM) particles with a diameter less than 1 micron (a micron is a thousandth of a millimeter, a human red blood cell is about 5 microns across. A human hair is about 75 microns across.)
PM 2.5 – Atmospheric particulate matter (PM) that has a diameter of less than 2.5 micrometers, which is about 3% the diameter of a human hair.
PM 10 – Coarse dust particles (PM10) are 2.5 to 10 micrometers in diameter, and can include crushing or grinding operations and dust stirred up by vehicles on roads, to name a few.
CH2O – Formaldehyde – yes, that. Not only is this used for preserving those creepy Biology lessons in school, formaldehyde is also commonly found in any type of textile like carpets and rugs, but also paints, cleaning agents, and even wood flooring.
TVOC – This refers to the total concentration of multiple airborne VOCs present simultaneously in the air. A VOC is a Volatile Organic Compound, and it refers to any one of thousands of organic (carbon-containing) chemicals that are present mostly as gases at room temperature. Here is a link for more info.
CO2 – Carbon dioxide is what we expel when we breathe. The less CO2 you have in your house, (generally) the better, as too much CO2 can cause you to get drowsy, have headaches, and induce nausea.
The Airthinx has temperature and humidity sensors, as well as a barometer. There are also many different connectivity methods, including Wi-Fi, Bluetooth, LoRA, NB-IoT.
The air quality monitor comes with an internal 3G SIM for cellular connectivity (w/ unlimited data) where you might not have Wi-Fi, as well as free cloud monitoring and data collection for the life of the product.
Visual Tour
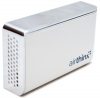
The Airthinx has a contemporary style; very neutral, with superb fit and finish. The main color is white, with an LED strip at the top, and chrome across the top and side.

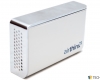

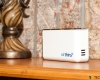

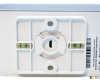
The unit can be wall-mounted if you like, and even comes with a level built into the mount to ensure the device will be level.
Airthinx is powered via micro USB, which can be connected either from the bottom, or the back, which gives you flexibility with your installation and cable management.
Usage and Final Thoughts
When your unit arrives, you can schedule (at no charge) a personalized user interface walkthrough with an engineer from the Airthinx team that will show you how to get things set up, how to use the web and app interface, as well as answer any questions you might have.

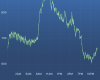
The web UI gives you a lot of insight to what is going on with your air quality. You can look at historical data, going as far back as the day you activated your device.
You can create widgets and place them on the dashboard; this is an example of what I consider to be the most important readings over time (that I chose). These will be the first thing I see when I login to the web UI, which is fully customizable (you can resize windows, rearrange them, and so on.)

If you have multiple units, you can manage them all from this single pane of glass. When you log in, you can just select your device, and you’re off to the races.

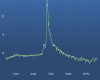
You can also set up alerts, for example – if anything that is measured crosses any threshold you specify, you will get an alert. In this example, I set the alert to let me know if my indoor air temperature crossed above 75 degrees F:


You can choose to store all of your data on the Airthinx cloud, download it in PDF form with graphs, or you can choose to export it to a CSV file, which is very handy for property managers or even home users that love archival data.


There is also API integration if you want to customize things even further. Airthinx informed us that this works very well with Nest thermostats. For example, if a certain pollutant reached a threshold you didn’t like, you could have an air filter come on and run until that pollutant dropped back to the range you specified.

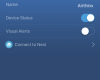
The mobile app is very well made. I used it only on iOS, but my results were great – I never had the app crash or had an issue of any kind. This app is a much simpler version of the Web UI; you get the same data and detail.
At a quick glance, you get a view of your air quality, and can look at individual pollutants. From the mobile app you can quickly pair your Nest thermostat without any API knowledge at all.
On the whole, the Airthinx is priced far ahead of most other air quality monitors on the market. It’s currently priced at $699, or $49 a month (with a 24 month contract) for the standard package. An enterprise package is also offered, which includes a higher tier of support, volume discounts, consulting, and customization with the product itself and custom APIs.


For the average home consumer, this device is probably priced too high to win hearts, and I would have to agree. However, with the level of functionality and how diverse this item is, its features are far beyond anything I’ve seen for home air quality monitors.
This device really isn’t aimed at the regular ‘smart home’ consumer who thinks it’s cool to tell Alexa to turn on a light, but rather a power user who loves to tinker and archive data, identify patterns, etc… or the consumer who is really taking their air quality seriously and wants to be able to use real data to identify patterns, and make corrections to their environment and see in real-time if the improvements they are making will bear fruit.
One other market this is aimed at, of course, is property management. Someone who has multiple sites to manage could greatly benefit from this solution. Being able to collect data and present this data to others when better air filtration is needed would be great, especially if employees are complaining about allergens in their area of the office. Alerts in real-time if a unit is sensing high temperatures, or a sudden spike in humidity? If I had properties to manage, data like this would be invaluable.
Pros:
- Stores as much historical data as you can handle.
- Highly customizable, includes API integration.
- Interface is clean, simple, and powerful.
- Cellular connectivity is included, with no data cap.
- Free cloud data storage is offered for life.
Cons:
- There’s no getting around it: it’s expensive.

Support our efforts! With ad revenue at an all-time low for written websites, we're relying more than ever on reader support to help us continue putting so much effort into this type of content. You can support us by becoming a Patron, or by using our Amazon shopping affiliate links listed through our articles. Thanks for your support!