- Qualcomm Launches Snapdragon 4 Gen 2 Mobile Platform
- AMD Launches Ryzen PRO 7000 Series Mobile & Desktop Platform
- Intel Launches Sleek Single-Slot Arc Pro A60 Workstation Graphics Card
- NVIDIA Announces Latest Ada Lovelace Additions: GeForce RTX 4060 Ti & RTX 4060
- Maxon Redshift With AMD Radeon GPU Rendering Support Now Available
Social & RSS Feeds
Latest Videos


Latest News
Battle of the Workstations: AMD Ryzen Threadripper vs Intel Core X-Series
by Rob Williams on July 18, 2018 in Graphics & Displays, Processors, Systems
The workstation PC market got a shot in the arm last fall when AMD launched its Ryzen Threadripper platform, offering a 16-core CPU for a reasonable price. That led many to ponder what should be in their next machine. Join us as we pit comparable AMD and Intel machines against each other in over twenty workstation scenarios.
Page 1 – AMD vs Intel Workstation: How We Tested, Viewport Performance
At the start of the year, we witnessed a battle of two top-end rigs: one built around Intel’s Core X-series; the other around AMD’s Ryzen Threadripper. In that match-up, the CPU was the sole focus, not the platform as a whole. For workstation users who also rely on the GPU, that could have meant that a piece of the puzzle was still missing.
You could consider this article to be a bit of a revisiting of that one. This has an expanded focus, looking at each platform from the perspective of owning one or the other for workstation projects. This is by no means going to be what I’d consider in-depth; rather, this is meant to be an overall view of each platform, not a look at one specific component to the other.
For that reason, this article is going to include as few synthetic tests as possible. I am not particularly interested if one platform hits 60GB/s on the memory versus 50GB/s on the other. I care more about the end result from real-world workloads; or, when it’s not possible to do real-world testing, the synthetics need to be relevant to the real-world. Exceptions are with our UL and Unigine gaming benchmarks.
To give some background on the purpose of this article: its simple goal is to see how AMD’s and Intel’s respective platforms perform overall across a whack of workstation scenarios. Some users might ultimately choose one over the other, not realizing that the opposing platform would suit them better. It happens more than you probably think.
Say, for example, that clock-for-clock, AMD’s Threadripper is slower than Intel’s Core X-series (a true statement). Would that matter in the grand scheme to someone using Redshift, V-Ray, SolidWorks, and so on? If a GPU dictates your work more than anything else, chances are Intel’s and AMD’s platforms are going to feel similar, with both offering their unique strengths.
To sound like a broken record, it always pays to know your workload, because the better informed your purchase decision is, the happier you’re going to be. In some cases, AMD will exhibit super-strong performance, and in other cases, Intel will. You could take this article to be a gauge of performance in a particular app, or use it to figure out the best use of your hard-earned $$$.

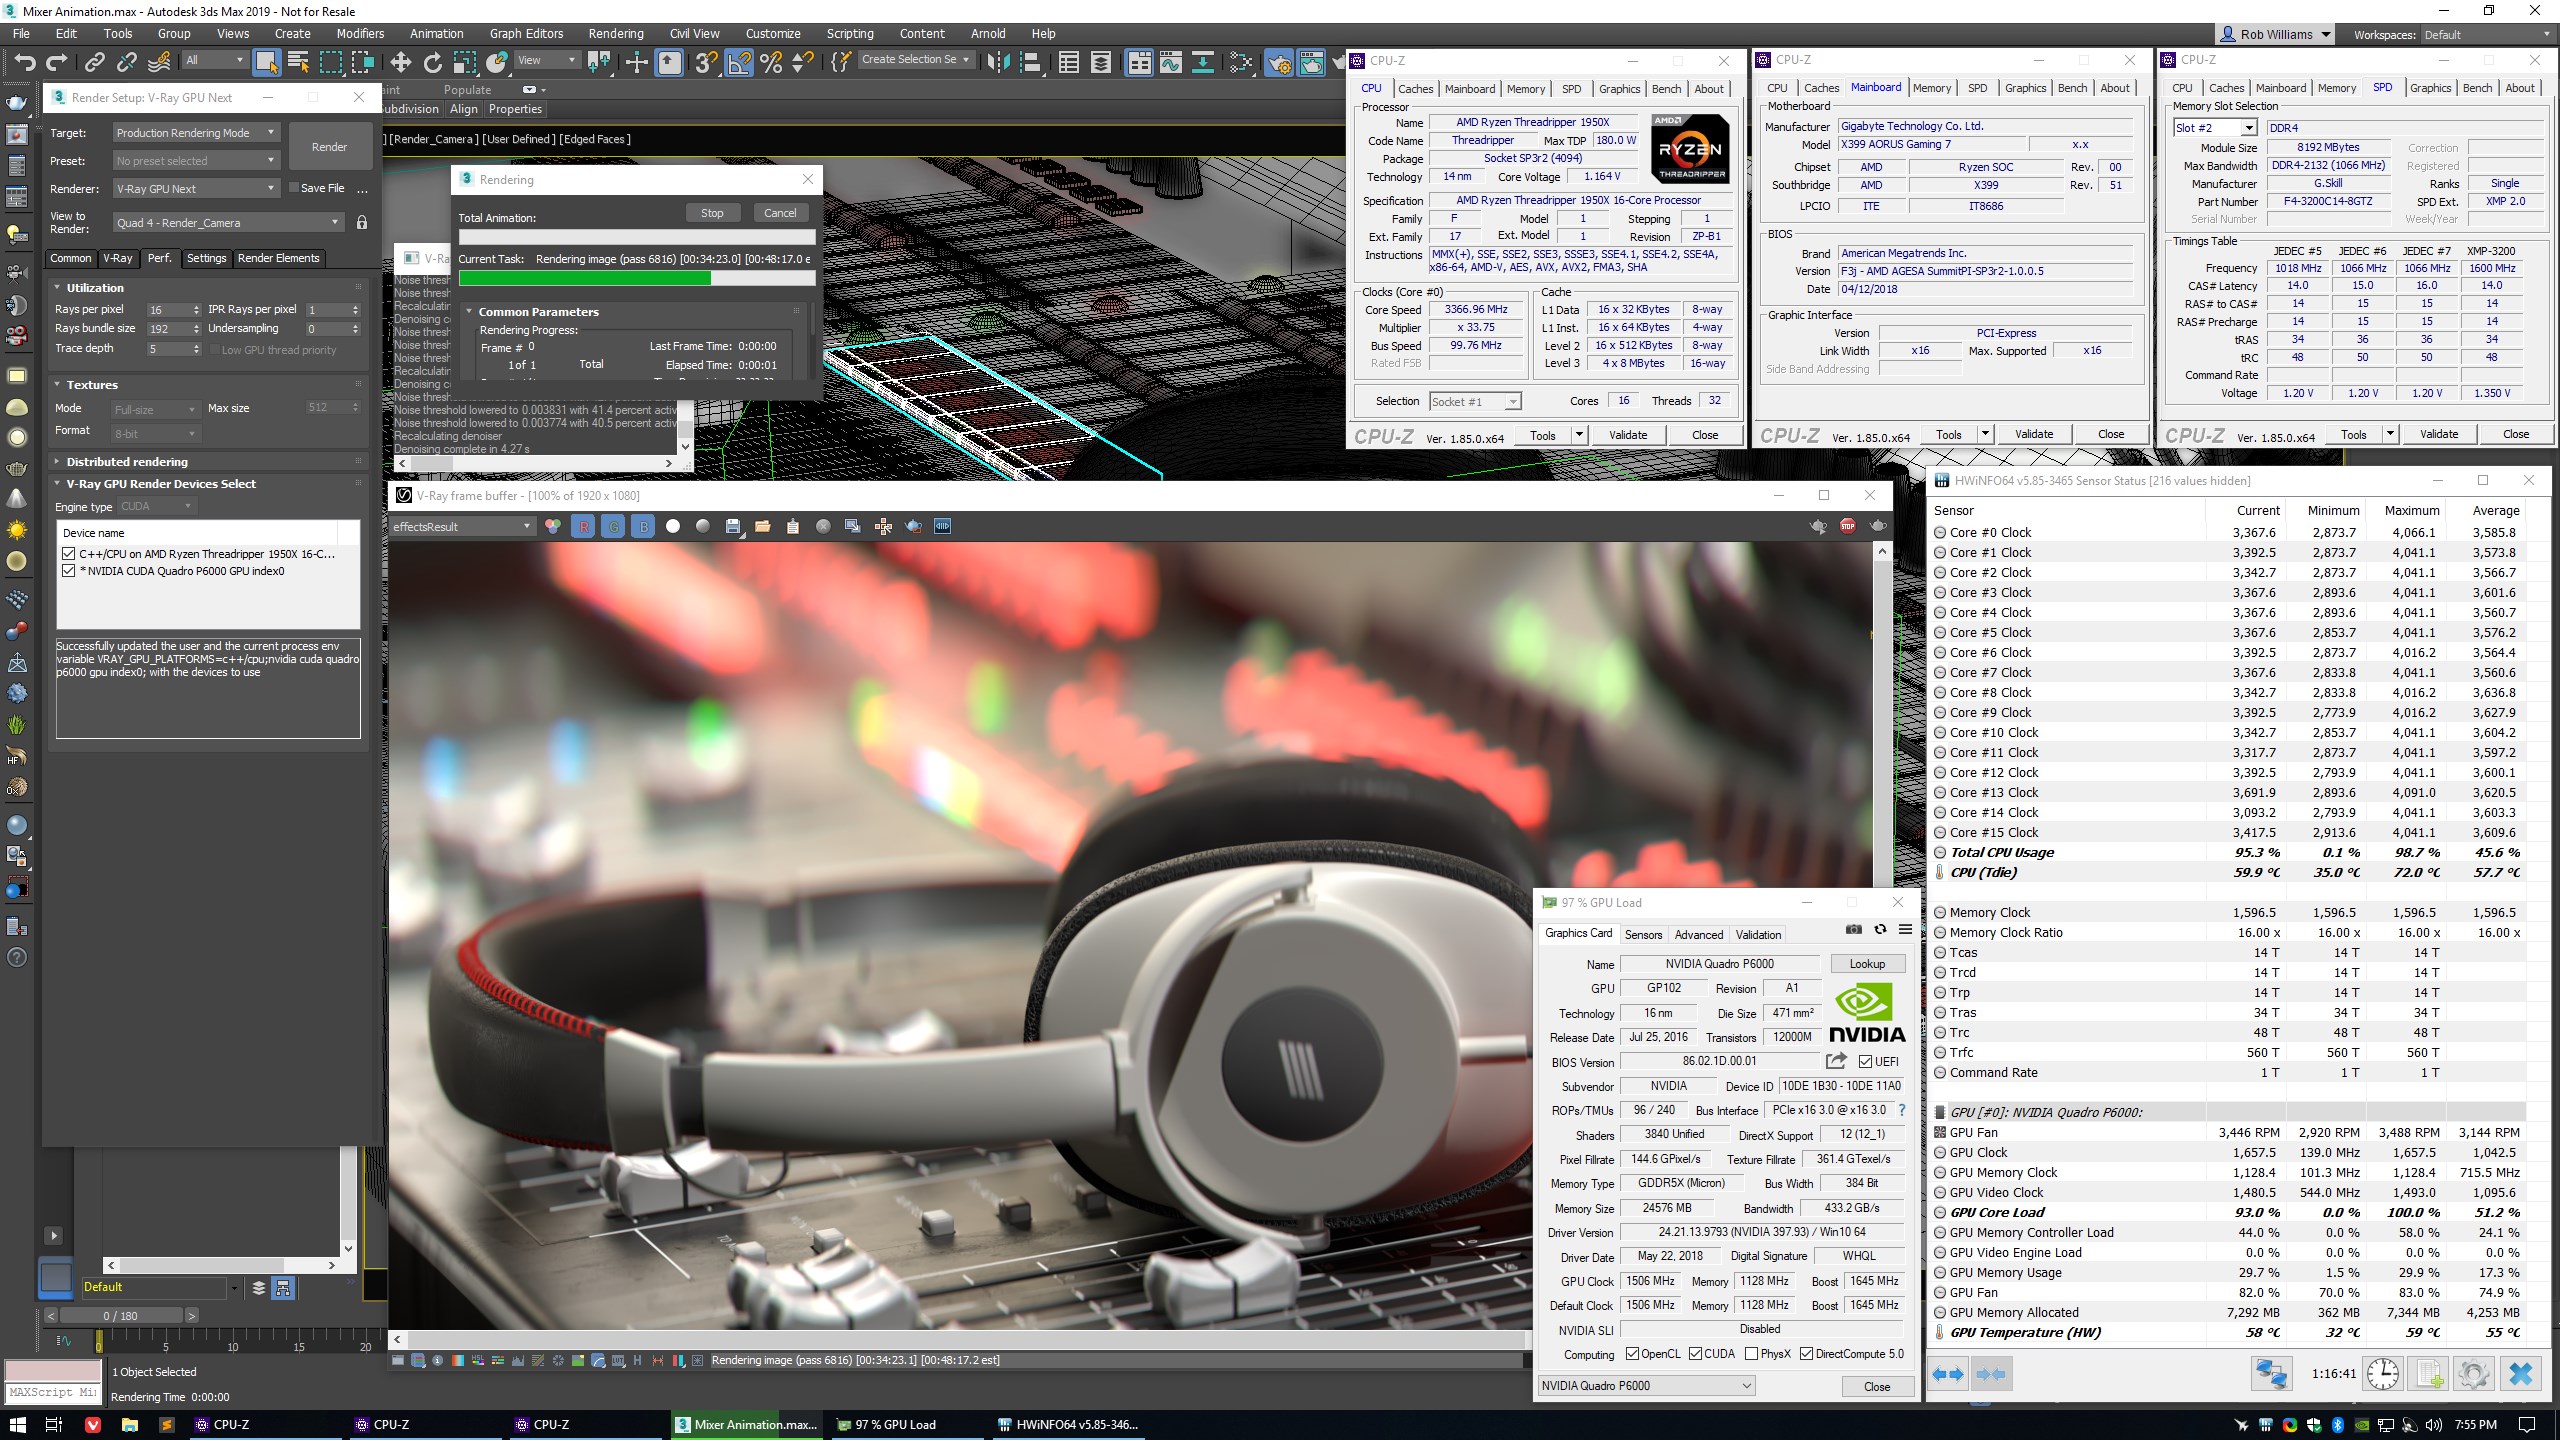
Our workstation test platforms (not “as tested”, but close)
To that end, this article is going to cover a wide-range of workstation scenarios. Some stress only the CPU, while others will stress only the GPU. Sometimes, both the CPU and GPU will be used together to accelerate the overall process. Scenarios covered here include the performance of viewports, rendering, encoding, and a little pinch of gaming for good measure.
How We Tested
Doing a comparison like this is challenging. It’s not as though we’re comparing a supercar to a station wagon; AMD and Intel are on the same playing field here. Both of these workstations are equipped with a 16-core CPU, and are cooled by a competent cooler (Enermax for AMD, NZXT for Intel). And, with what’s a true blessing, the G.SKILL memory used for testing is QVL certified for both of our motherboards, allowing us to use the same DRAM settings on both platforms.
On the topic of memory, our usual 64GB kit of Corsair memory is also QVL certified for both of these motherboards, but since none of our tests have ever been known to exceed 32GB of system memory, the G.SKILL kit made more sense for testing here. Zen benefits greatly from higher DRAM speeds, and DDR4-3200 should be sought out over slower speeds, if possible.
To keep this as real-world as possible, these workstations were tested from a stock EFI state, with the lone exception being the enabling of the DRAM profile. On the Intel machine, the ASUS motherboard asked for permission to engage core optimizations when the XMP profile was selected, which was accepted. This contrasts with how we would ordinarily do CPU-specific testing; the goal here is comparing workstation to workstation as normal users would use them. The GIGABYTE board in the Threadripper rig did not have the same kind of prompt.
| AMD TR4 Test Platform | |
| Processor | AMD Ryzen Threadripper 1950X (3.4GHz, 16C/32T) |
| Motherboard | GIGABYTE X399 AORUS Gaming 7 EFI: F3j (April 12, 2018) |
| Memory | G.SKILL TridentZ (4x8GB; DDR4-3200 14-14-14-34-1T) |
| Graphics | NVIDIA Quadro P6000 24GB (Quadro 397.93) |
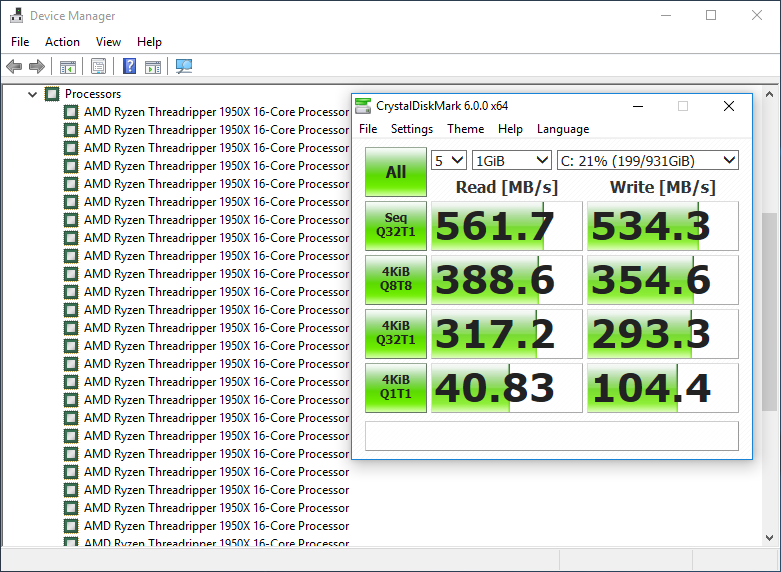
| Storage | WD Blue 3D NAND 1TB (SATA 6Gbps) |
| Power Supply | Enermax RevoBron 80+ Bronze (600W) |
| Chassis | Enermax Equilence |
| Cooling | Enermax Liqtech TR4 AIO (240mm) |
| Et cetera | Windows 10 Pro (Build 17134), Ubuntu 18.04 (4.15 kernel) |
| Intel LGA2011-3 Test Platform | |
| Processors | Intel Core i9-7960X (2.8GHz, 16C/32T) |
| Motherboard | ASUS ROG STRIX X299-E GAMING EFI: 1401 (May 21, 2018) |
| Memory | G.SKILL TridentZ (4x8GB; DDR4-3200 14-14-14-34-1T) |
| Graphics | NVIDIA Quadro P6000 24GB (Quadro 397.93) |
| Storage | WD Blue 3D NAND 1TB (SATA 6Gbps) |
| Power Supply | Corsair Professional Series Gold AX1200 (1200W) |
| Chassis | Corsair Carbide 600C |
| Cooling | NZXT Kraken X62 AIO (280mm) |
| Et cetera | Windows 10 Pro (Build 17134), Ubuntu 18.04 (4.15 kernel) |
The more I look over these specs, the more I realize that this is one of the fairest match-ups we’ve ever been able to put together. Usually, the DRAM would ruin the fun by needing to be run at different speeds on each platform, but that’s not the case here. Core counts are the same, and the same GPU is used. This is apples-to-apples benchmarking of workstations that would crush an Apple. I mean, it’s only fruit.
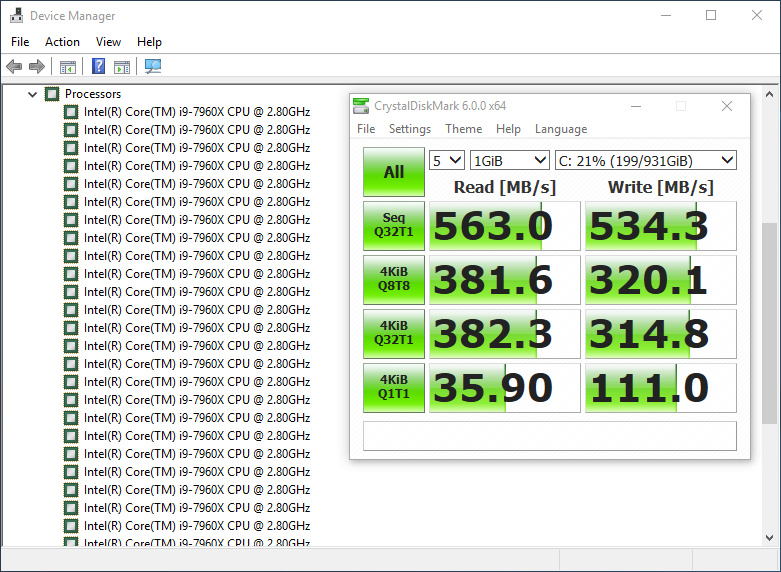
If there’s one thing I’d change about these rigs, it’d be moving the SSDs to M.2. The SATA-based drives were used for the simple fact that I could keep two rigs up and running using the same model SSD, which is preferable to reimaging the OS all of the time, especially given how much retesting tends to take place with this kind of benchmarking. I’ve done thorough testing of M.2 vs. SATA for our internal reference in the past, and haven’t seen proof that M.2 would make a notable difference. Ultimately, what’s important is that the SSD model used between these rigs was the same.
All testing was completed at least twice on each platform, and then a third time when performance deltas (or scaling) between the first two runs was too unusual to accept. If you see a result here that seems unusual, chances are good that it felt unusual to me as well, and was retested to triple or quadruple check the result.
Viewport Performance
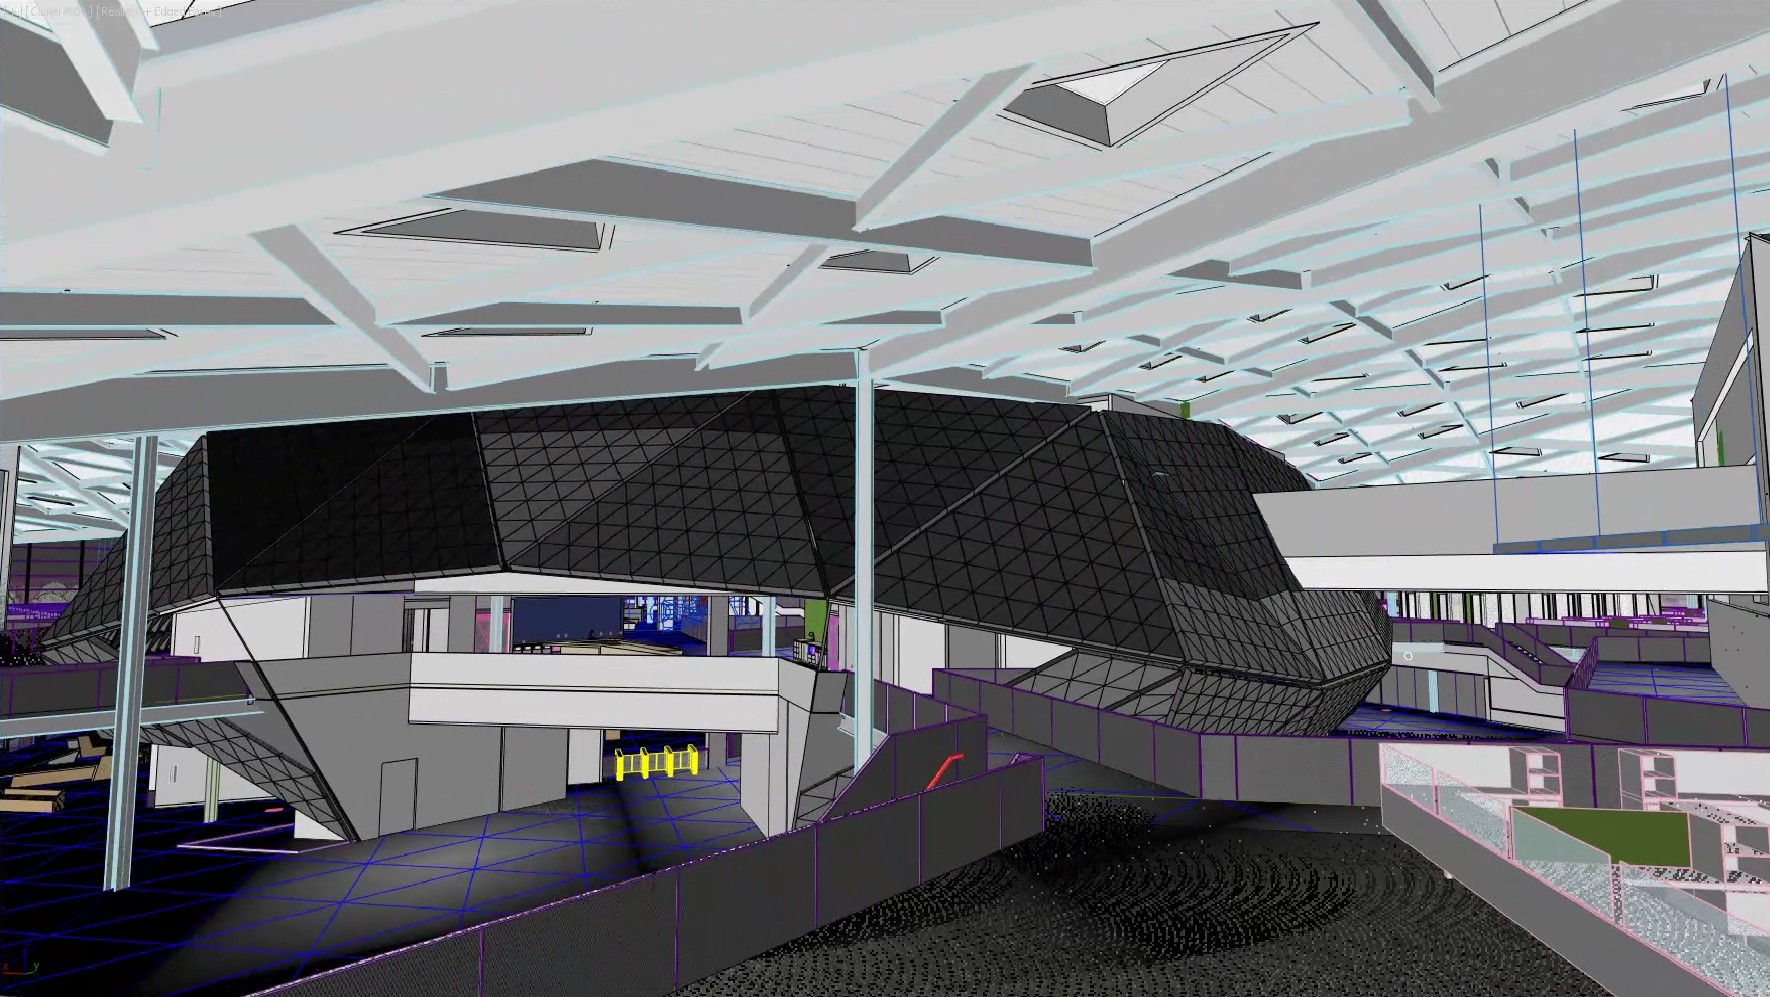

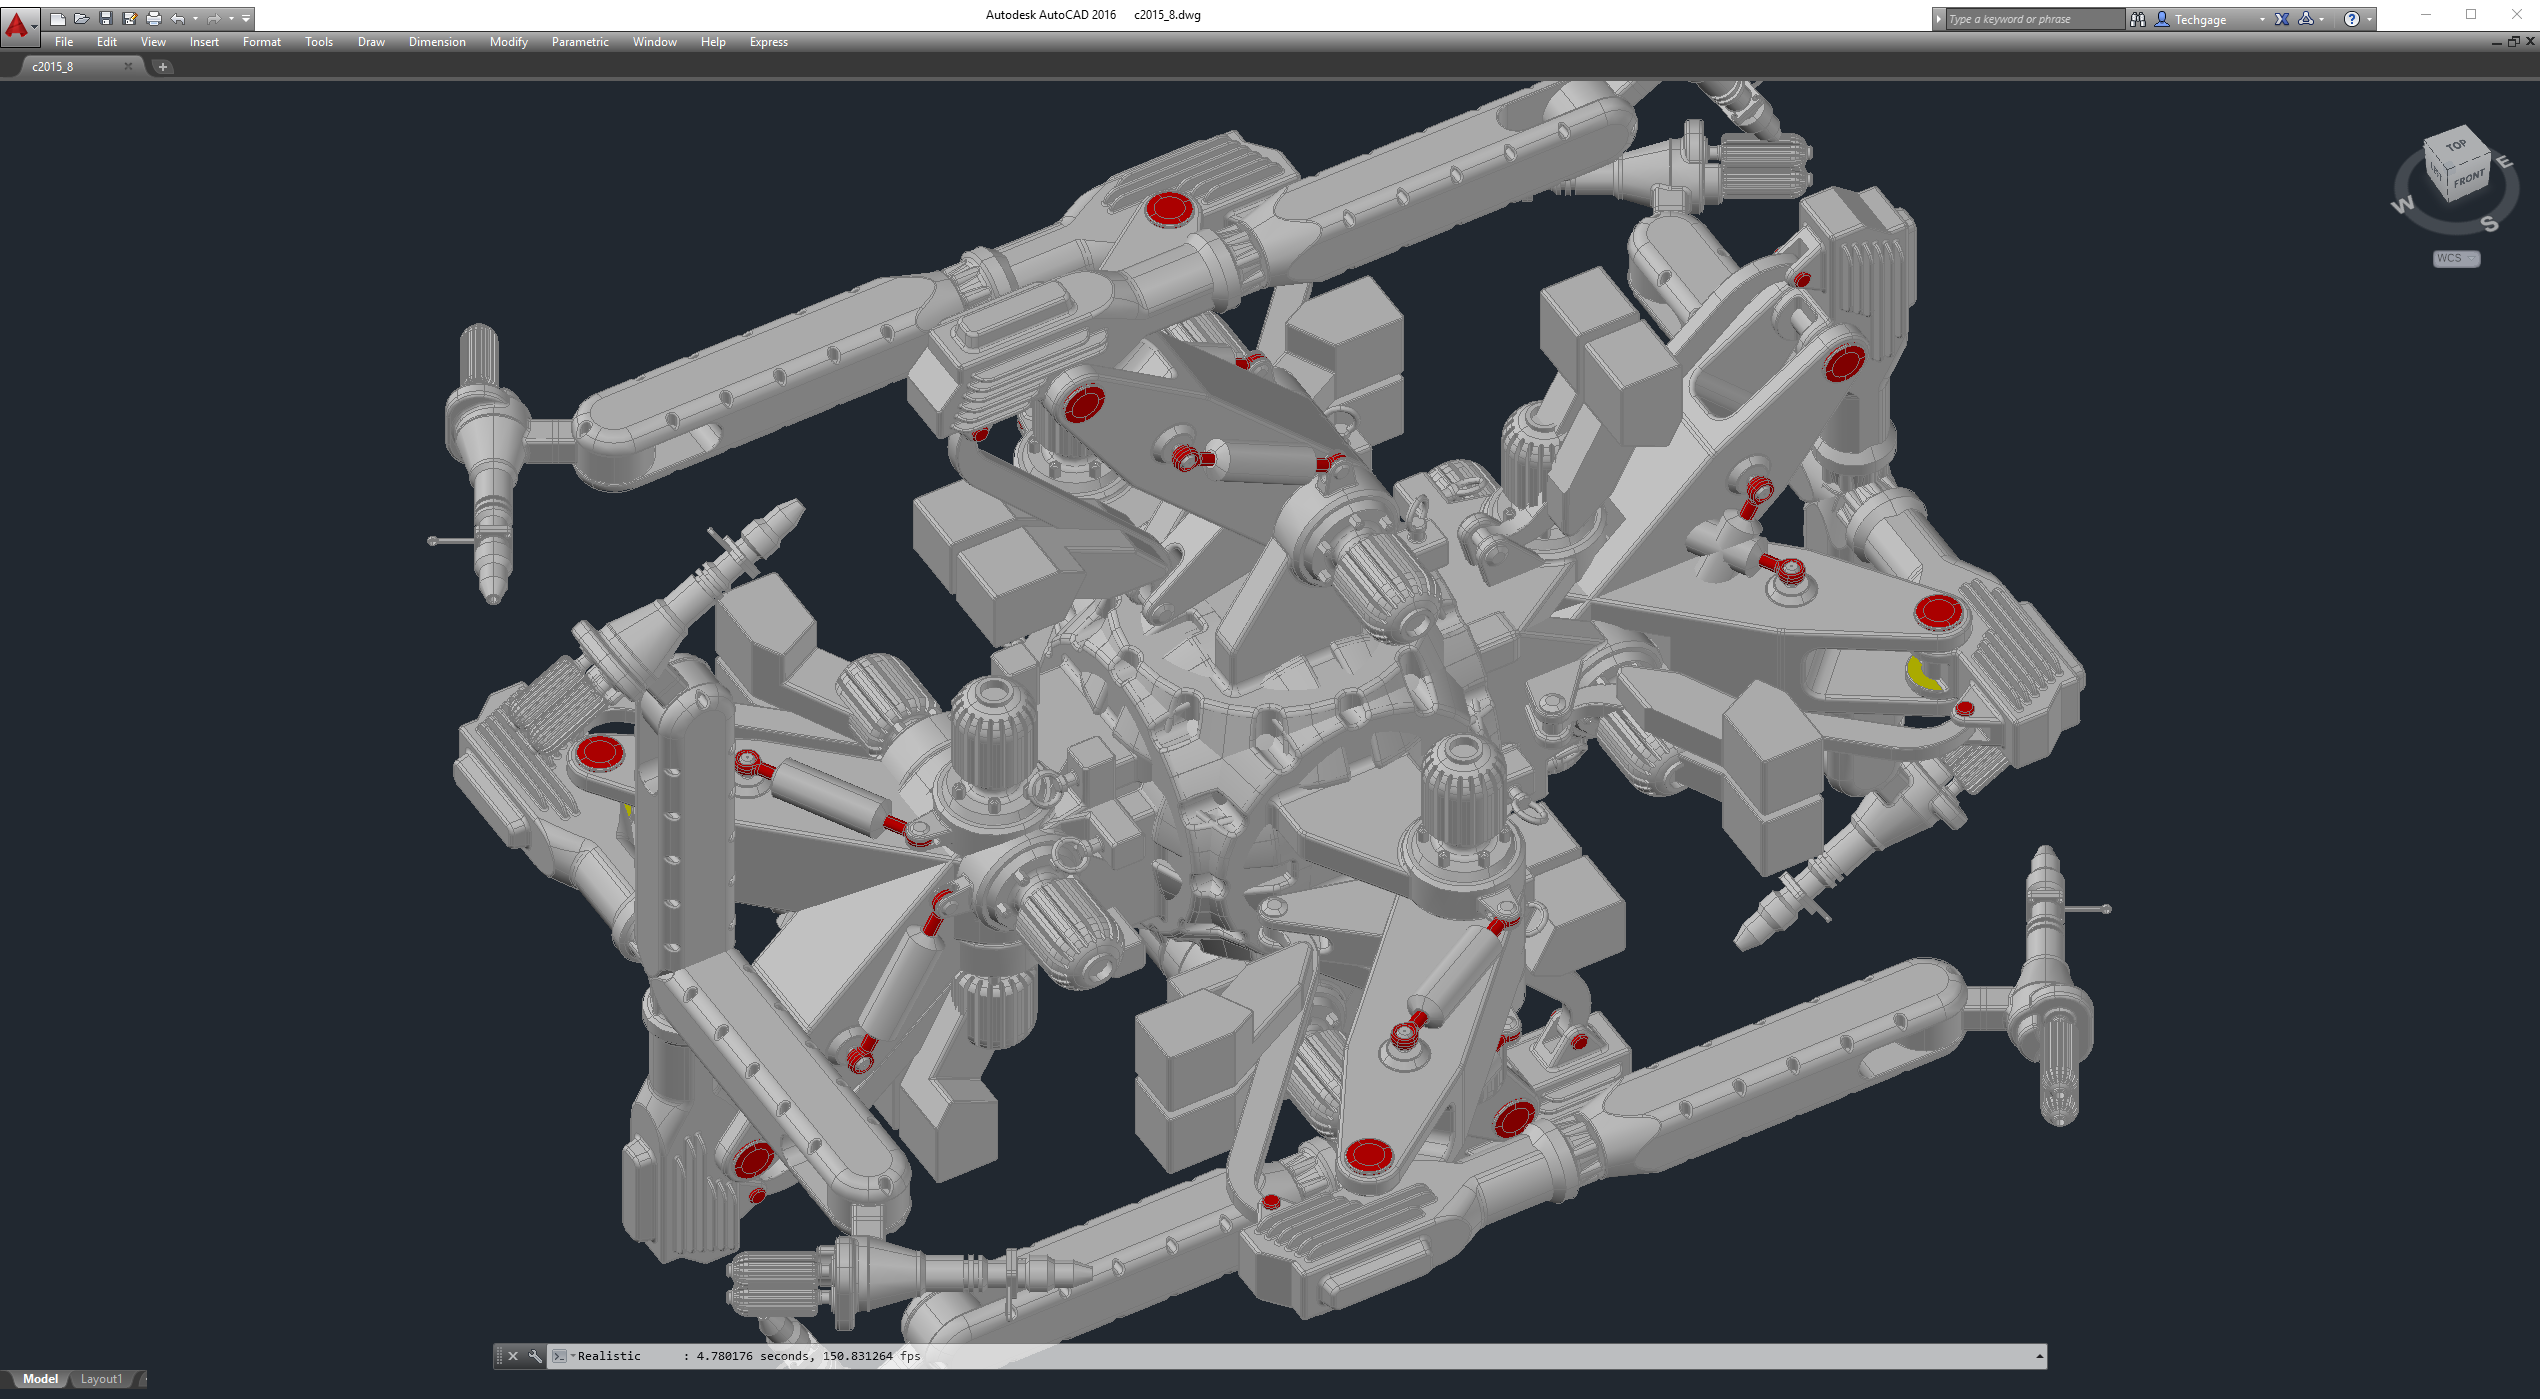


We took an in-depth look at viewport performance last week, focusing entirely on the graphics card. Ultimately, it is the graphics card that matters most with this kind of performance, but if the CPU is slow, or has some other quirk, it could impact the workload in unexpected ways. Fortunately, we will be able to see some obvious differences from the results below. Because the results here are quite simple – comparing just one to the other – I’ll tackle each one in an abbreviated manner.


 - AMD vs Intel Workstation Performance)
Autodesk software seems to favor the higher IPC performance of Intel’s processor, but at the same time, AMD managed to strike back and overtake the blue team in some cases. It even managed to come ahead of Intel in the 3ds Max test, which runs at 1080p. There’s another 3ds Max result later, looked at from a different angle, so we’ll see if this performance scaling persists.
In AutoCAD, Intel didn’t only deliver better CPU performance, it also brought about improved GPU performance. That seems odd, but it’s not the first time I’ve seen this kind of behavior. For AutoCAD, Intel is the go-to; for the others, AMD fares just fine.


I mentioned at the outset that if your workload is heavily GPU-dependant, then the platform surrounding it might not matter too much. It clearly can matter to some degree, though, as Intel places ahead of AMD quite comfortably in both CATIA and SolidWorks. AMD’s performance isn’t exactly lacking, though, with its 4K performance matching up nicely against Intel’s.

AMD has struggled in some of the apps up to this point, but not in Siemens NX. In fact, it managed to outperform Intel at both resolutions.

In our deep look at SPECviewperf 13 last week, I hit a bit of a roadblock with PTC’s Creo test. For some reason, driver performance almost stalled on Polaris-based Radeon cards, leading me to have to retest every one of those again using different drivers. I almost held my breath when time came to test Creo for this article, but all is well. Both AMD and Intel swap places at the different resolutions, and again, this is the result of multiple test runs. I totally understand the “HOW?” you’re shouting in your head.


Wrapping-up the viewport tests with Medical and Energy, we see pretty equal scaling here. The GPU clearly contributes a lot more in these tests than the CPU does.

Support our efforts! With ad revenue at an all-time low for written websites, we're relying more than ever on reader support to help us continue putting so much effort into this type of content. You can support us by becoming a Patron, or by using our Amazon shopping affiliate links listed through our articles. Thanks for your support!

Rob Williams
Rob founded Techgage in 2005 to be an 'Advocate of the consumer', focusing on fair reviews and keeping people apprised of news in the tech world. Catering to both enthusiasts and businesses alike; from desktop gaming to professional workstations, and all the supporting software.


