- Qualcomm Launches Snapdragon 4 Gen 2 Mobile Platform
- AMD Launches Ryzen PRO 7000 Series Mobile & Desktop Platform
- Intel Launches Sleek Single-Slot Arc Pro A60 Workstation Graphics Card
- NVIDIA Announces Latest Ada Lovelace Additions: GeForce RTX 4060 Ti & RTX 4060
- Maxon Redshift With AMD Radeon GPU Rendering Support Now Available
Ryzen For The Masses: A Look At AMD’s Ryzen 5 1600X & 1500X Processors
With our Ryzen 7 review, we found that AMD had released three powerhouse CPUs, chips able to do proper battle against the competition – and in many cases, win. Now, we have Ryzen 5. Will we see the same kind of bang-for-the-buck with these chips as we did with Ryzen 7? Obviously, there’s only one way to find out!
Page 2 – Test Systems & Methodologies
Benchmarking a CPU might sound like a simple enough task, but in order to deliver accurate, repeatable results, and not to mention results that don’t favor one vendor over another, strict guidelines need to be adhered to. That in turn makes for rigorous, time-consuming testing, but we feel that the effort is worth it.
This page exists so that we can be open about how we test, and give those who care about testing procedures an opportunity to review our methodology before flaming us in the comments. Here, you can see a breakdown of all of our test machines, specifics about the tests themselves, and other general information that might prove useful.
We’ll start with a look at our test platforms, for AMD’s AM4, and Intel’s LGA 1151.
Techgage’s CPU Testing Platforms
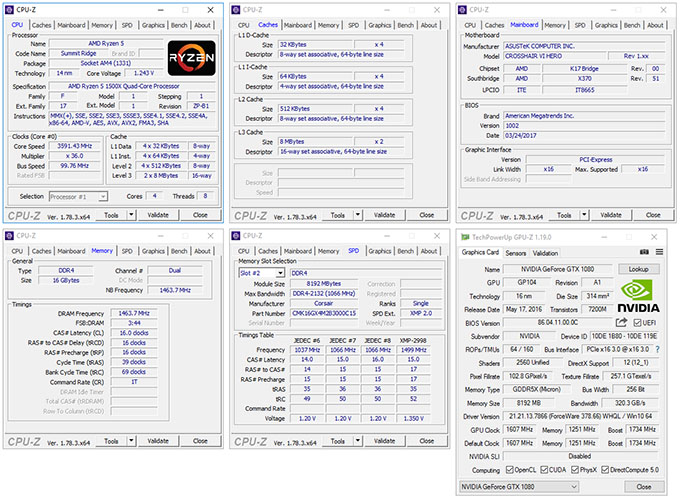
| AMD AM4 Test Platform | |
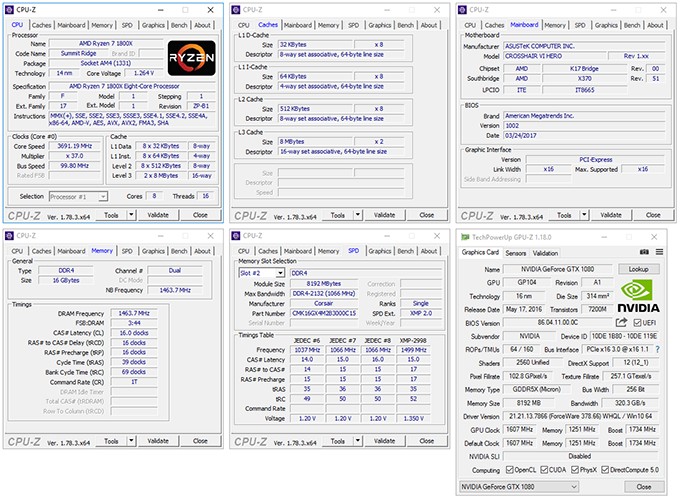
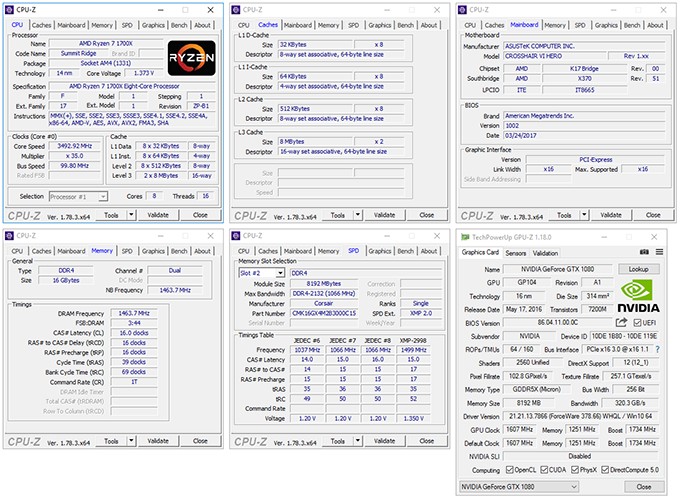
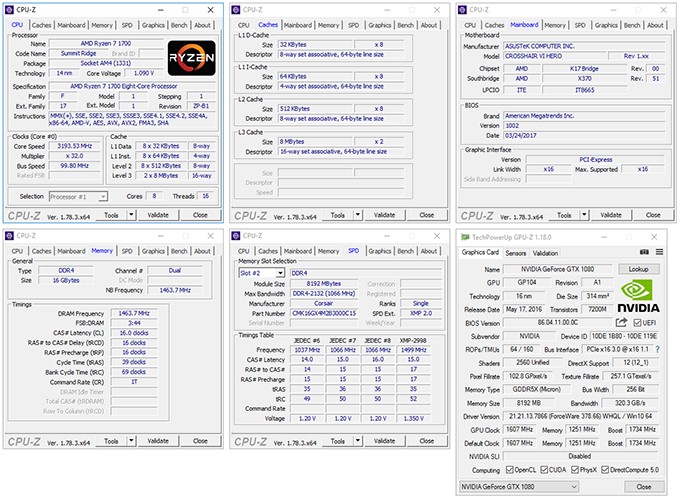
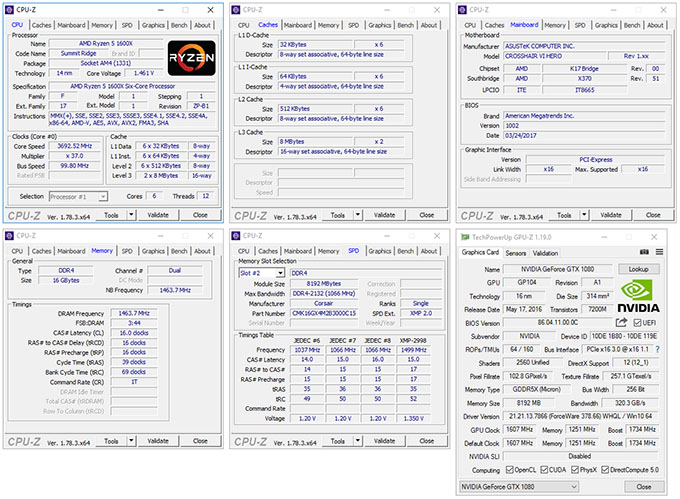
| Processors | AMD Ryzen 7 1800X (3.6GHz, 8C/16T) AMD Ryzen 7 1700X (3.4GHz, 8C/16T) AMD Ryzen 7 1700 (3.0GHz, 8C/16T) AMD Ryzen 7 1600X (3.6GHz, 6C/12T) AMD Ryzen 7 1500X (3.5GHz, 4C/8T) |
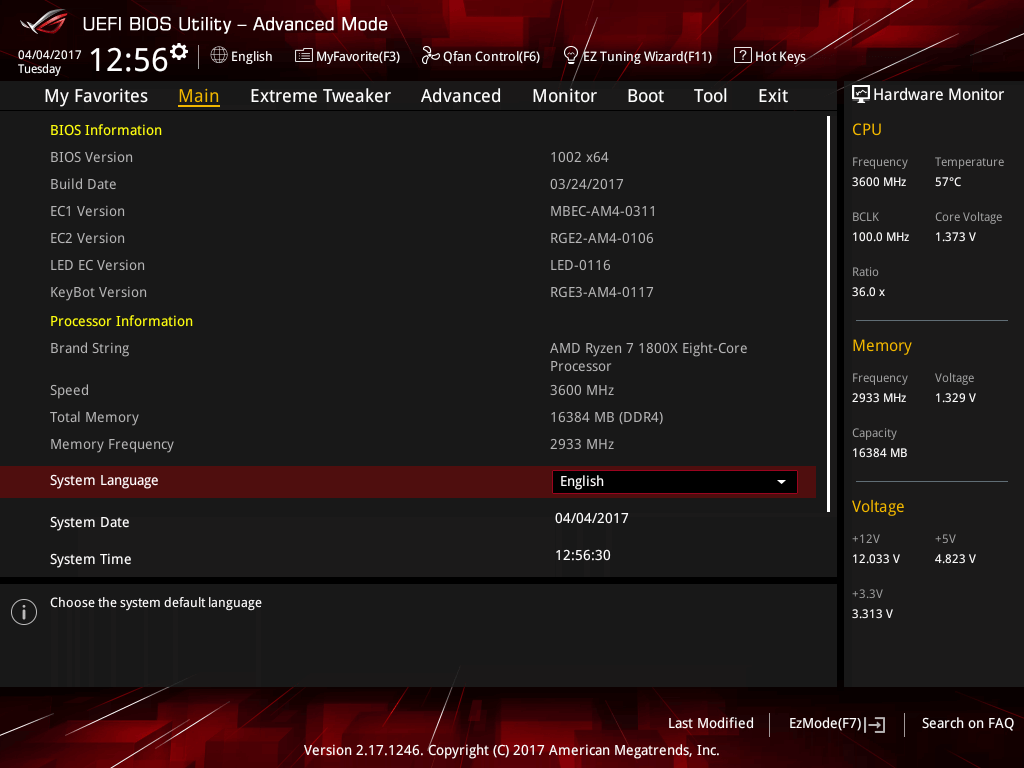
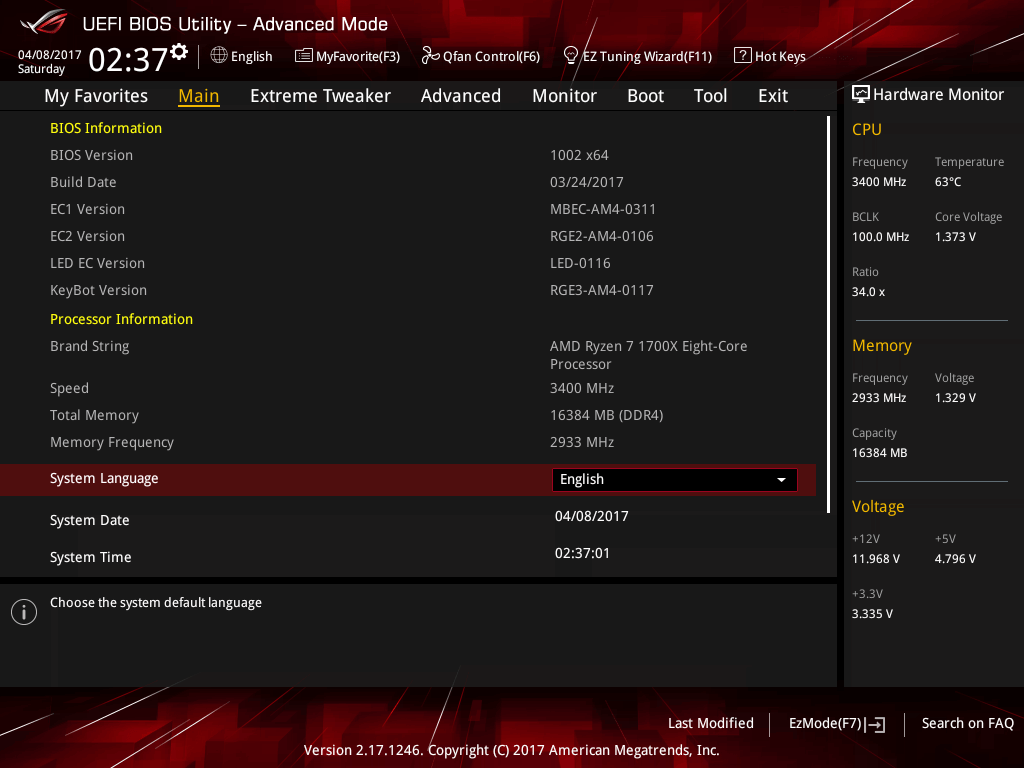
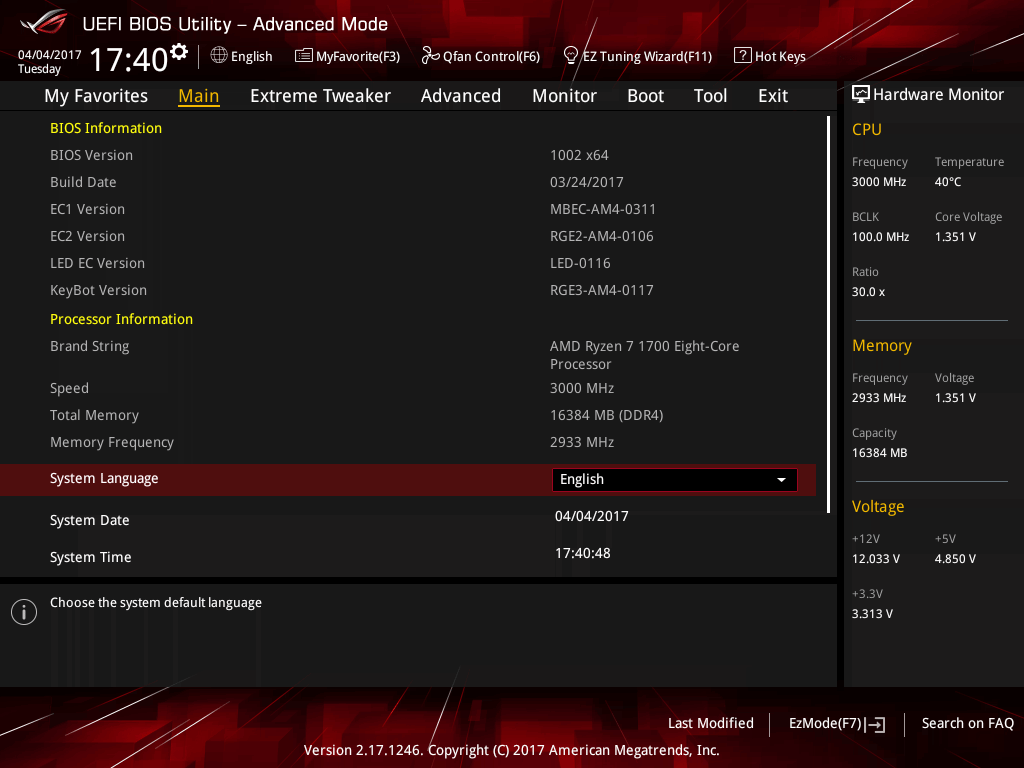
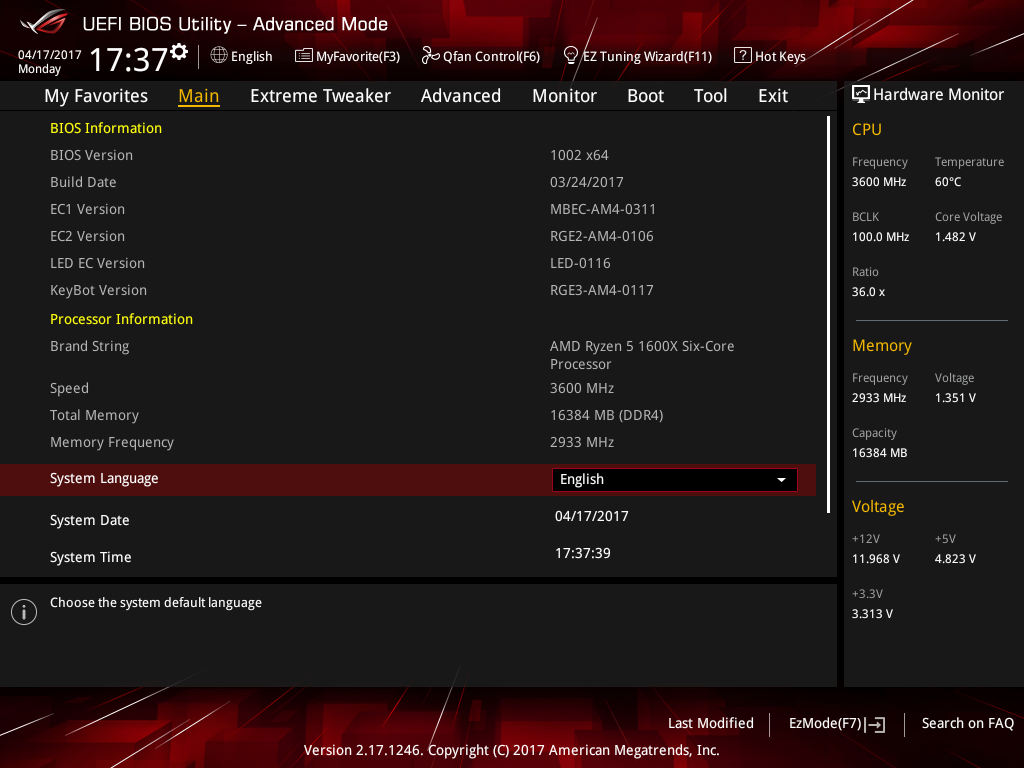
| Motherboard | ASUS CROSSHAIR VI HERO All CPUs tested with BIOS 1002 (Mar 29, 2017) |
| Memory | Corsair VENGEANCE LPX (CMK16GX4M2B3000C15) 8GB x 2 Operates at DDR4-2933 16-16-16-39 (1.35V) |
| Graphics | NVIDIA GeForce GTX 1080 (8GB; GeForce 378.66) |
| Storage | Crucial MX300 525GB (SATA 6Gbps) |
| Power Supply | Corsair Professional Series Gold AX1200 (1200W) |
| Chassis | Corsair Obsidian 800D |
| Cooling | Noctua NH-U12S SE-AM4 (1x 120mm Fan) |
| Et cetera | Windows 10 Pro (Build 14393) |
ASUS’ CROSSHAIR VI HERO makes it easy to attain a proper “stock” setup, even when increasing the default DRAM speed to 2933MHz. That’s a bit of a relief, as some ASUS boards automatically overclock the processor after changing absolutely anything performance-related – something that would have caused an issue here.
While DDR4-2800 was used across both Intel platforms, the same frequency couldn’t be used on the AM4 platform without skewing the CPU clock. Rather than back the speed down to DDR4-2666MHz, 2933MHz seemed like the better bet. That means the AM4 platform inherently gains a bandwidth boost, but it comes at the expense of the latencies, as the 14-14-14 timings used on both Intel platforms could not be used with either of the two DRAM kits AMD sent us for our Ryzen testing.
Also, I should point out that unlike the Intel systems, this AM4 one uses an air cooler. This is because a bracket wasn’t available for any cooler we have on hand. Thus, the decision was made for us to use the air cooler that AMD provided. We’ll be retesting all of Ryzen over in the near-future once we can liquid cool it.
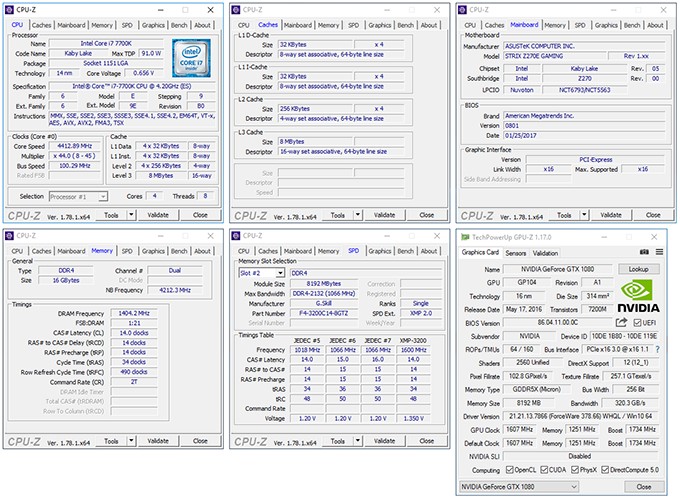
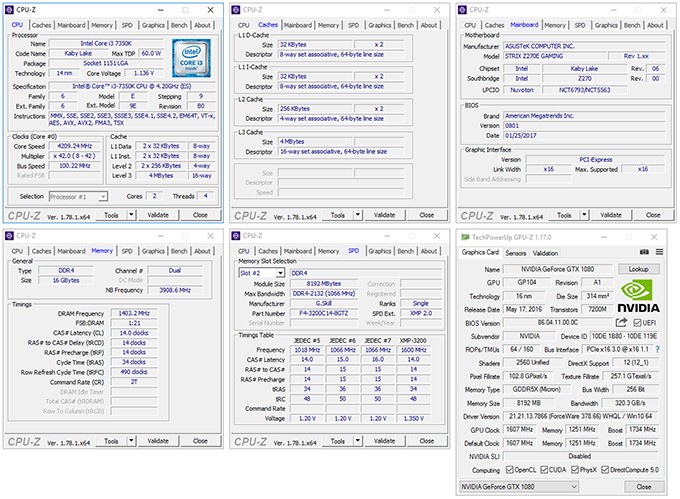
| Intel LGA1151 Test Platform | |
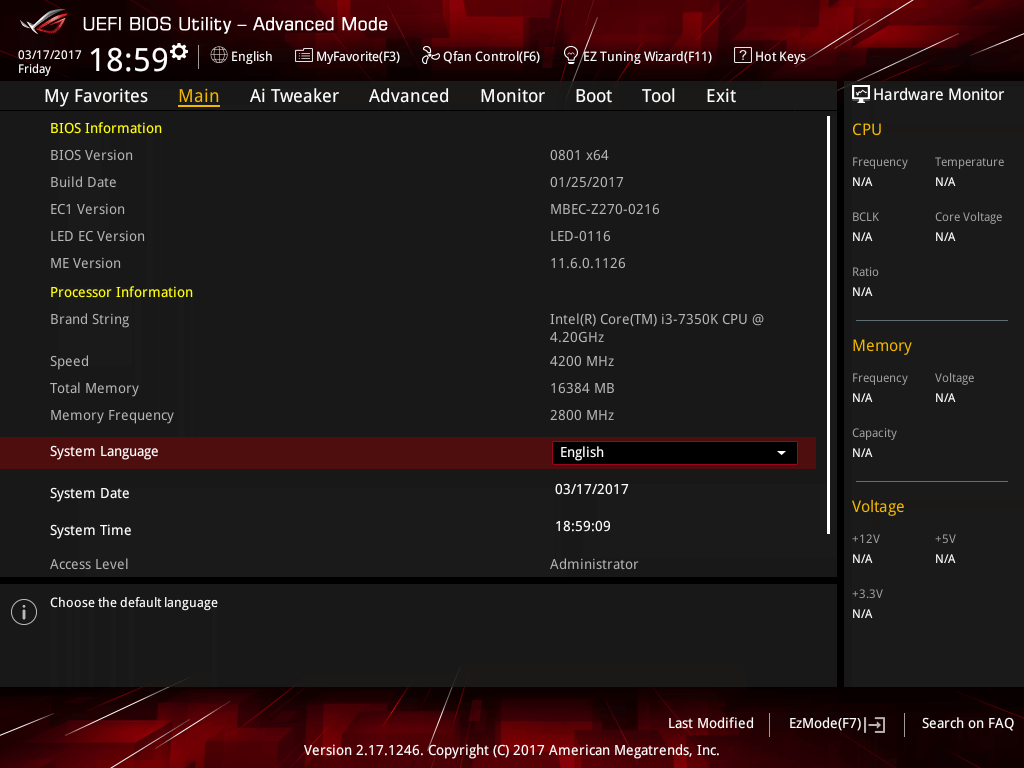
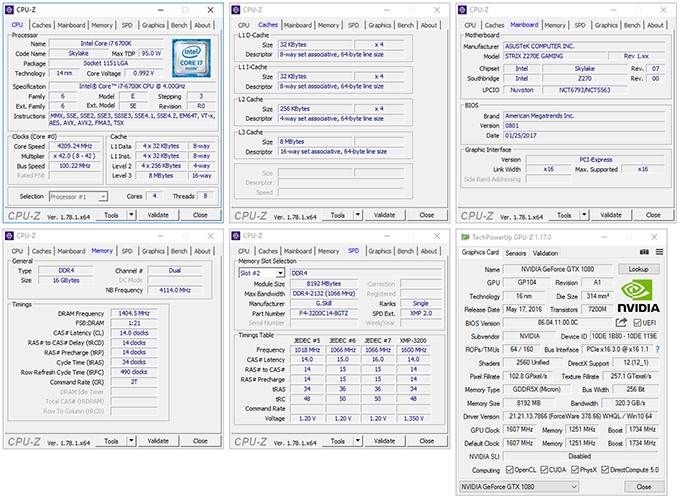
| Processors | Intel Core i7-7700K (4.2GHz, 4C/8T) Intel Core i3-7350K (4.2GHz, 2C/4T) Intel Core i7-6700K (4.0GHz, 4C/8T) |
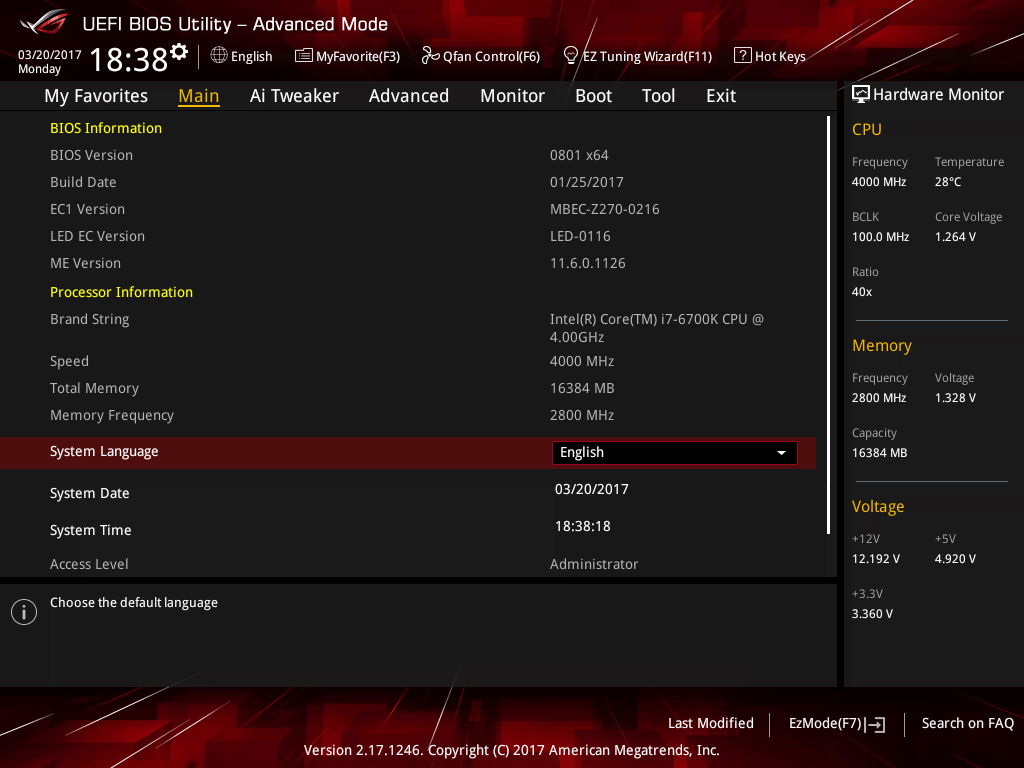
| Motherboard | ASUS ROG STRIX Z270E Gaming All CPUs tested with BIOS 0801 (Feb 09, 2017) |
| Memory | G.SKILL TridentZ (F4-3200C14-8GTZ) 8GB x 4 Operates at DDR4-2800 14-14-14-34 (1.35V) |
| Graphics | NVIDIA GeForce GTX 1080 (8GB; GeForce 378.66) |
| Storage | Crucial MX300 525GB (SATA 6Gbps) |
| Power Supply | Corsair Professional Series Gold AX1200 (1200W) |
| Chassis | Corsair Obsidian 800D |
| Cooling | Corsair Hydro H100i v2 (2x 120mm Fan) |
| Et cetera | Windows 10 Pro (Build 14393) |
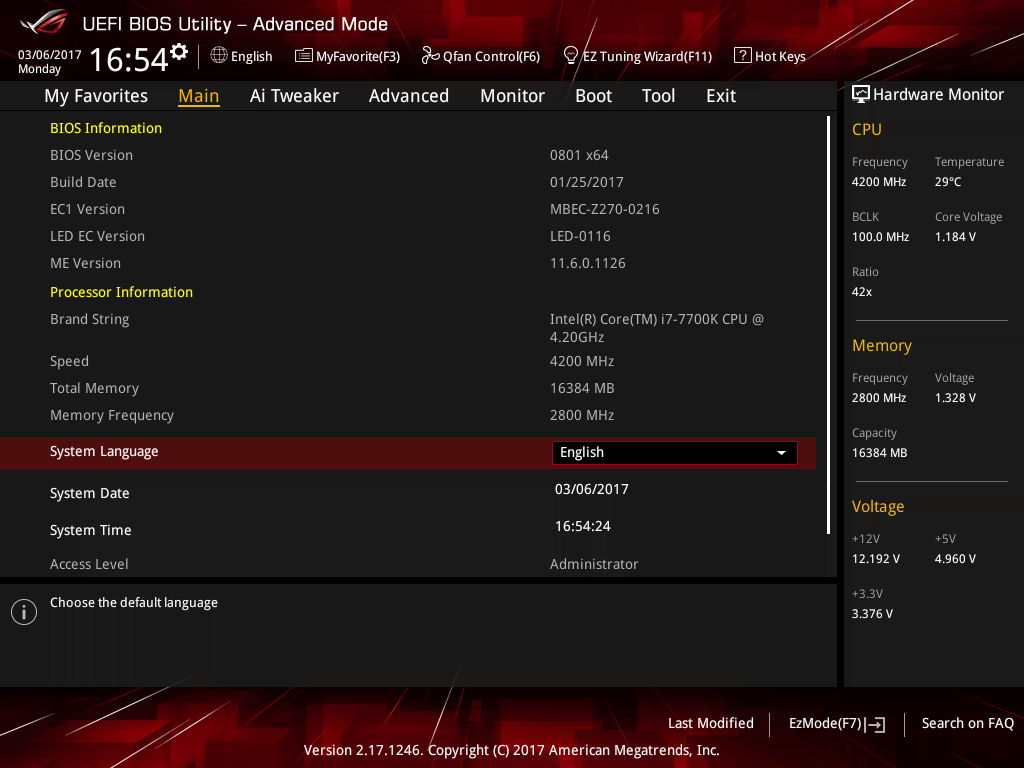
ASUS’ ROG STRIX 270E Gaming is a fantastic motherboard with a long name, but it complicates out-of-the-box testing by defaulting its Ai Overclock Tuner setting to “Sync All Cores”, which ultimately runs the CPU faster than actual stock, giving the 7700K a 30 cb boost in Cinebench (+3%).
To get around this, after the DRAM speed and timings are configured, the Ai Overclock Tuner setting is switched to Auto, negating that out-of-the-box performance boost.
Windows Benchmarks
For the bulk of our testing, we use Windows 10 build 14393 with full updates as the base. After installation, LAN, audio, and chipset drivers are installed even if they are not explicitly needed (because Windows can use generic driver versions). Our basic guidelines beyond that are:
- Everything is disabled in “Customize settings” during OS install.
- 3D Vision and GeForce Experience are not installed with the graphics driver.
- V-SYNC is disabled in NVIDIA’s Control Panel.
- Some services are disabled: search, User Account Control, Firewall, and Defender.
- The OneDrive app is changed to not start with Windows.
- The “Performance” power profile is used, with screen timeouts disabled.
- All notifications are disabled through the Settings screen.
- Desktop resolution is run at 2560×1440.
- Testing doesn’t begin until the PC is idle (keeps a steady minimum wattage).
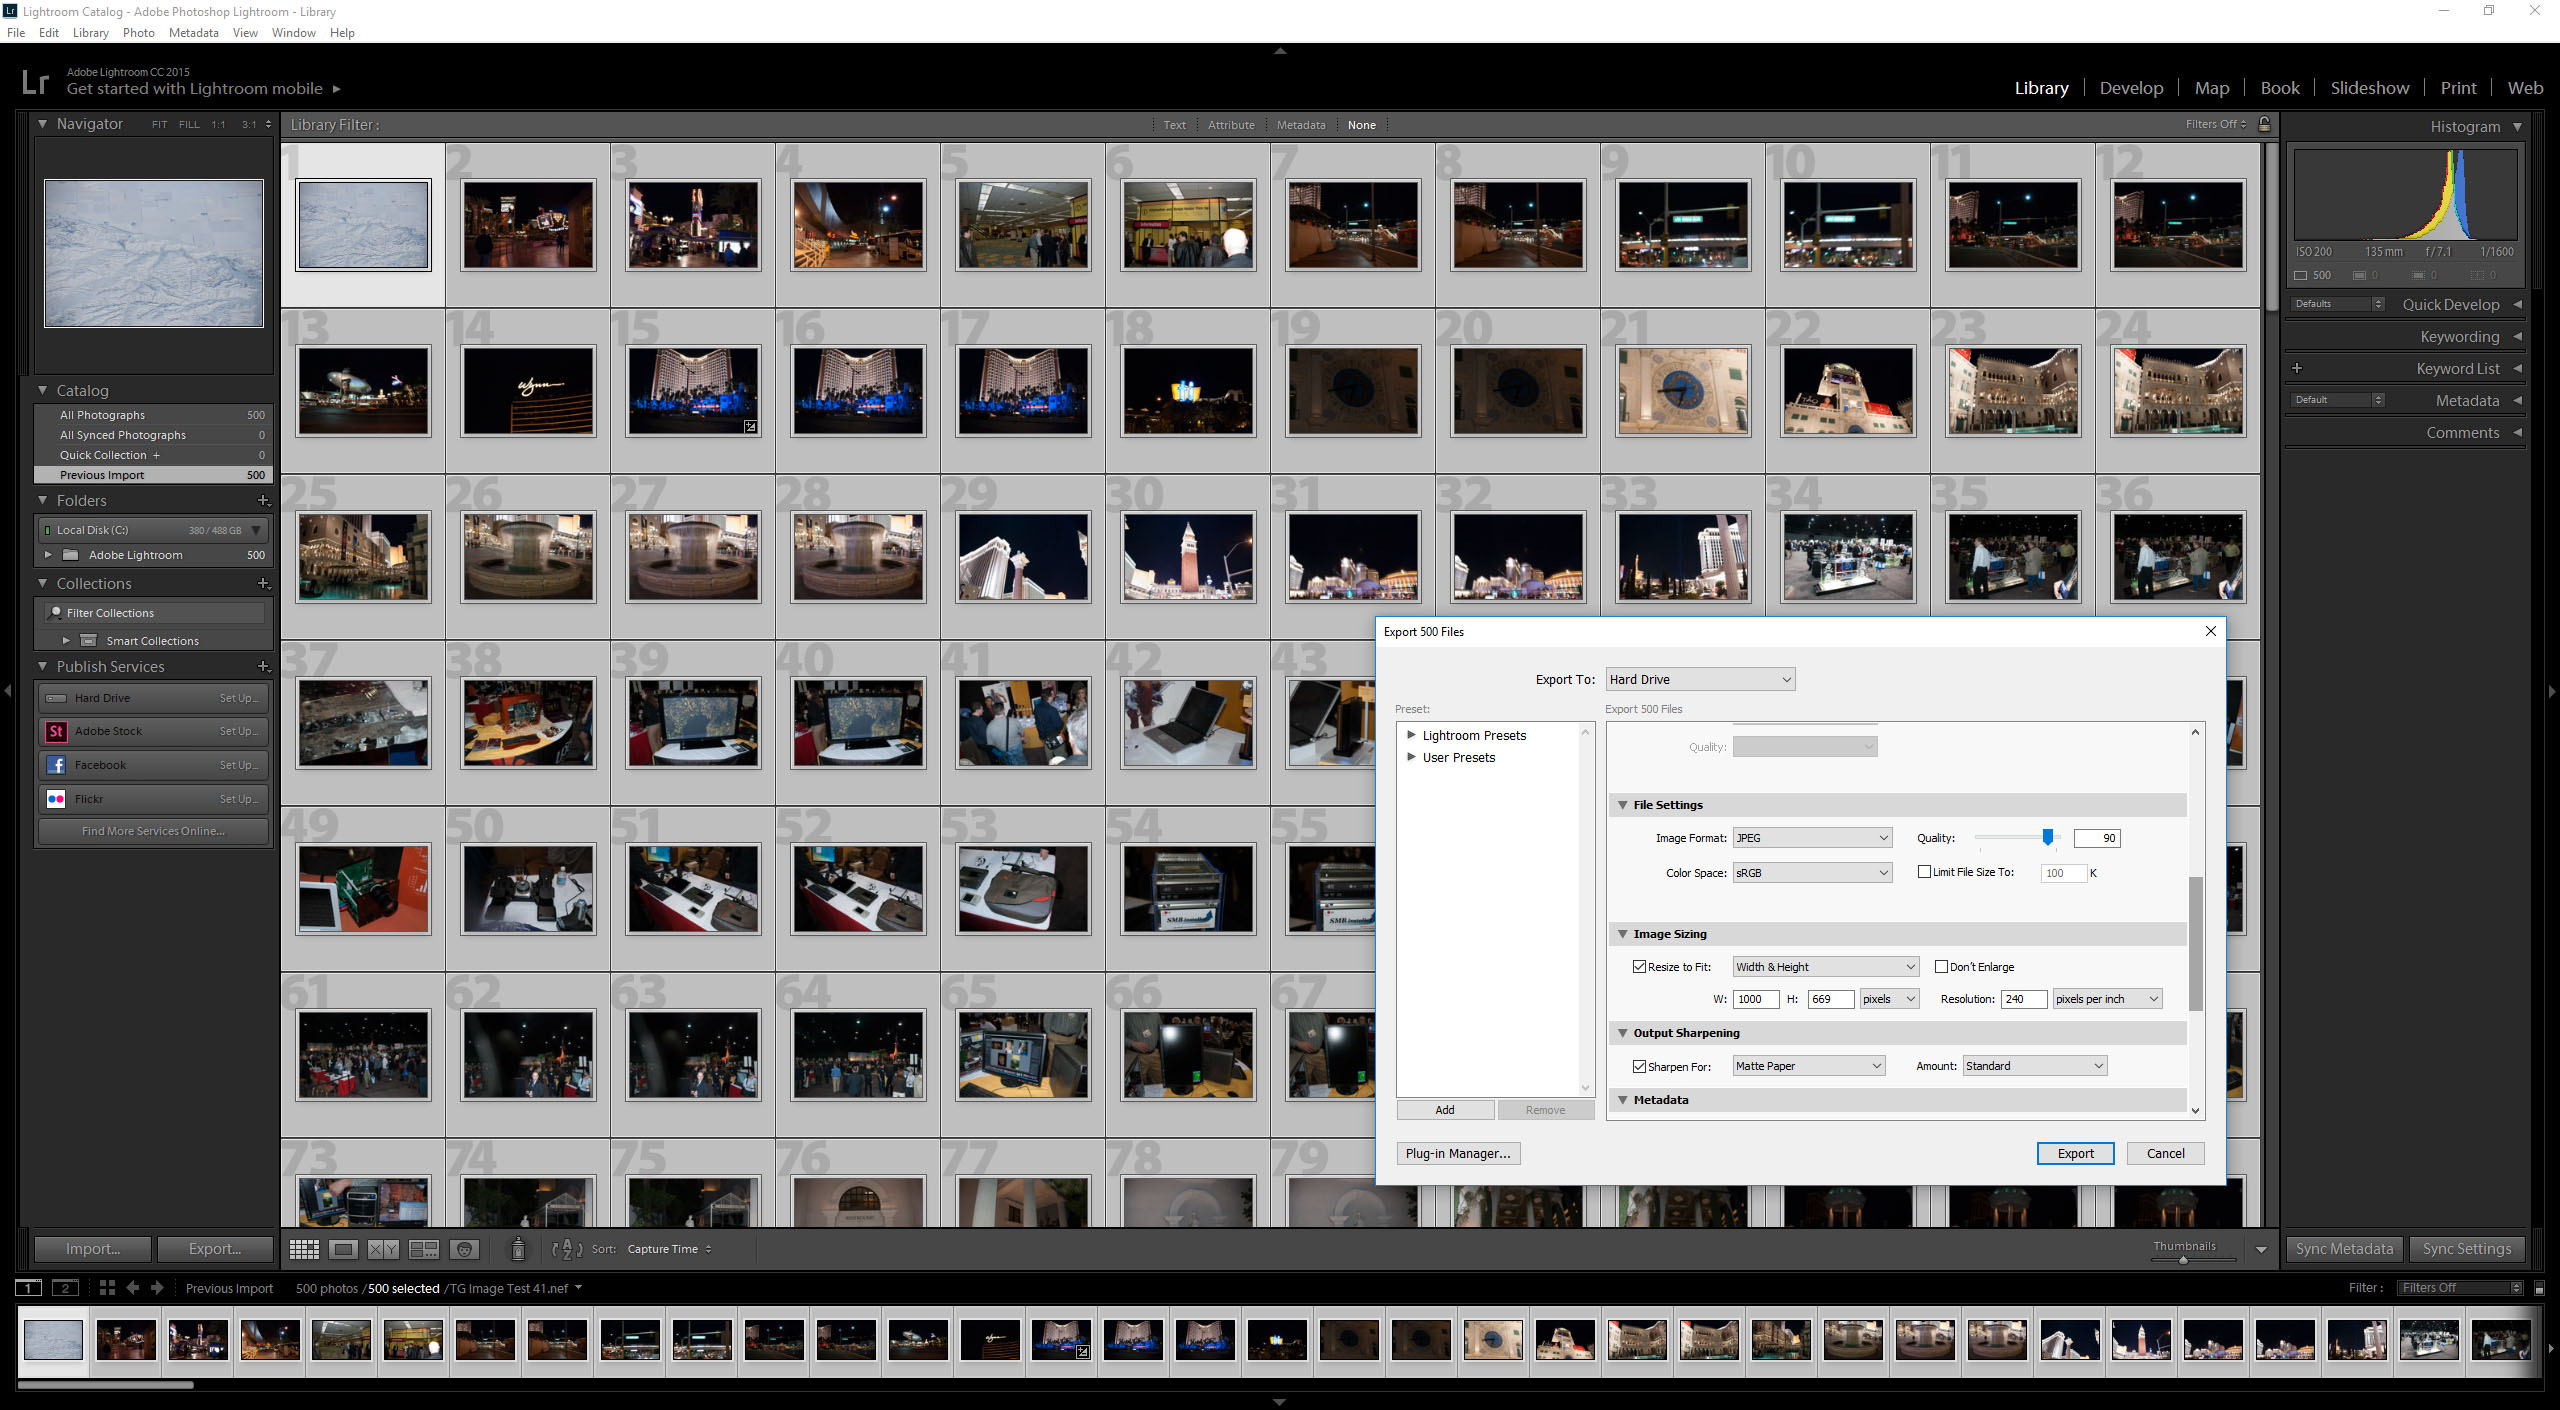
- Media: Adobe Lightroom
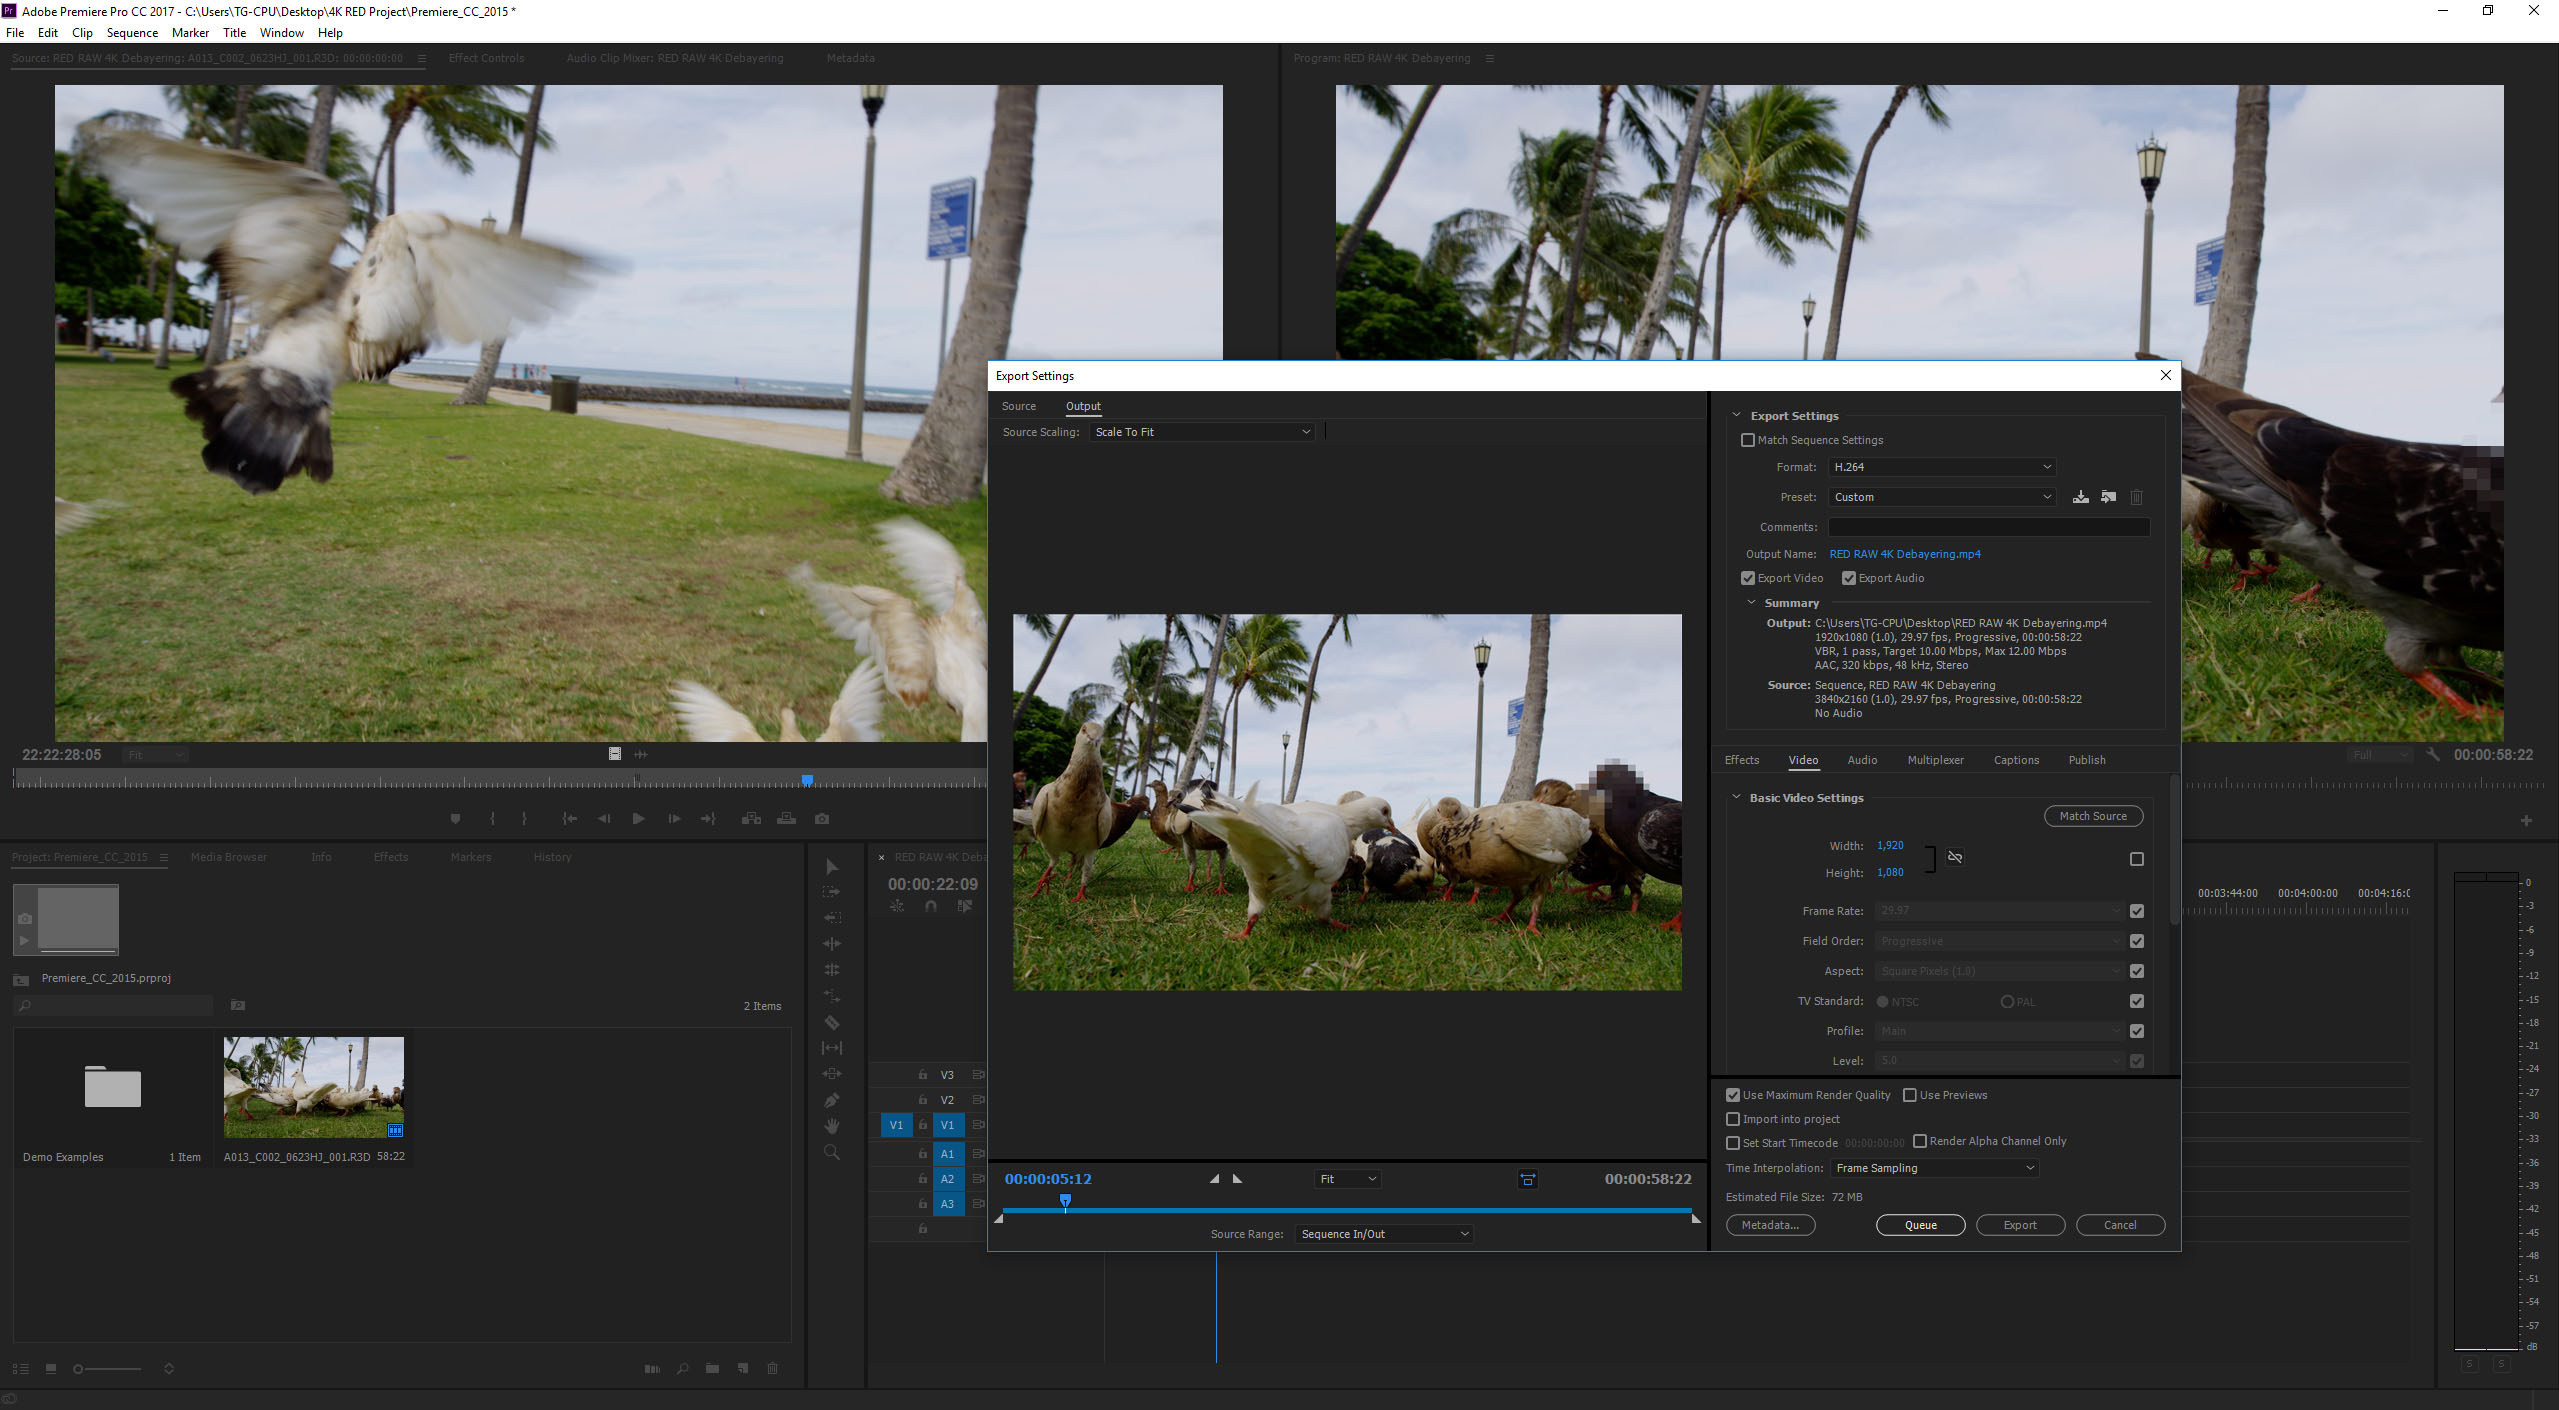
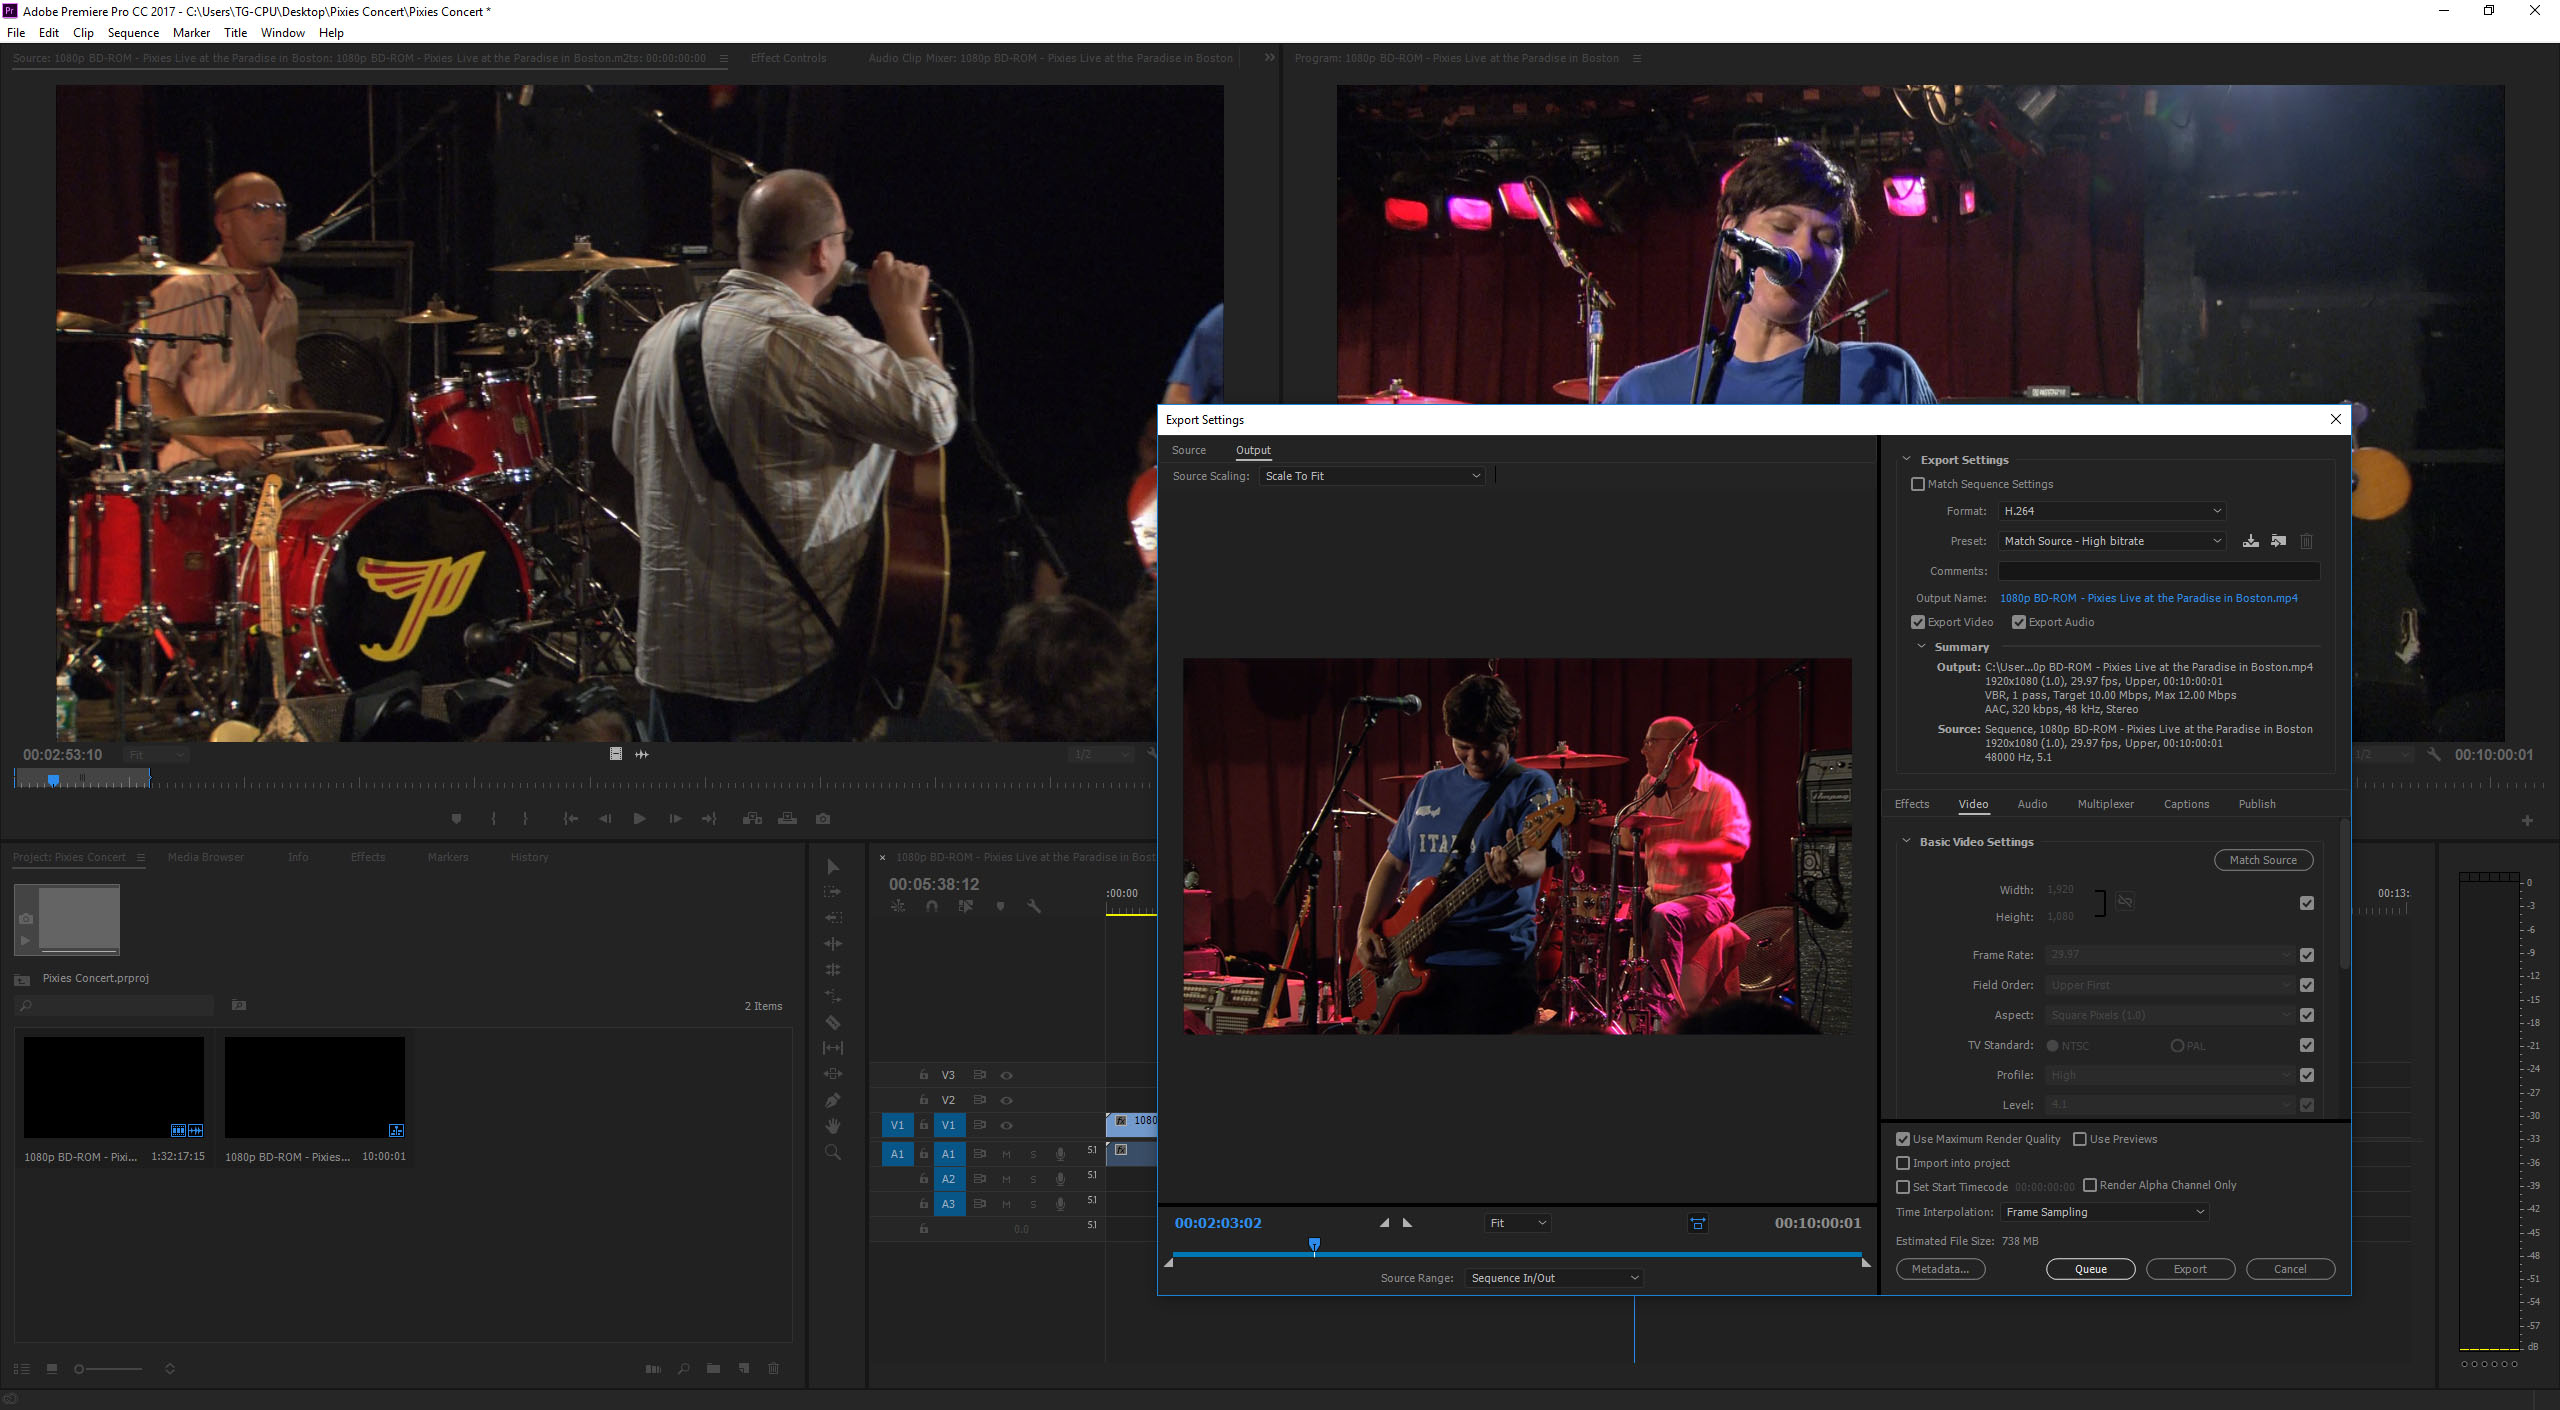
- Media: Adobe Premiere Pro
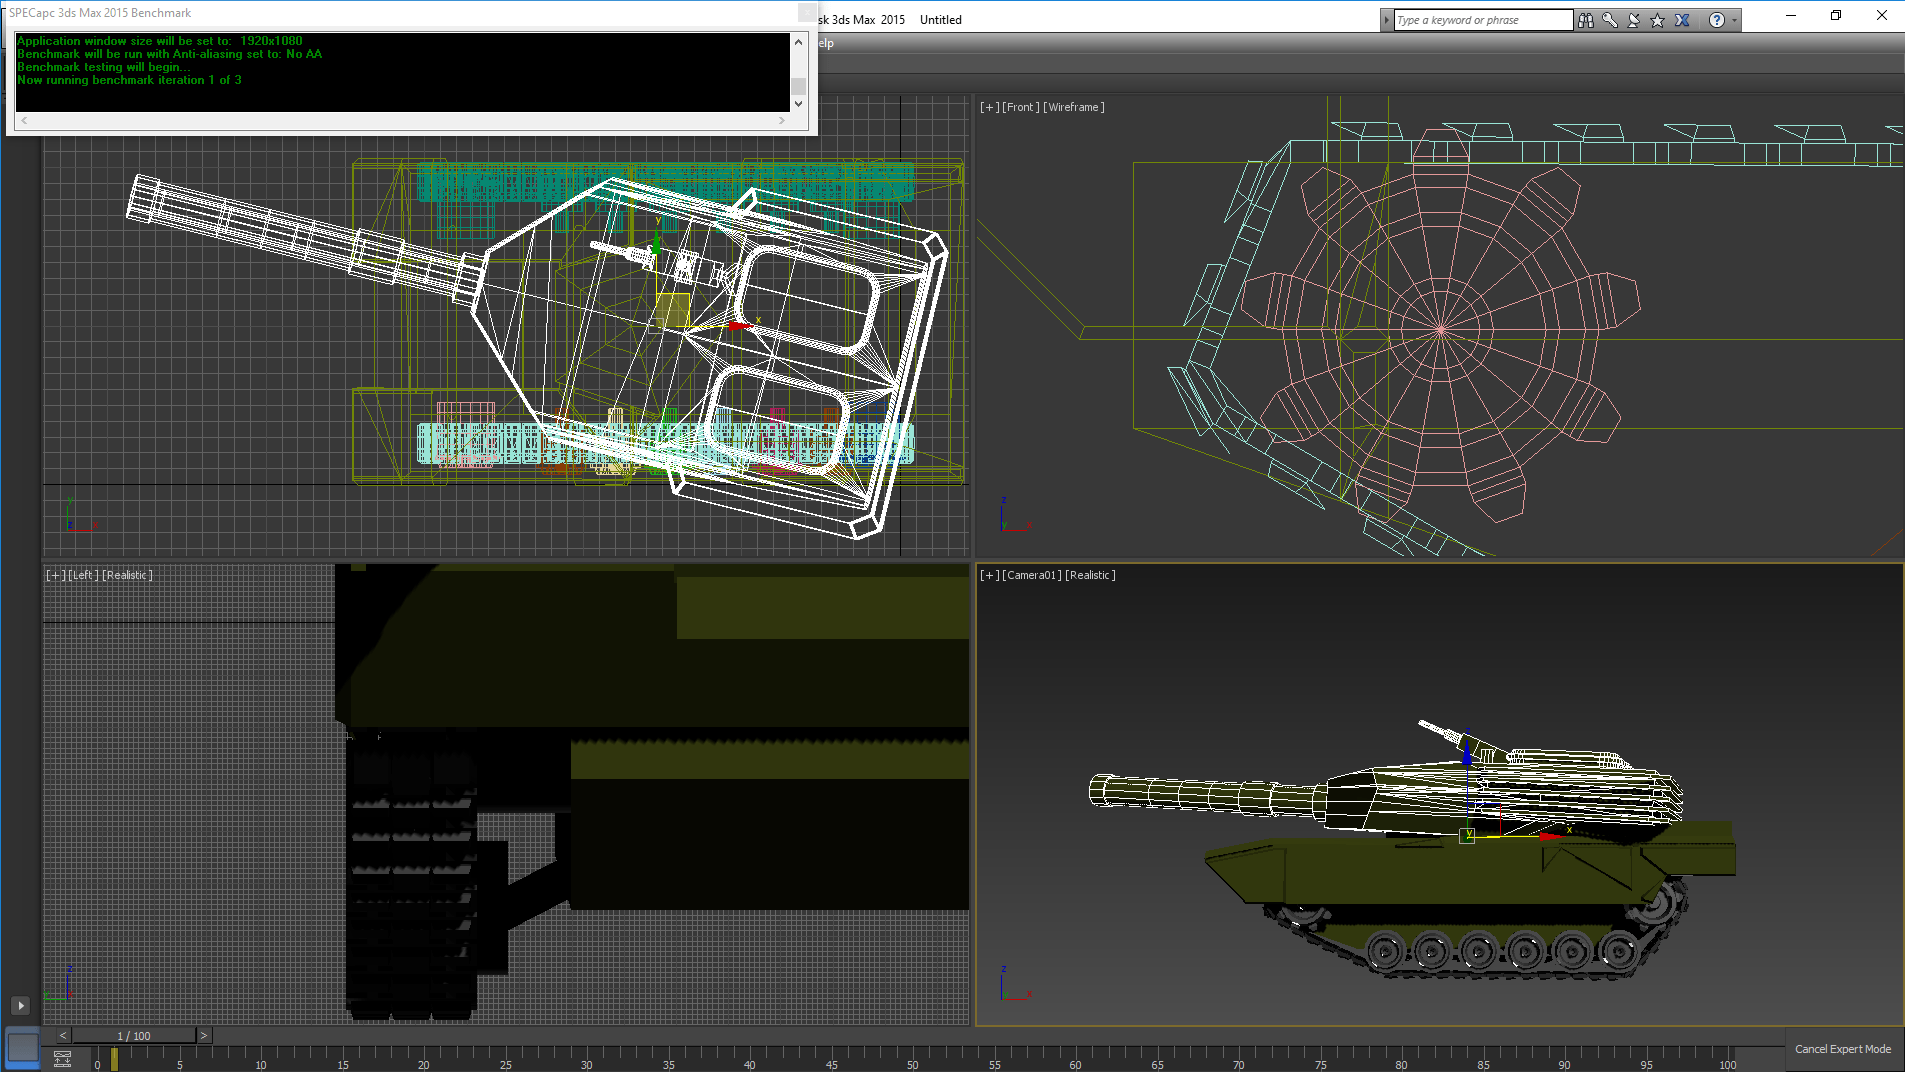
- Rendering: Autodesk 3ds Max 2015 (SPECapc)
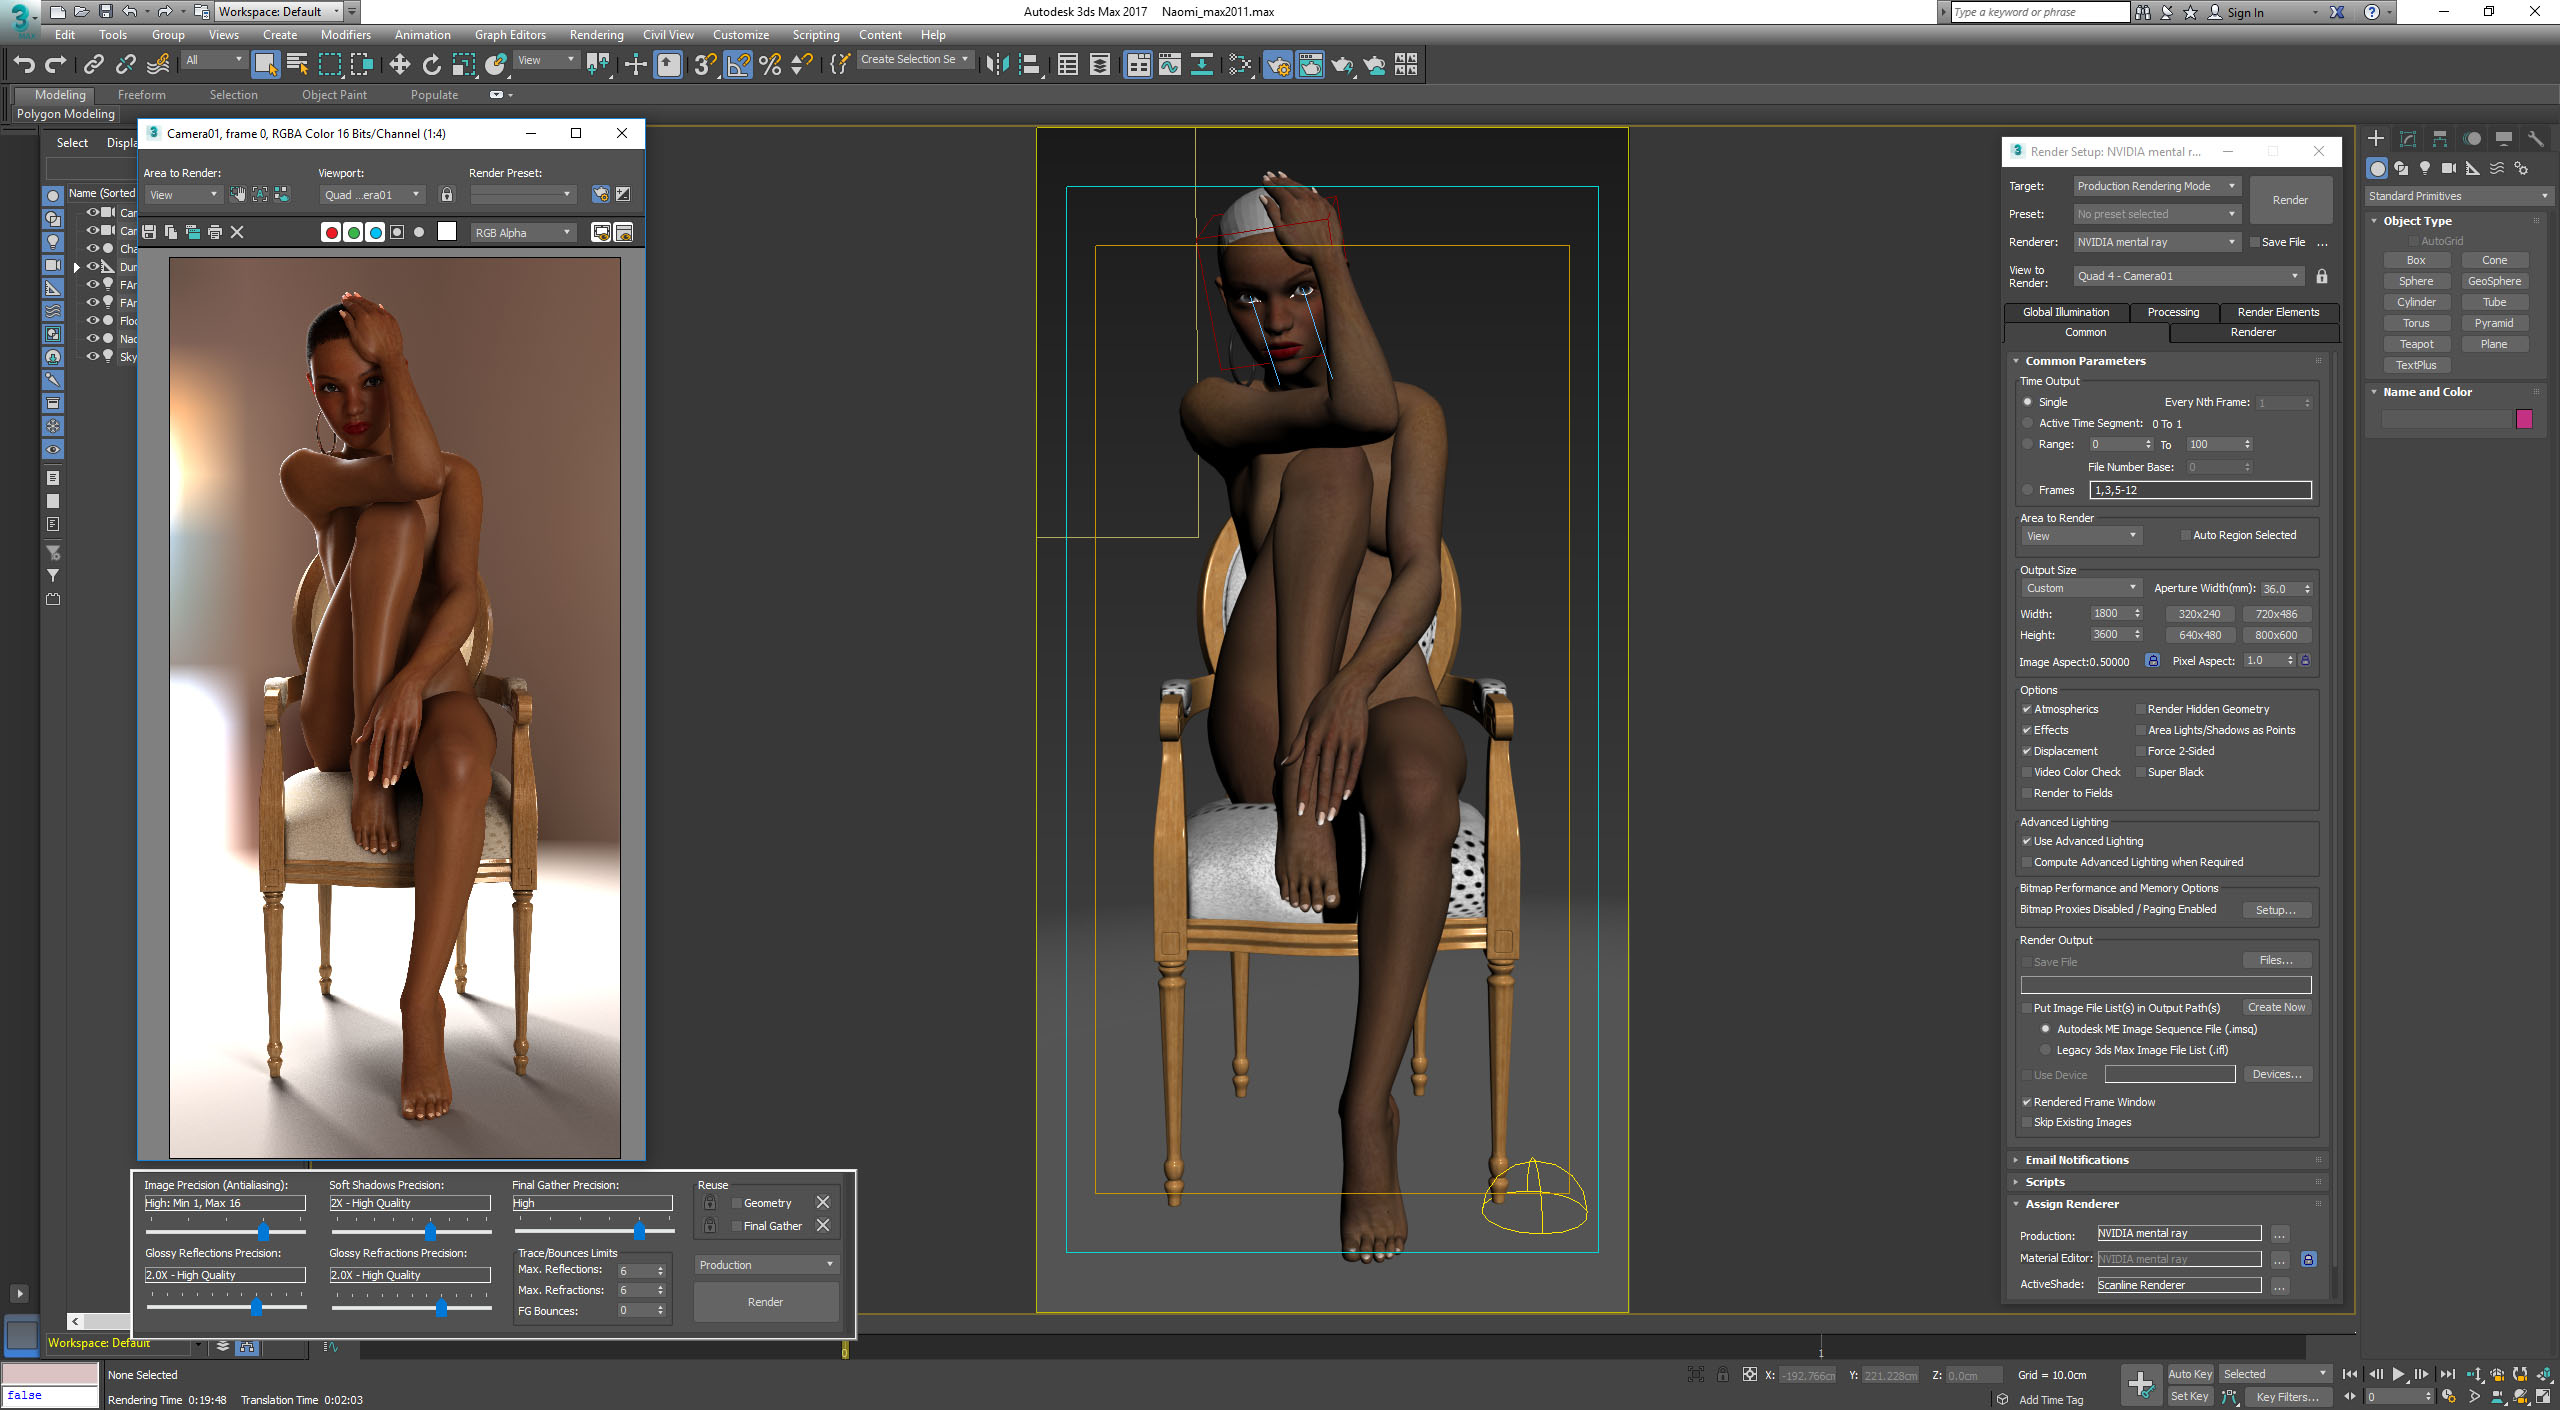
- Rendering: Autodesk 3ds Max 2017
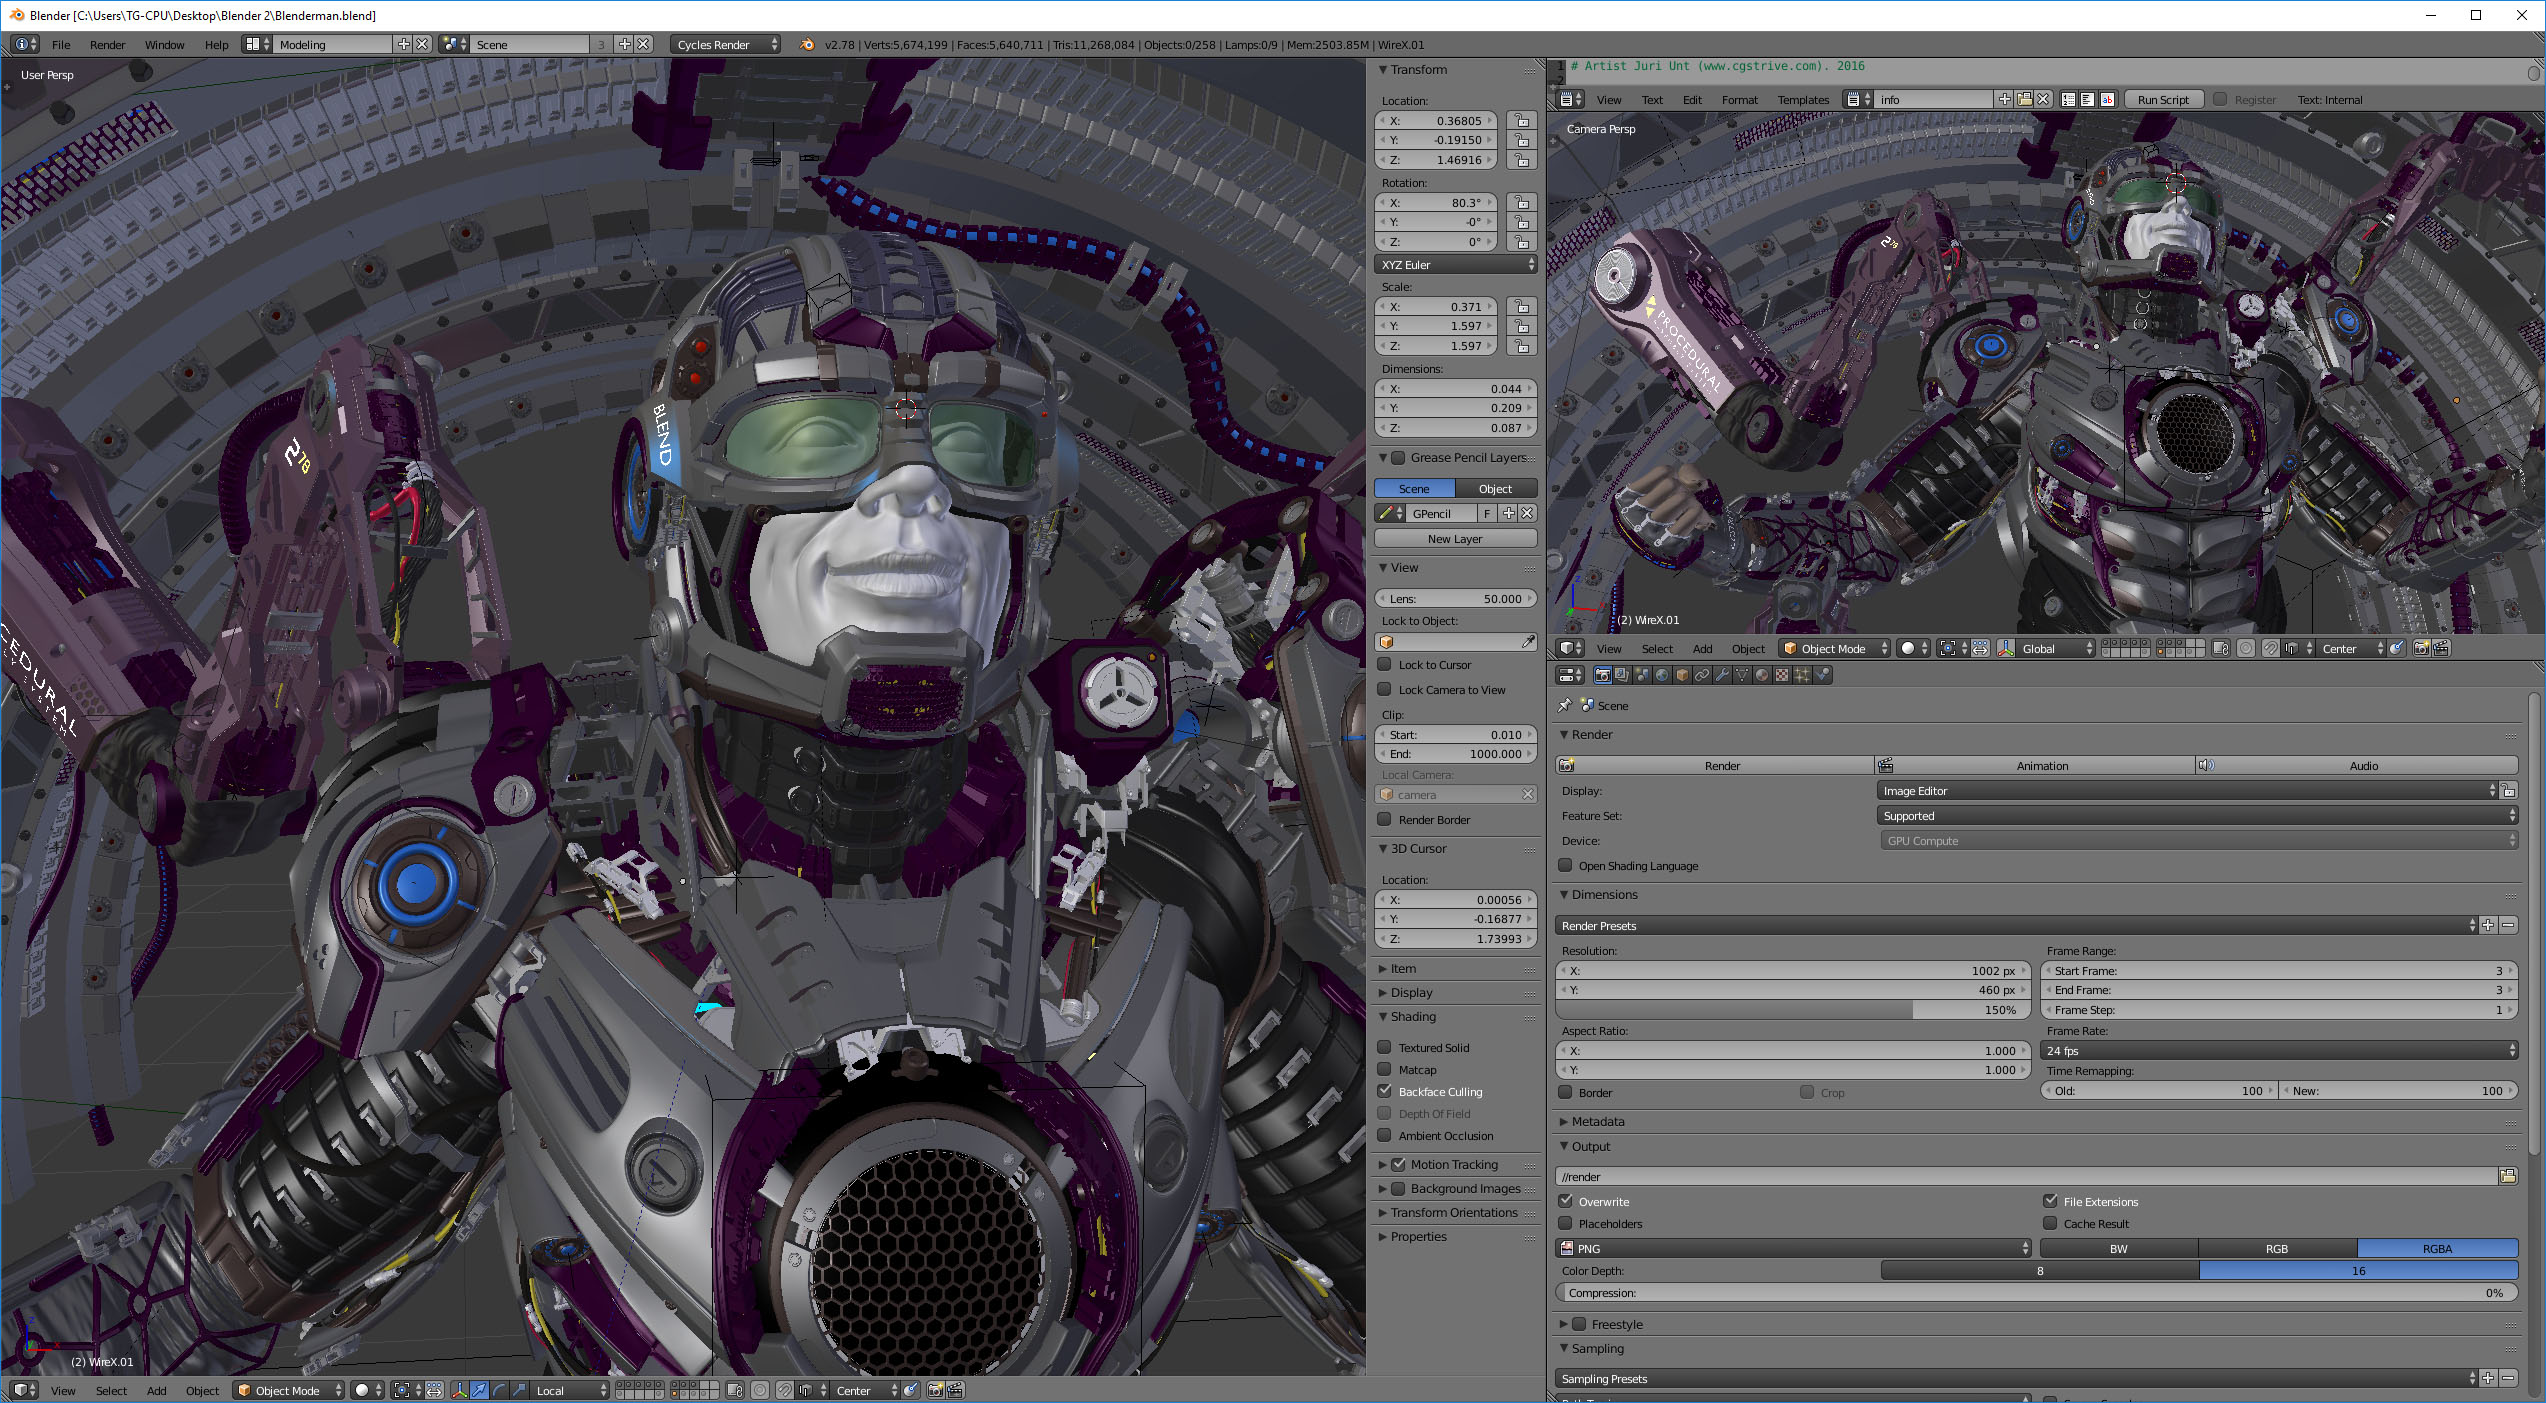
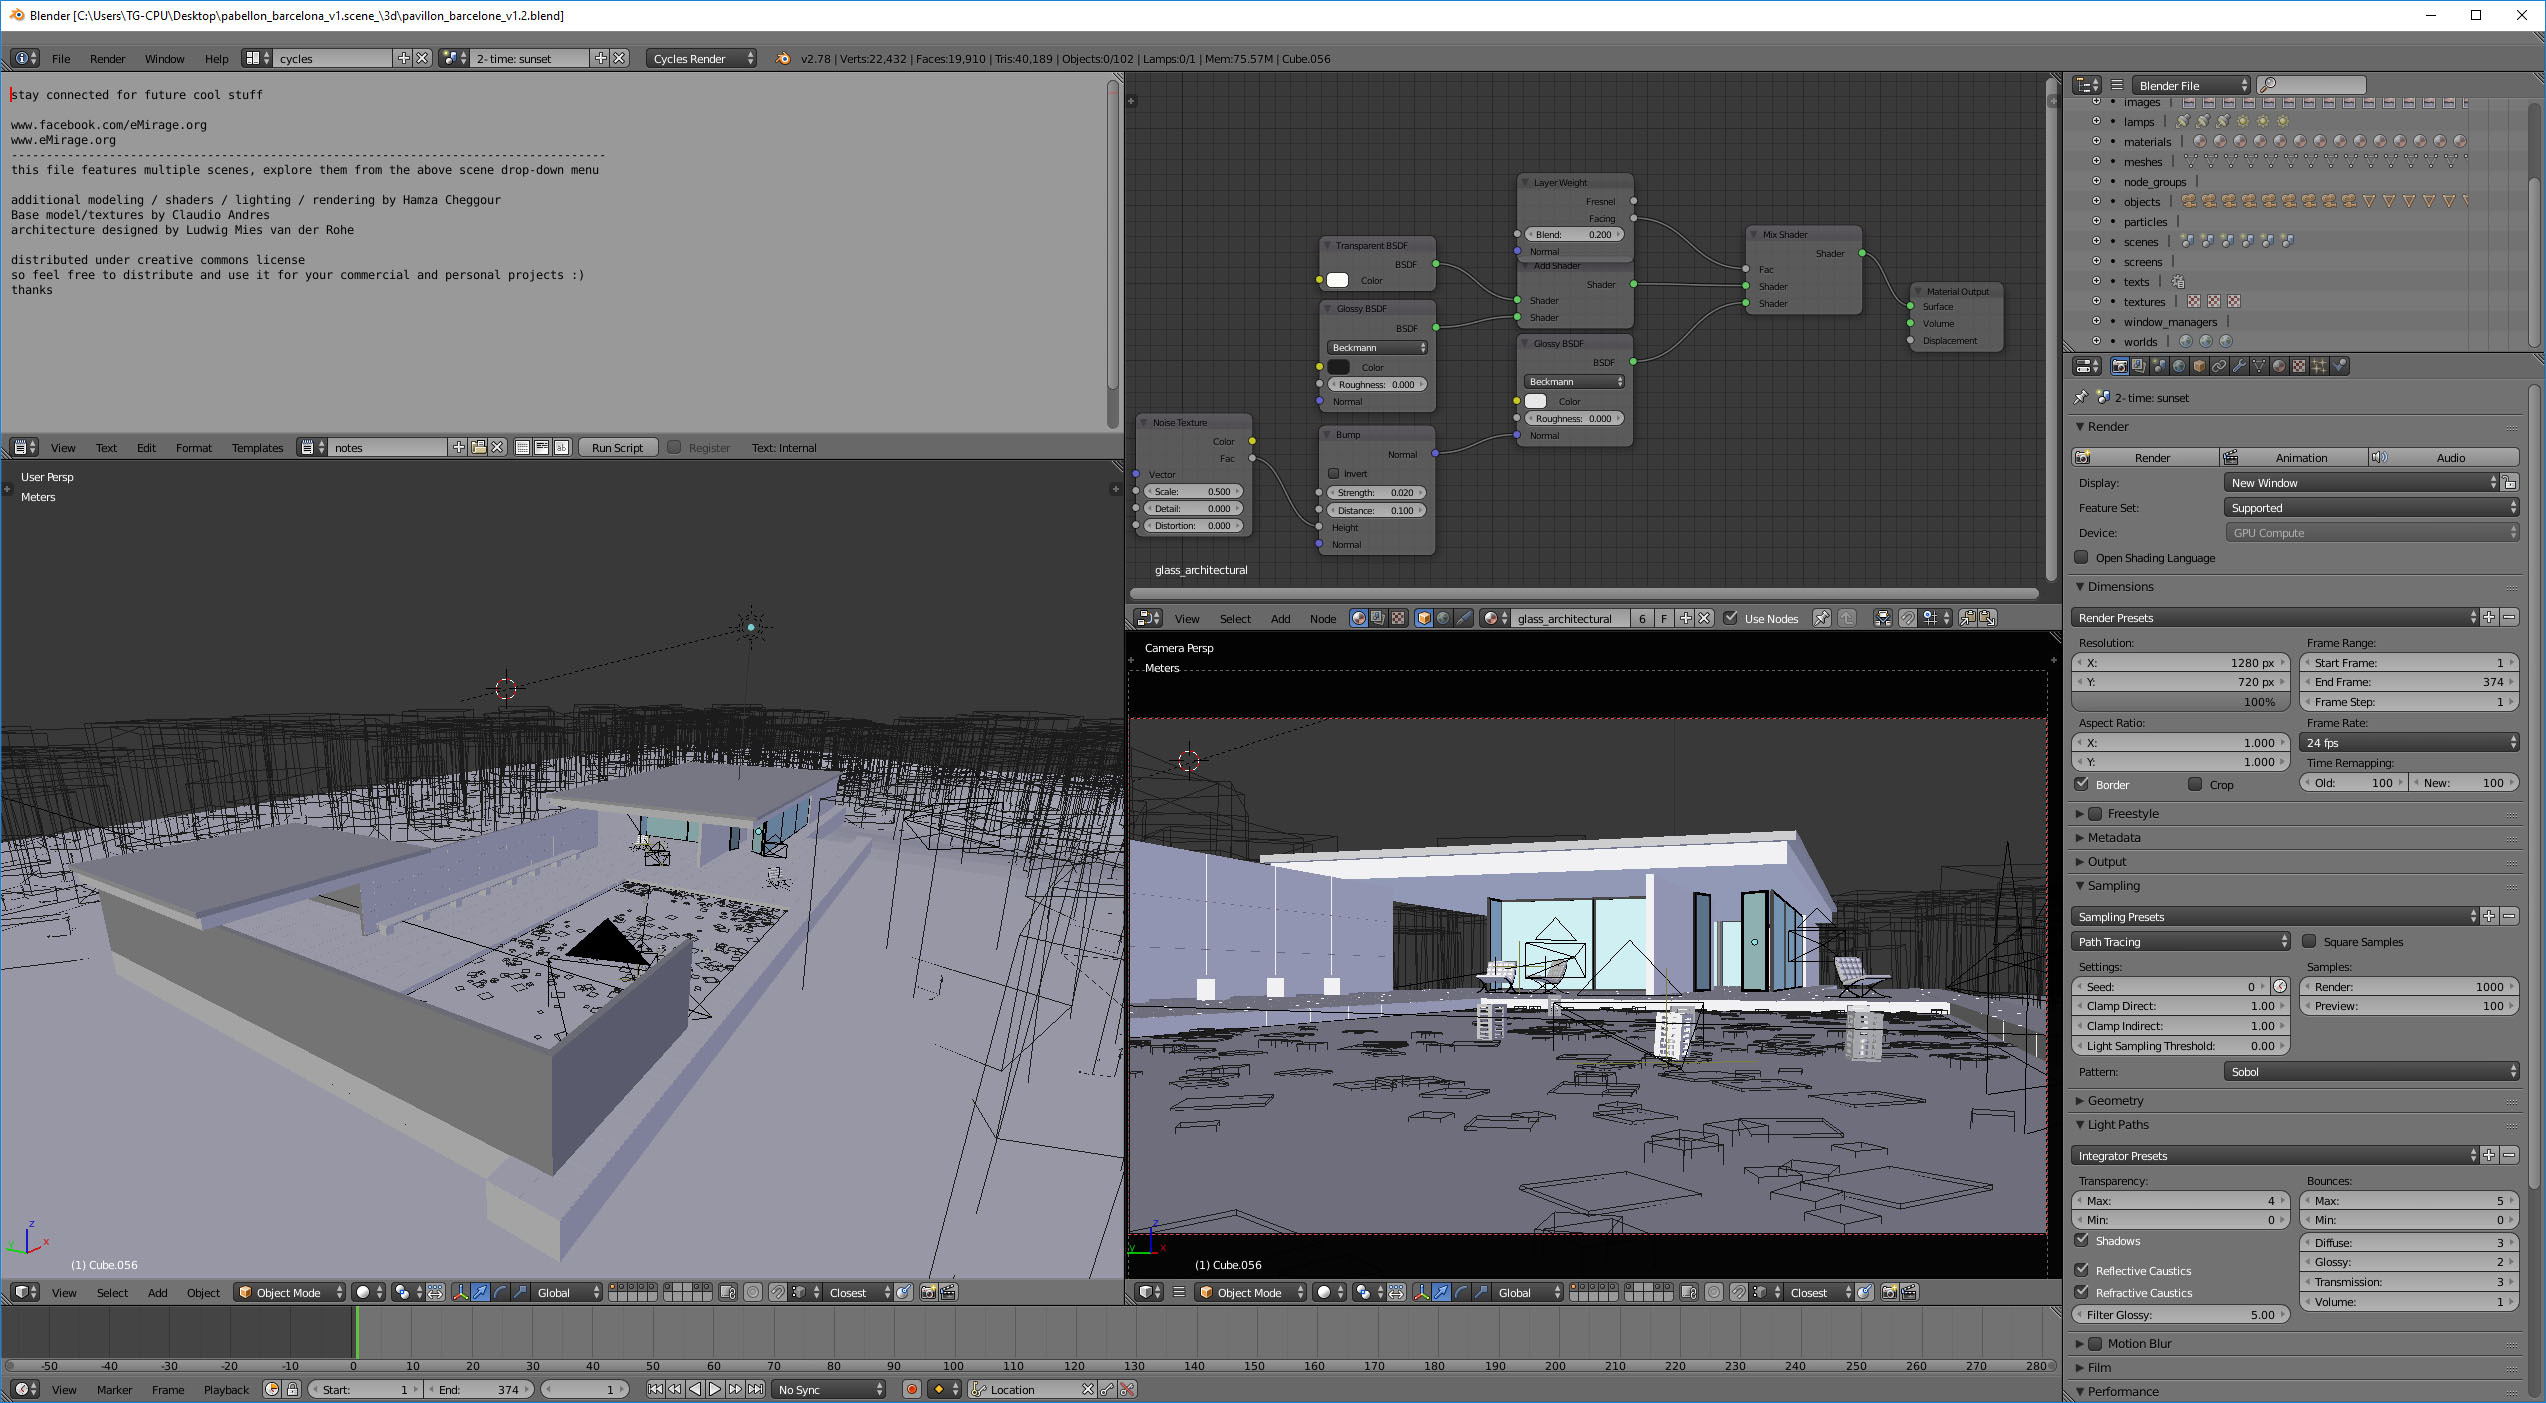
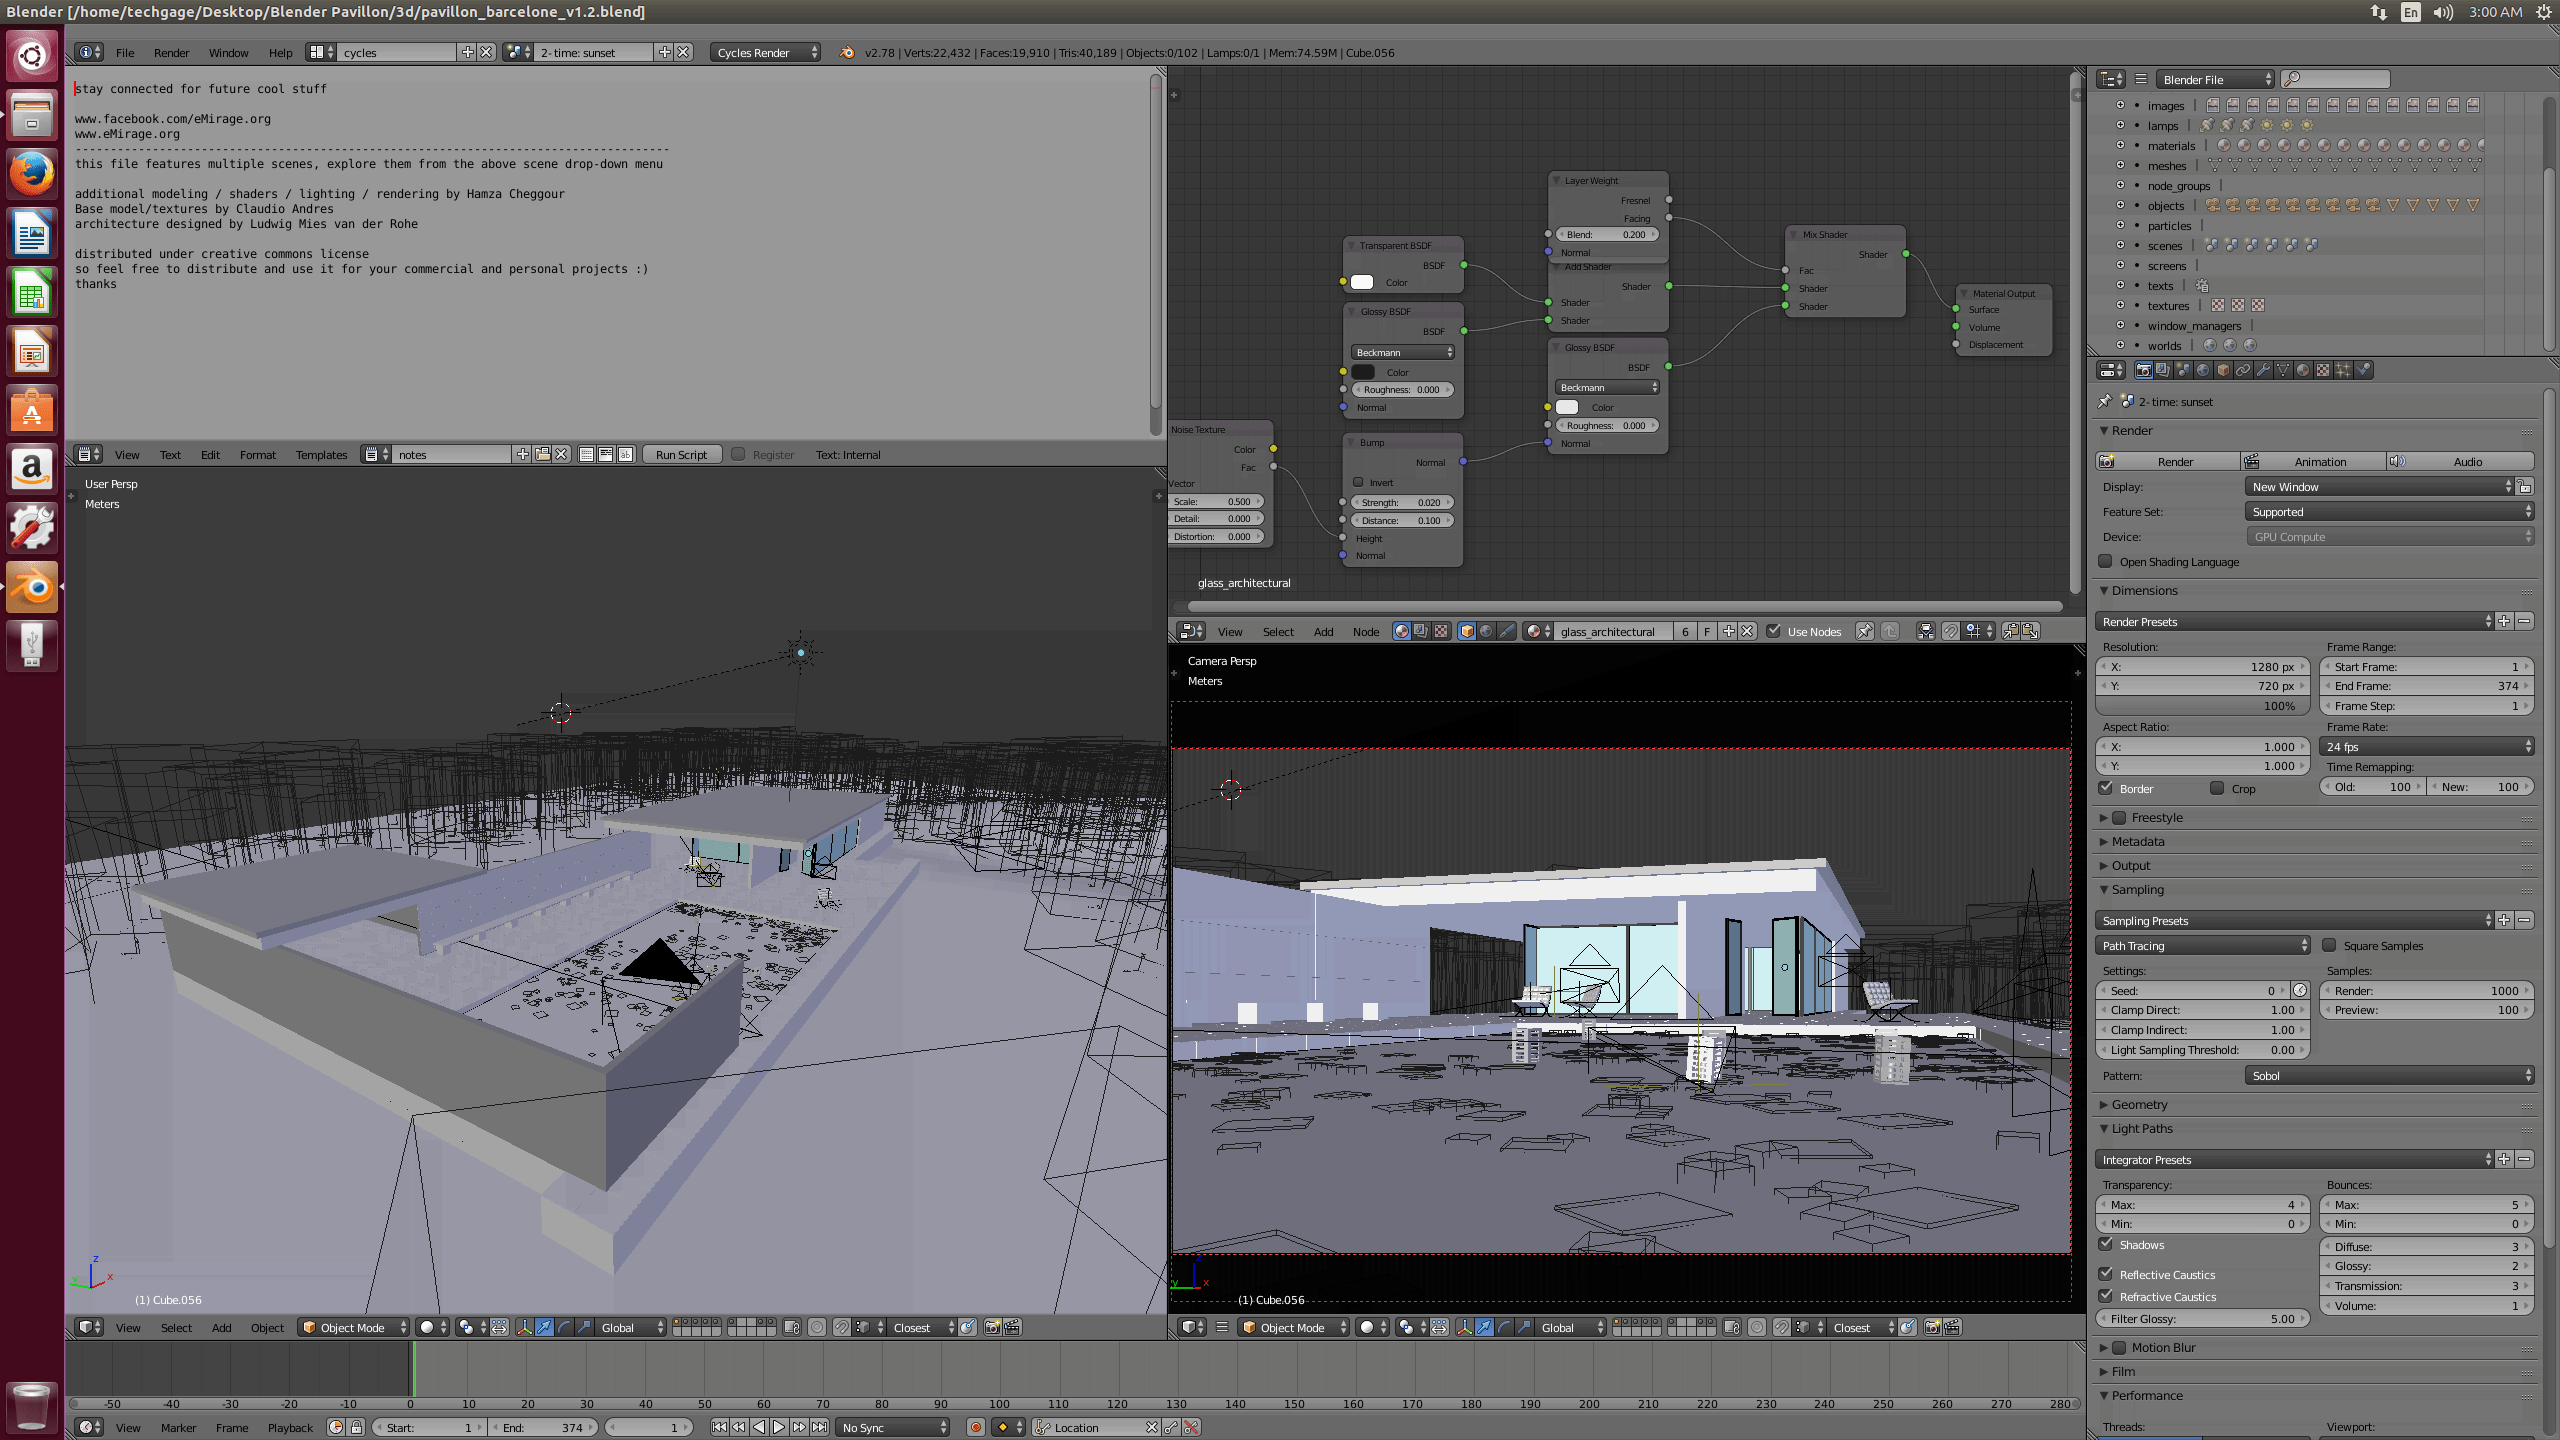
- Rendering: Blender
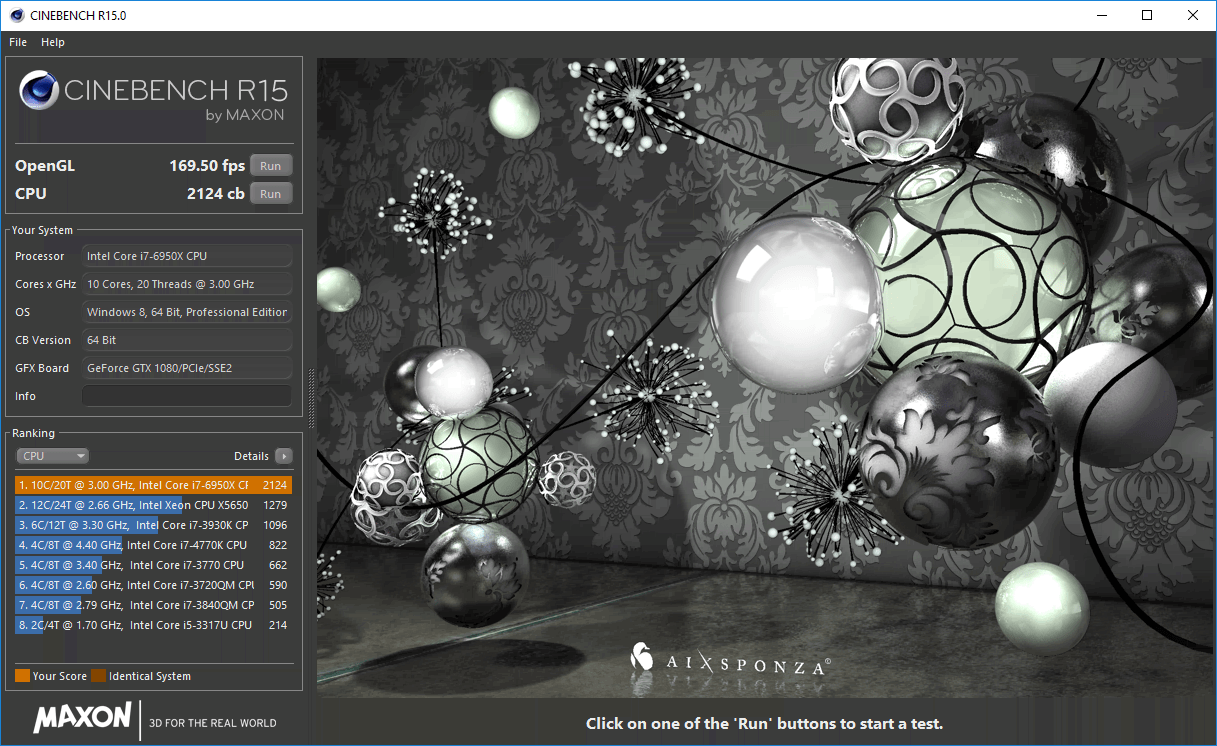
- Rendering: Cinebench
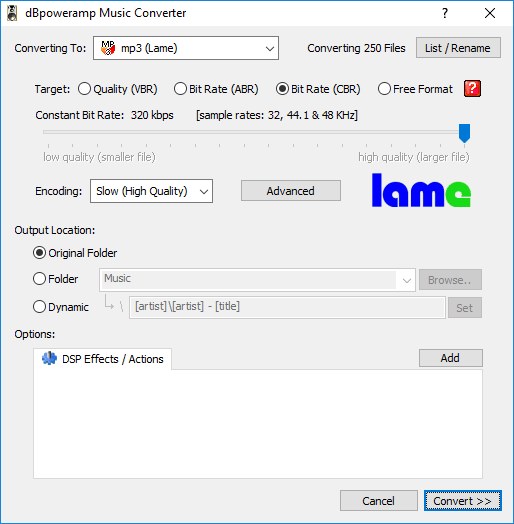
- Media: dBpoweramp
- Media: HandBrake
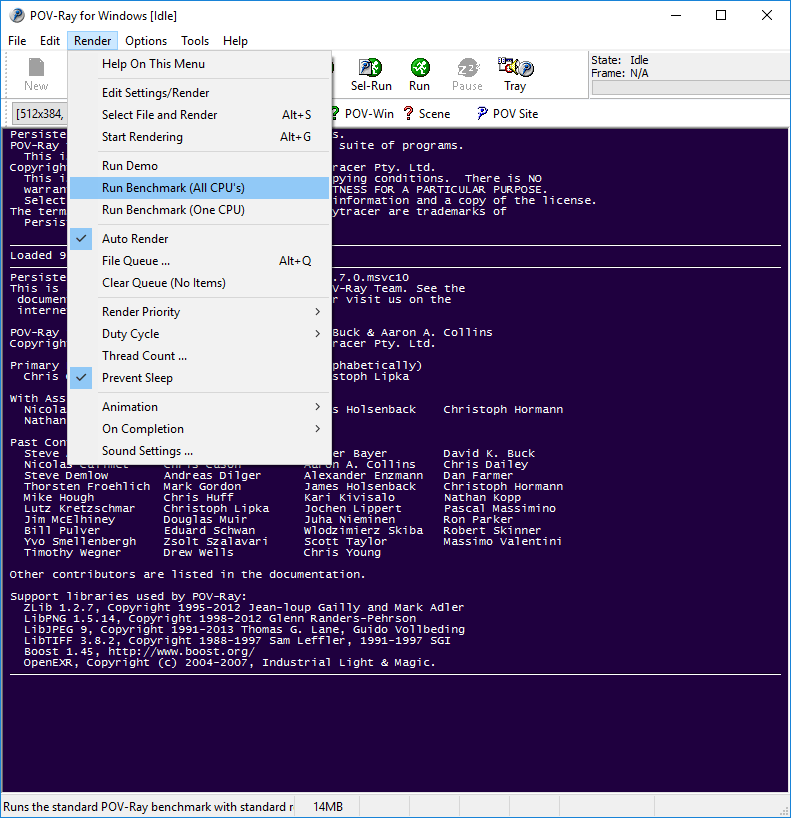
- Rendering: POV-Ray
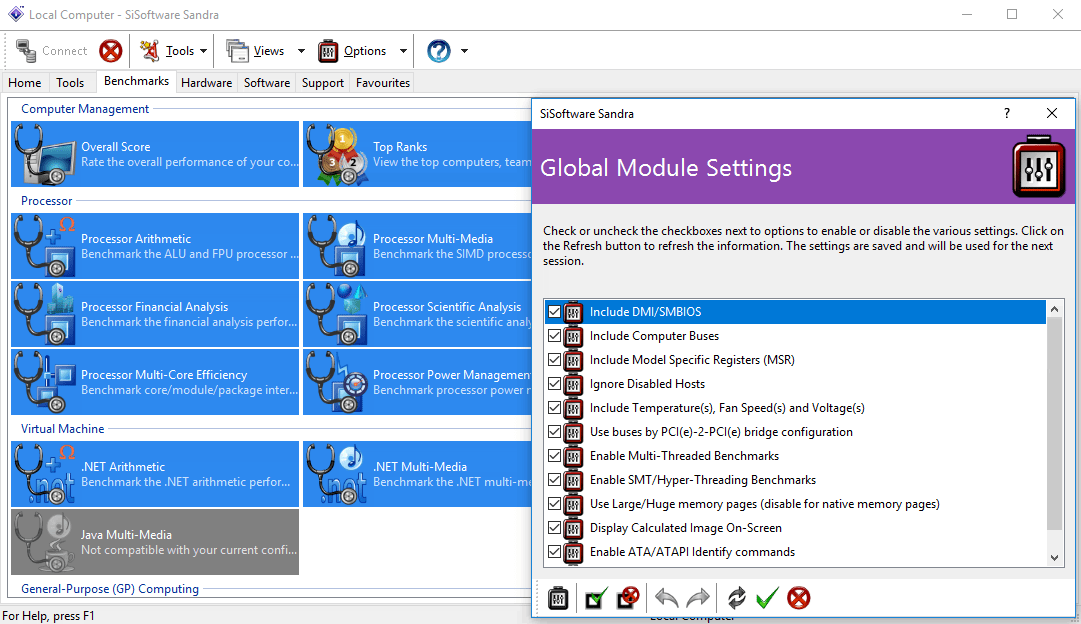
- System: SiSoftware Sandra 2016
(Links go that benchmark)
All of the tests shown above are used in their stock configurations, outside of CUDA encoding being disabled on the Premiere Pro projects. If you’re a Blender user and wish to compare your system’s performance to ours, you can download the project files for free here.
Gaming Benchmarks
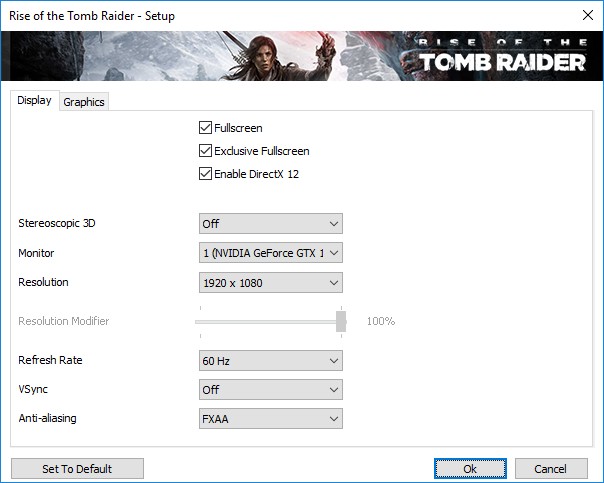
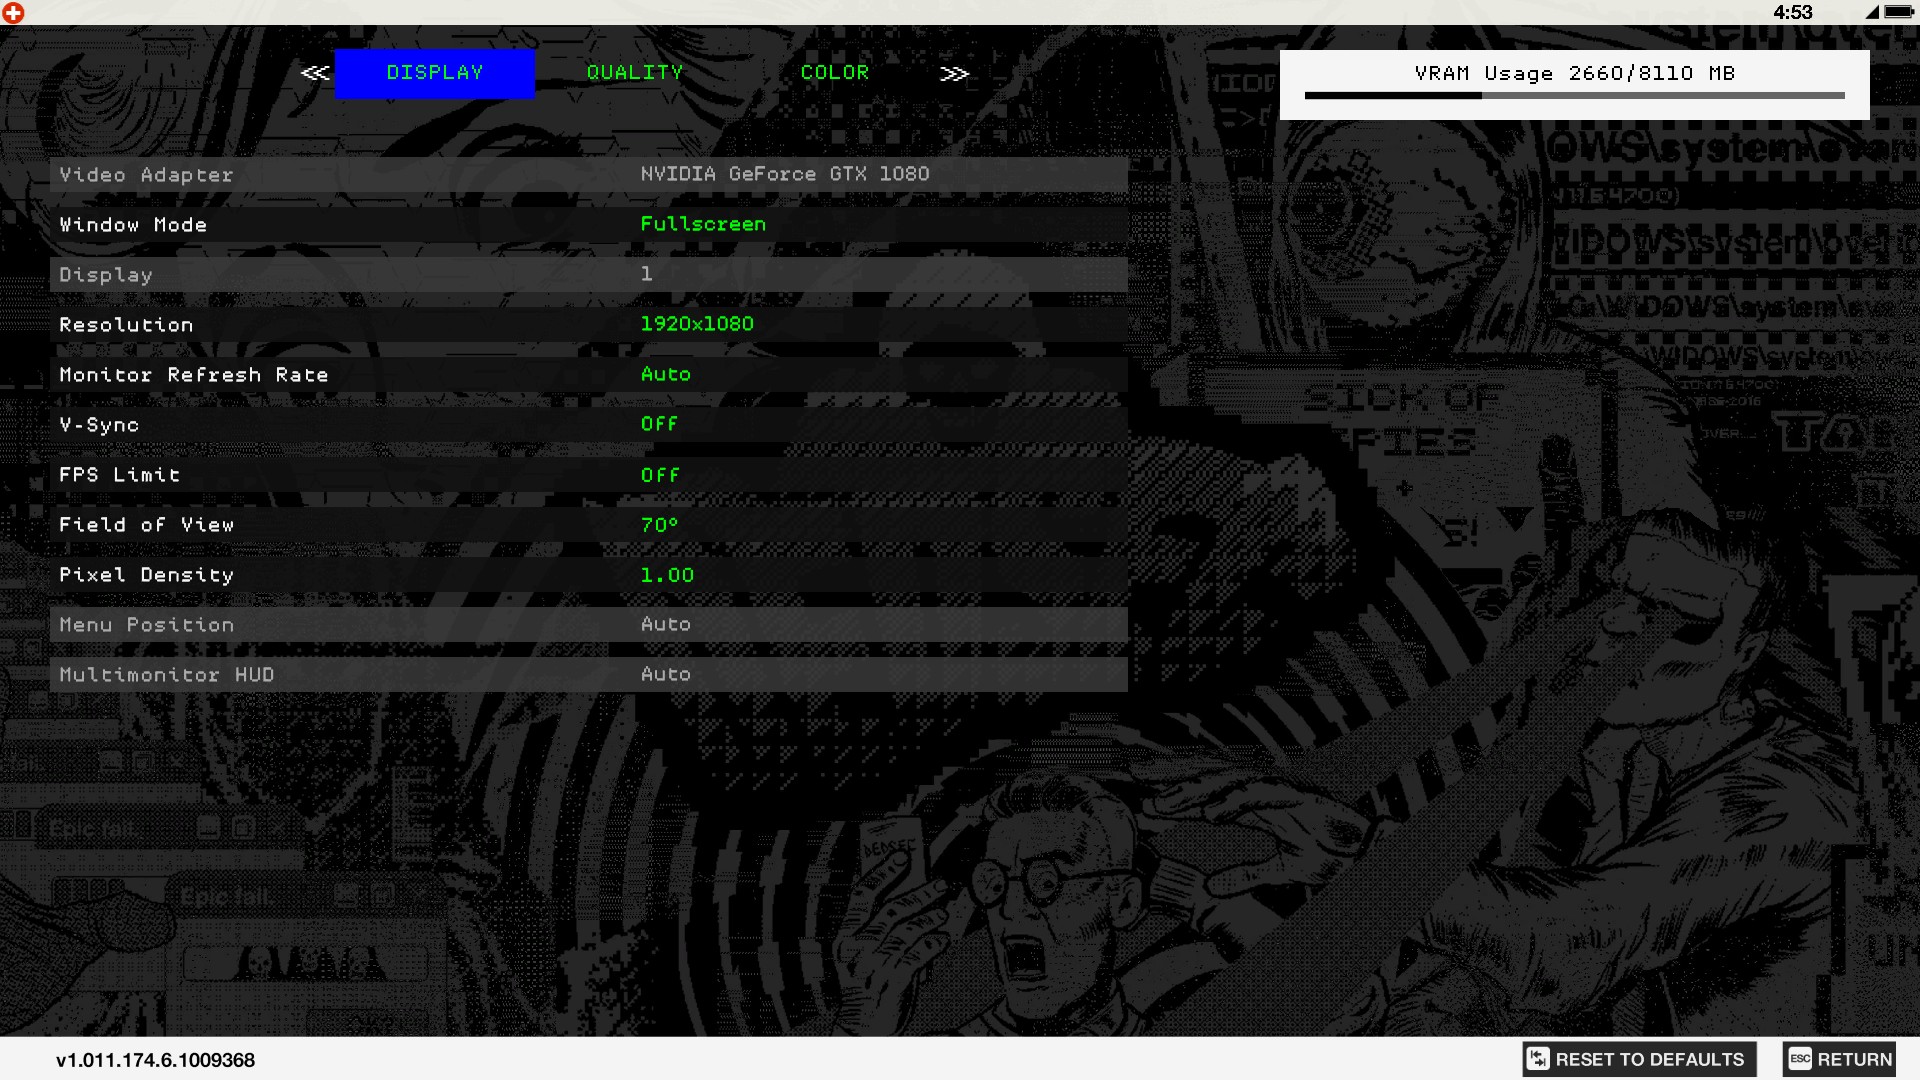
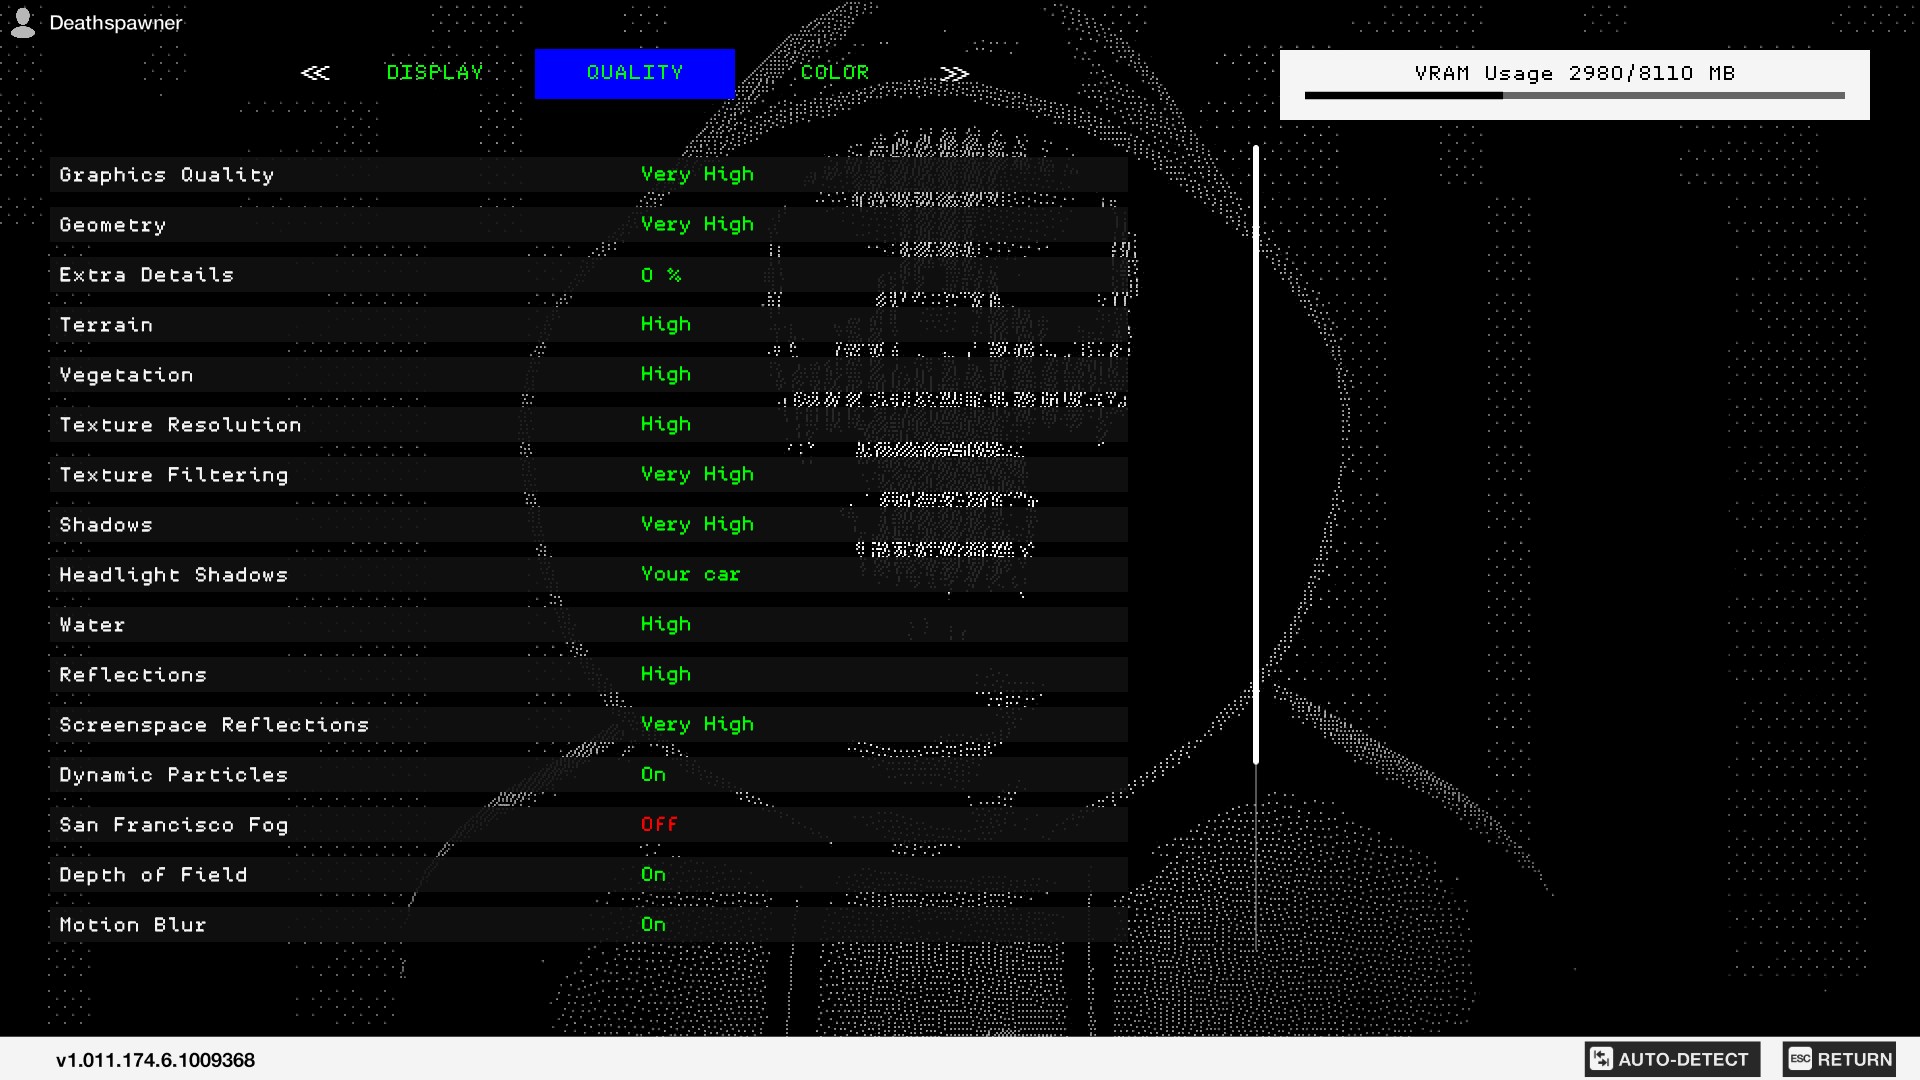
Because the biggest bottleneck in a game is the graphics card, the workload needs to be put on the CPU as much as possible in order to better understand the raw performance scaling. As such, all of the games tested here were run at 1080p and 1440p, with moderate detail levels. A single 4K benchmark in the form of 3DMark is included as well, which will highlight the differences when the GPU is the bottleneck.
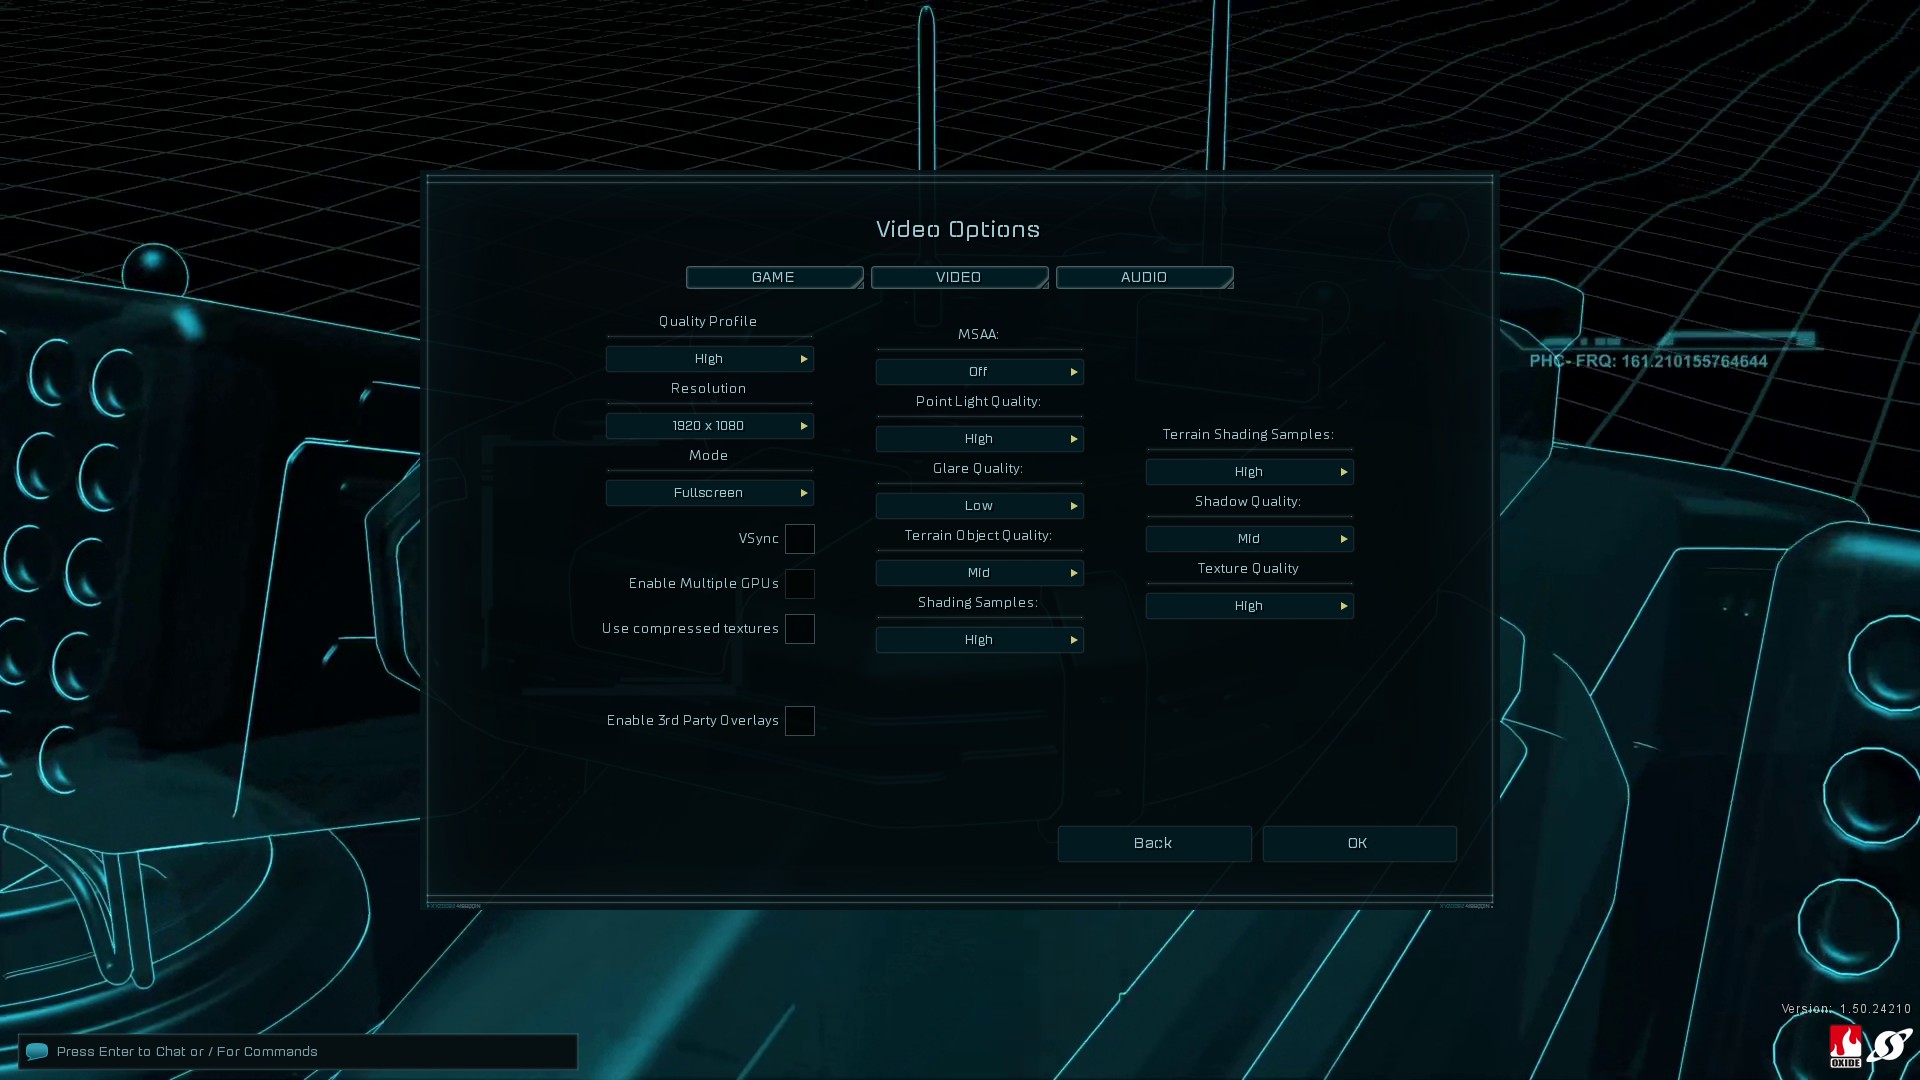
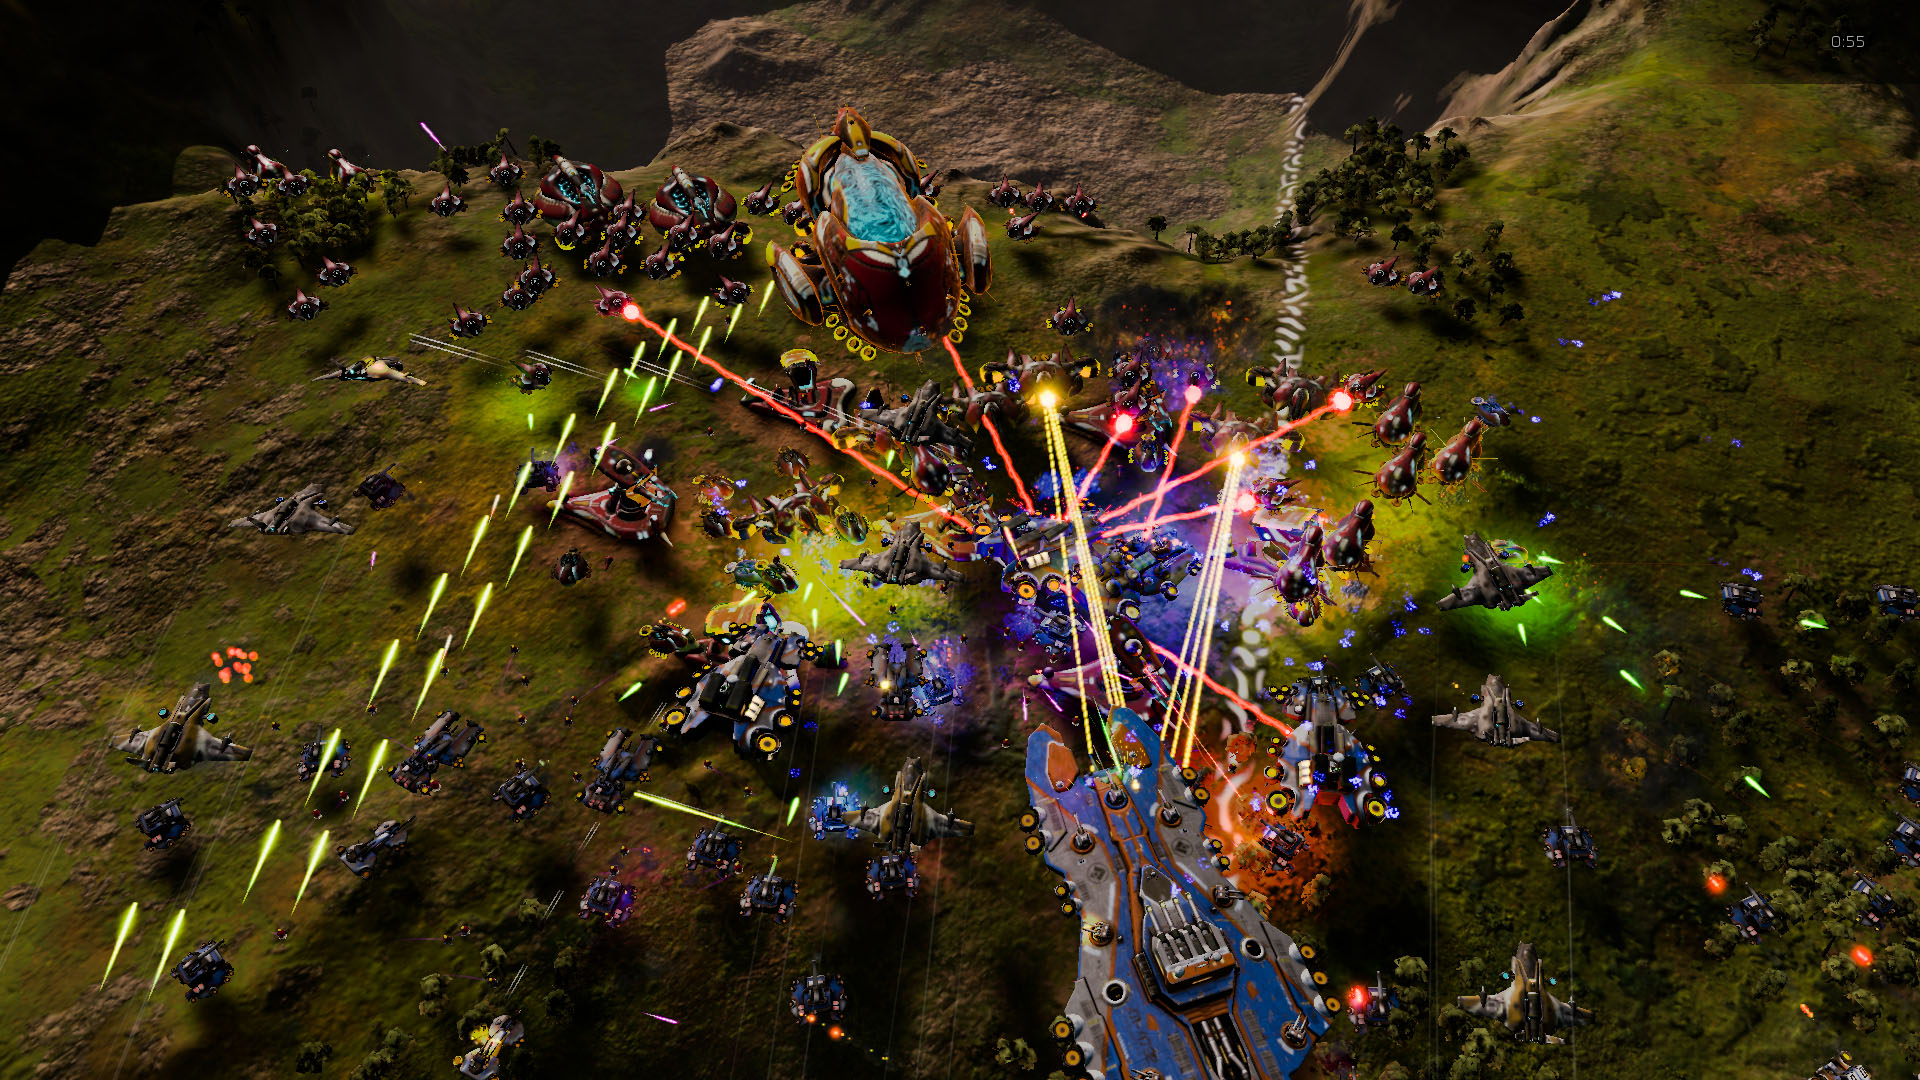
- Synthetic: Ashes of the Singularity (CPU)
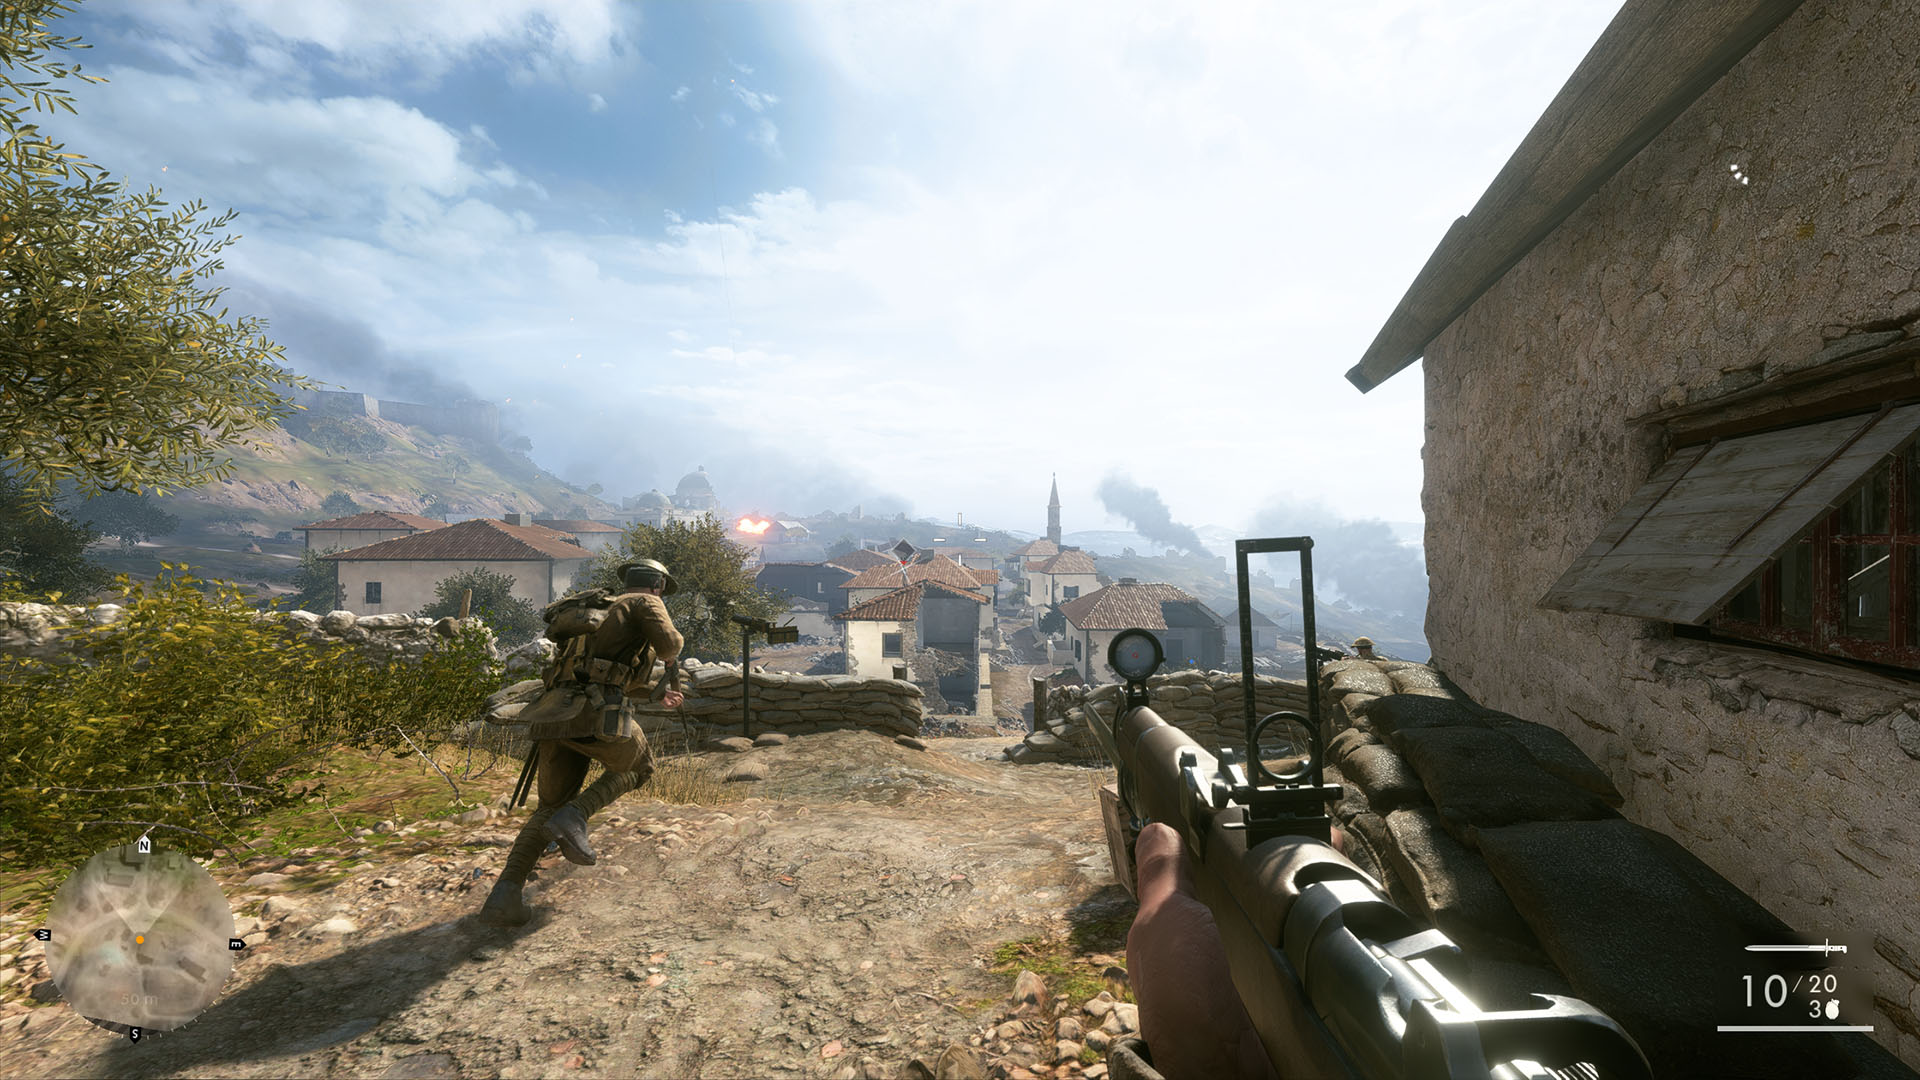
- Real-world: Battlefield 1 (CPU + GPU)
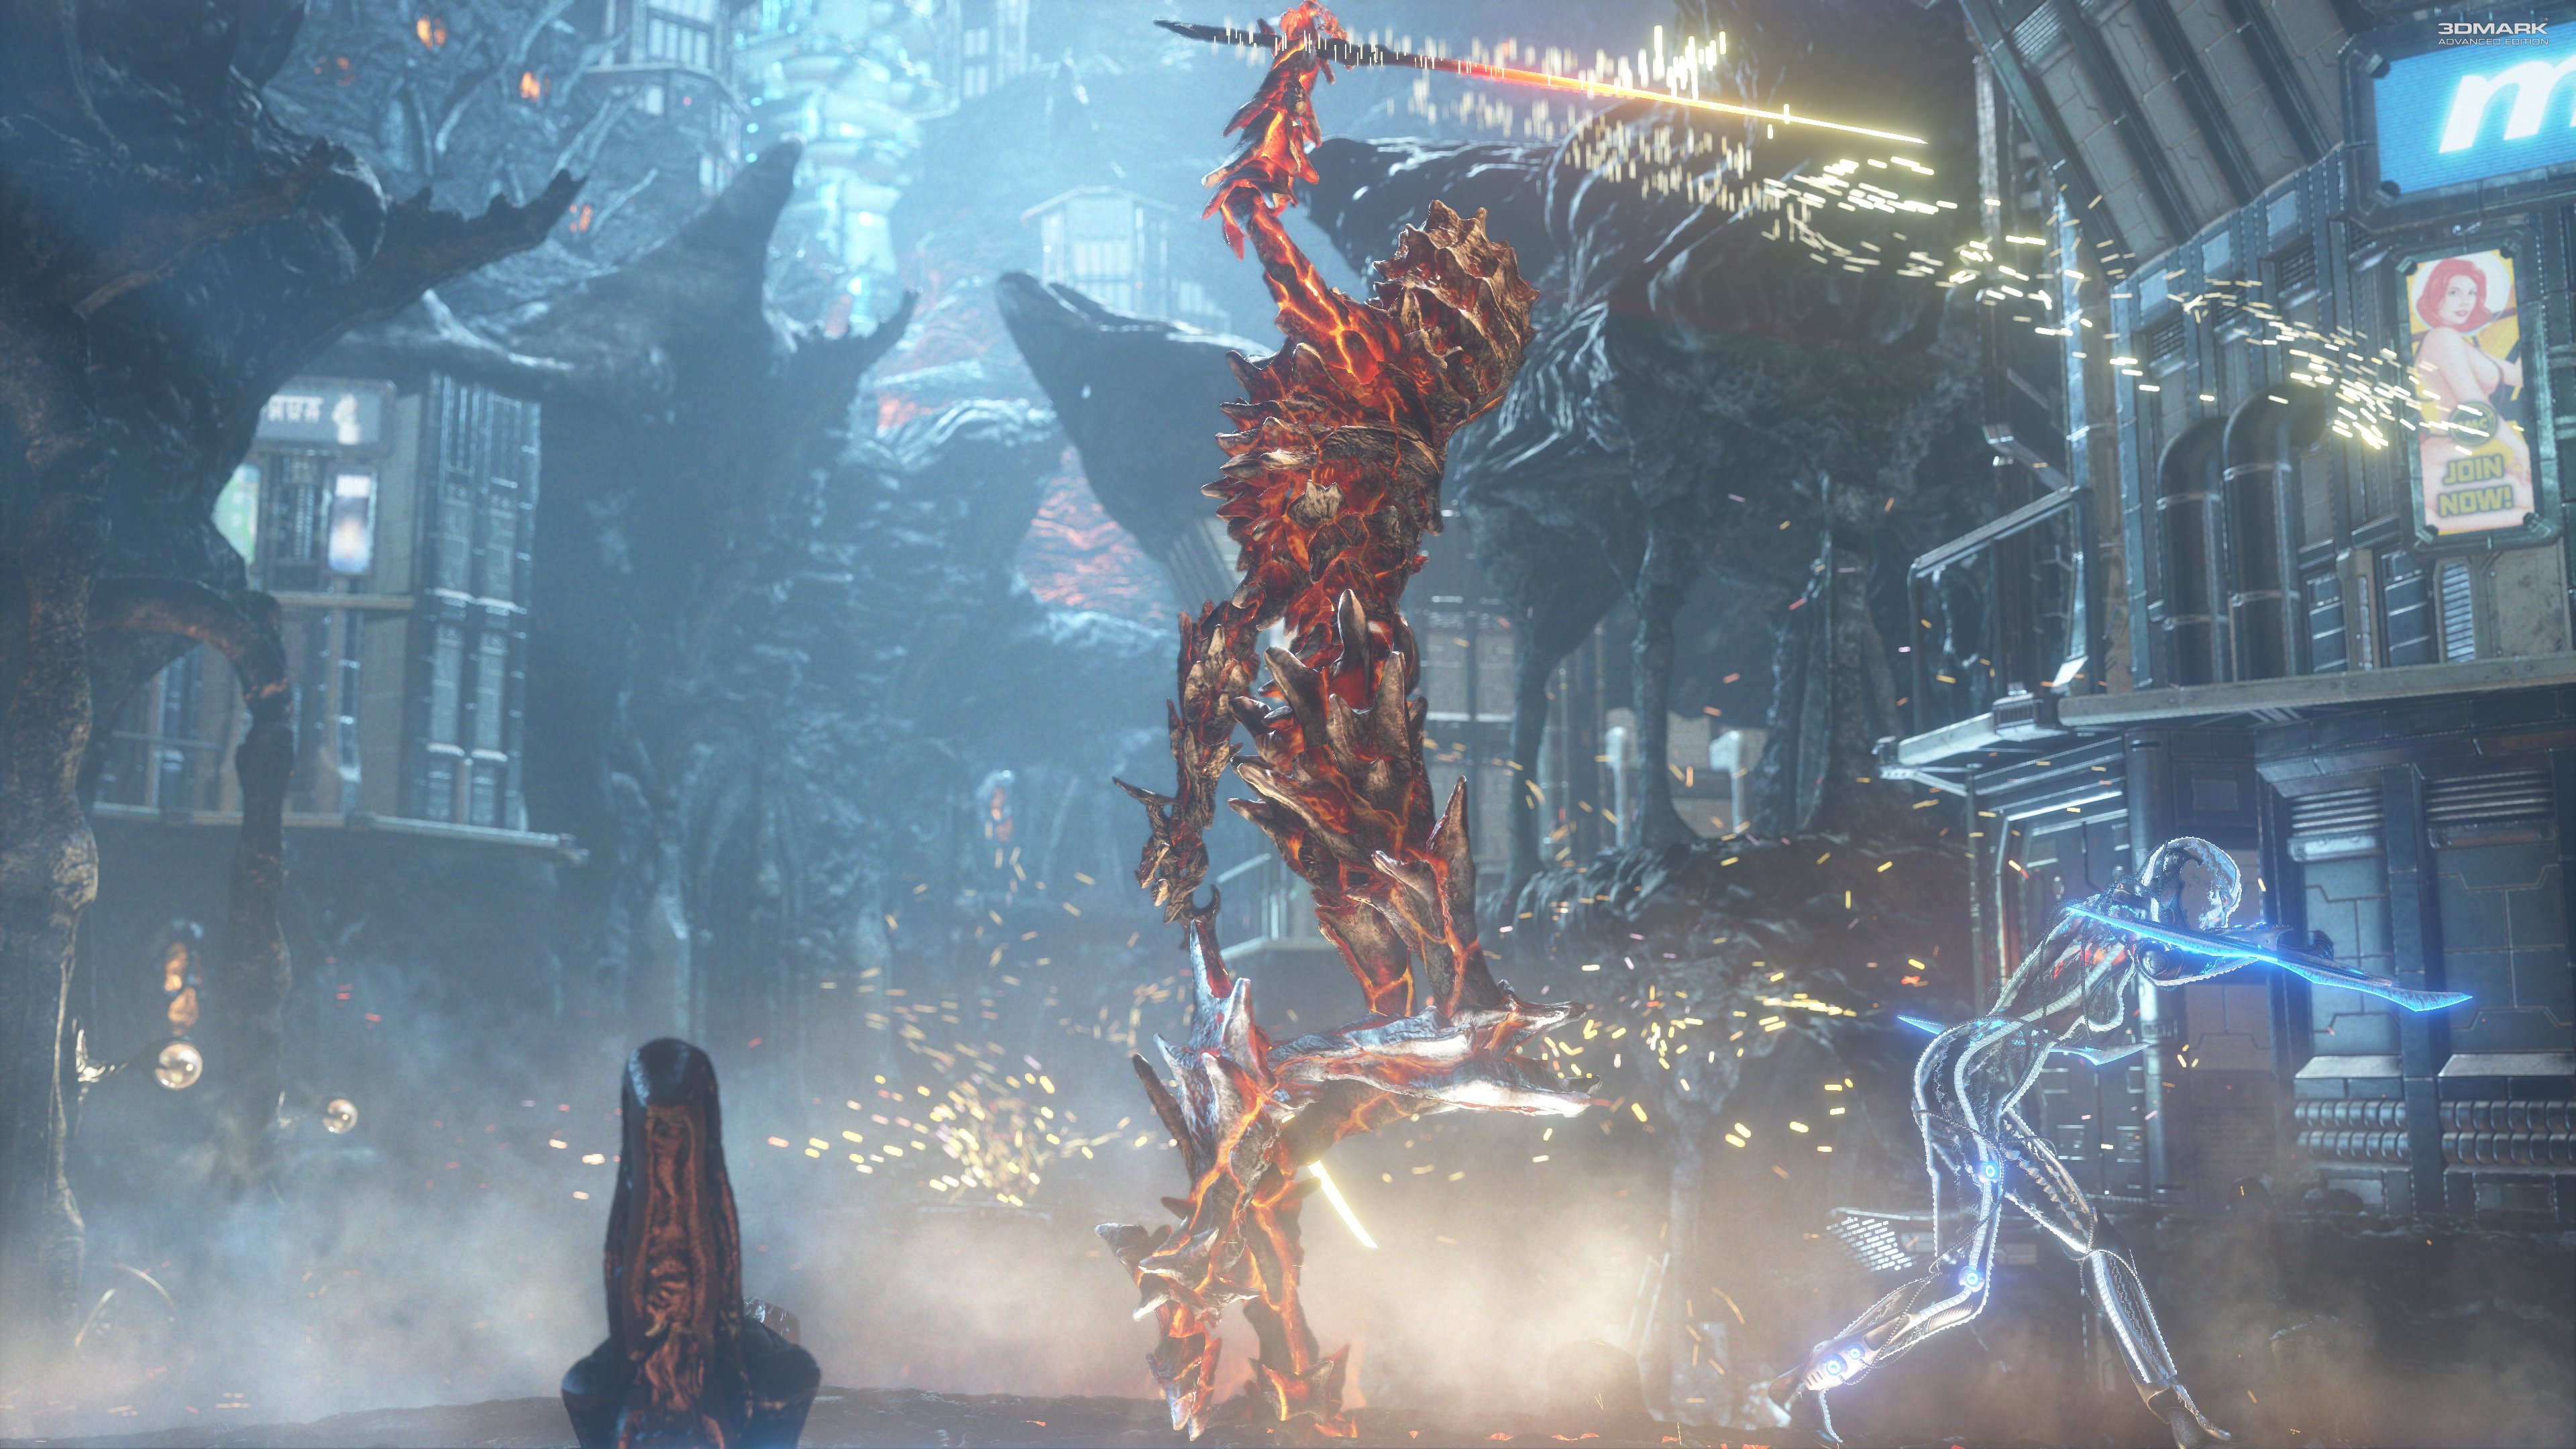
- Synthetic: Futuremark 3DMark (CPU + GPU)
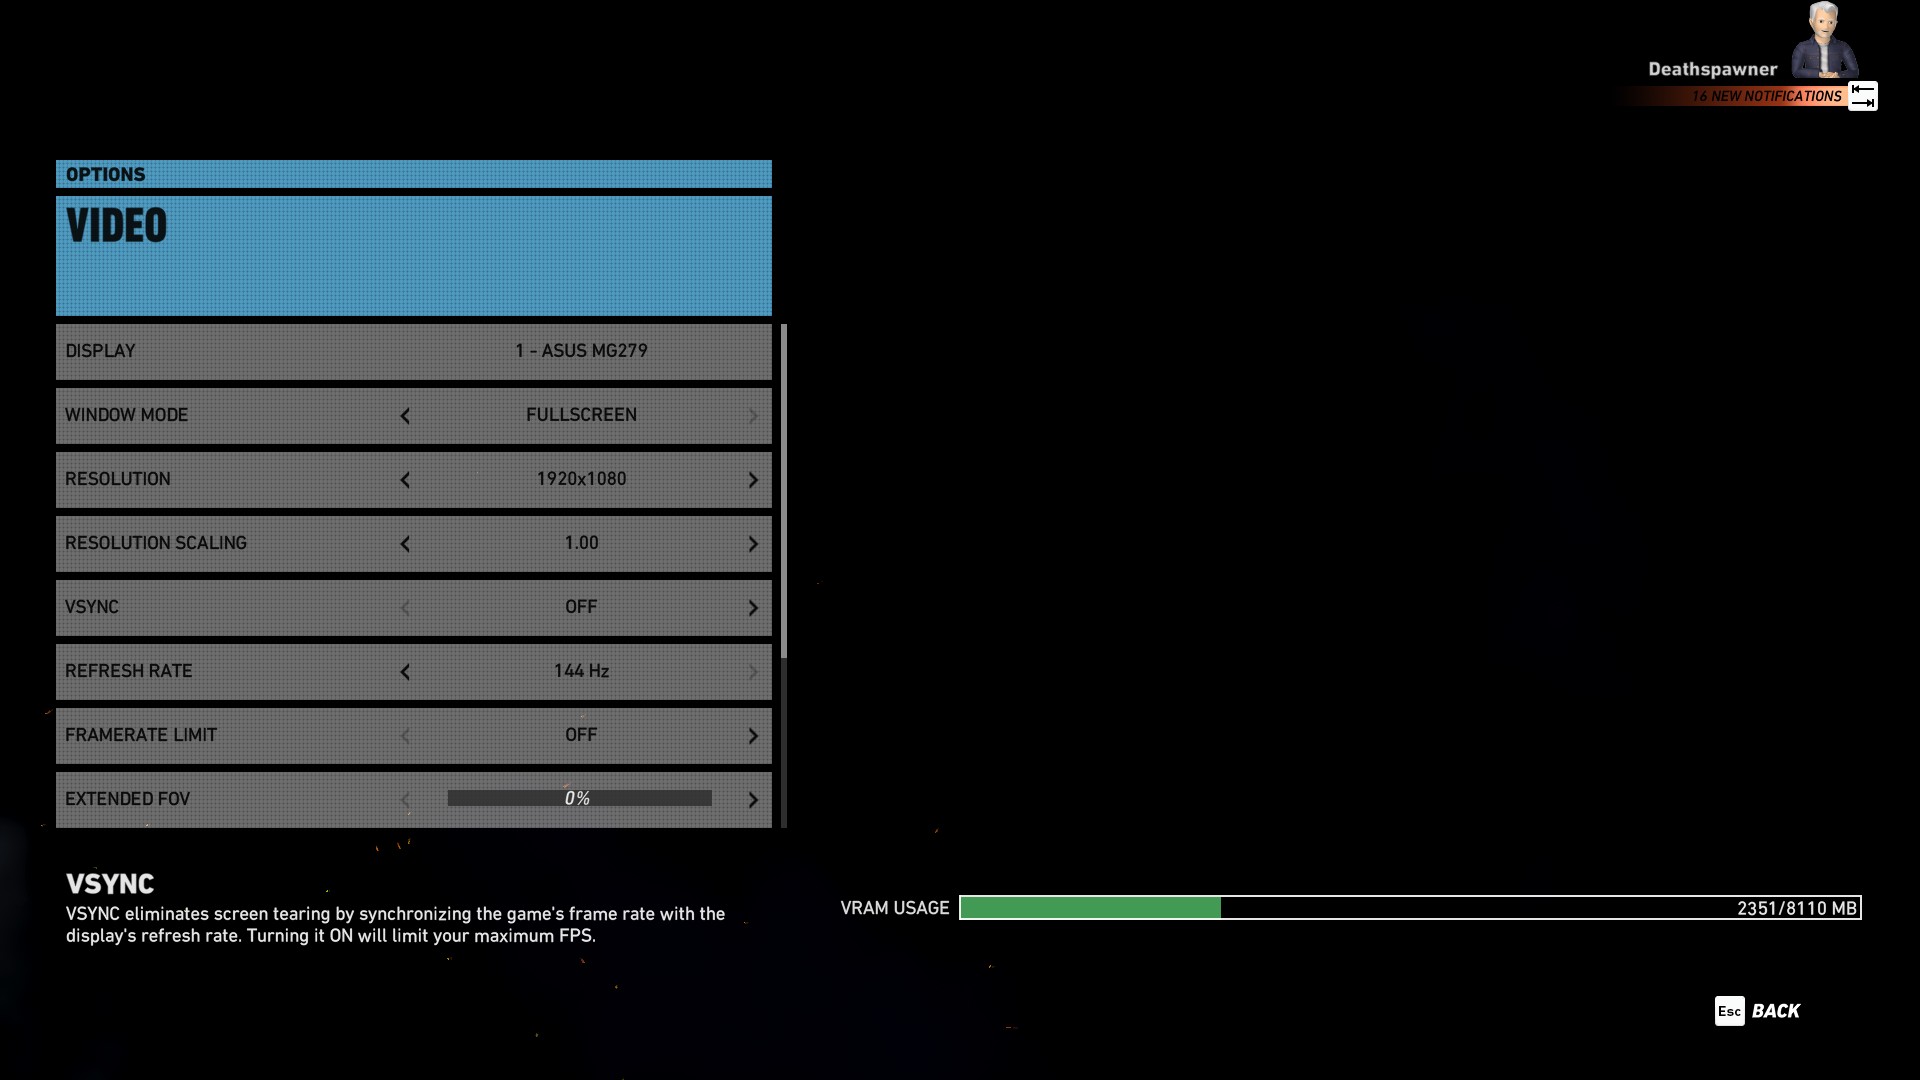
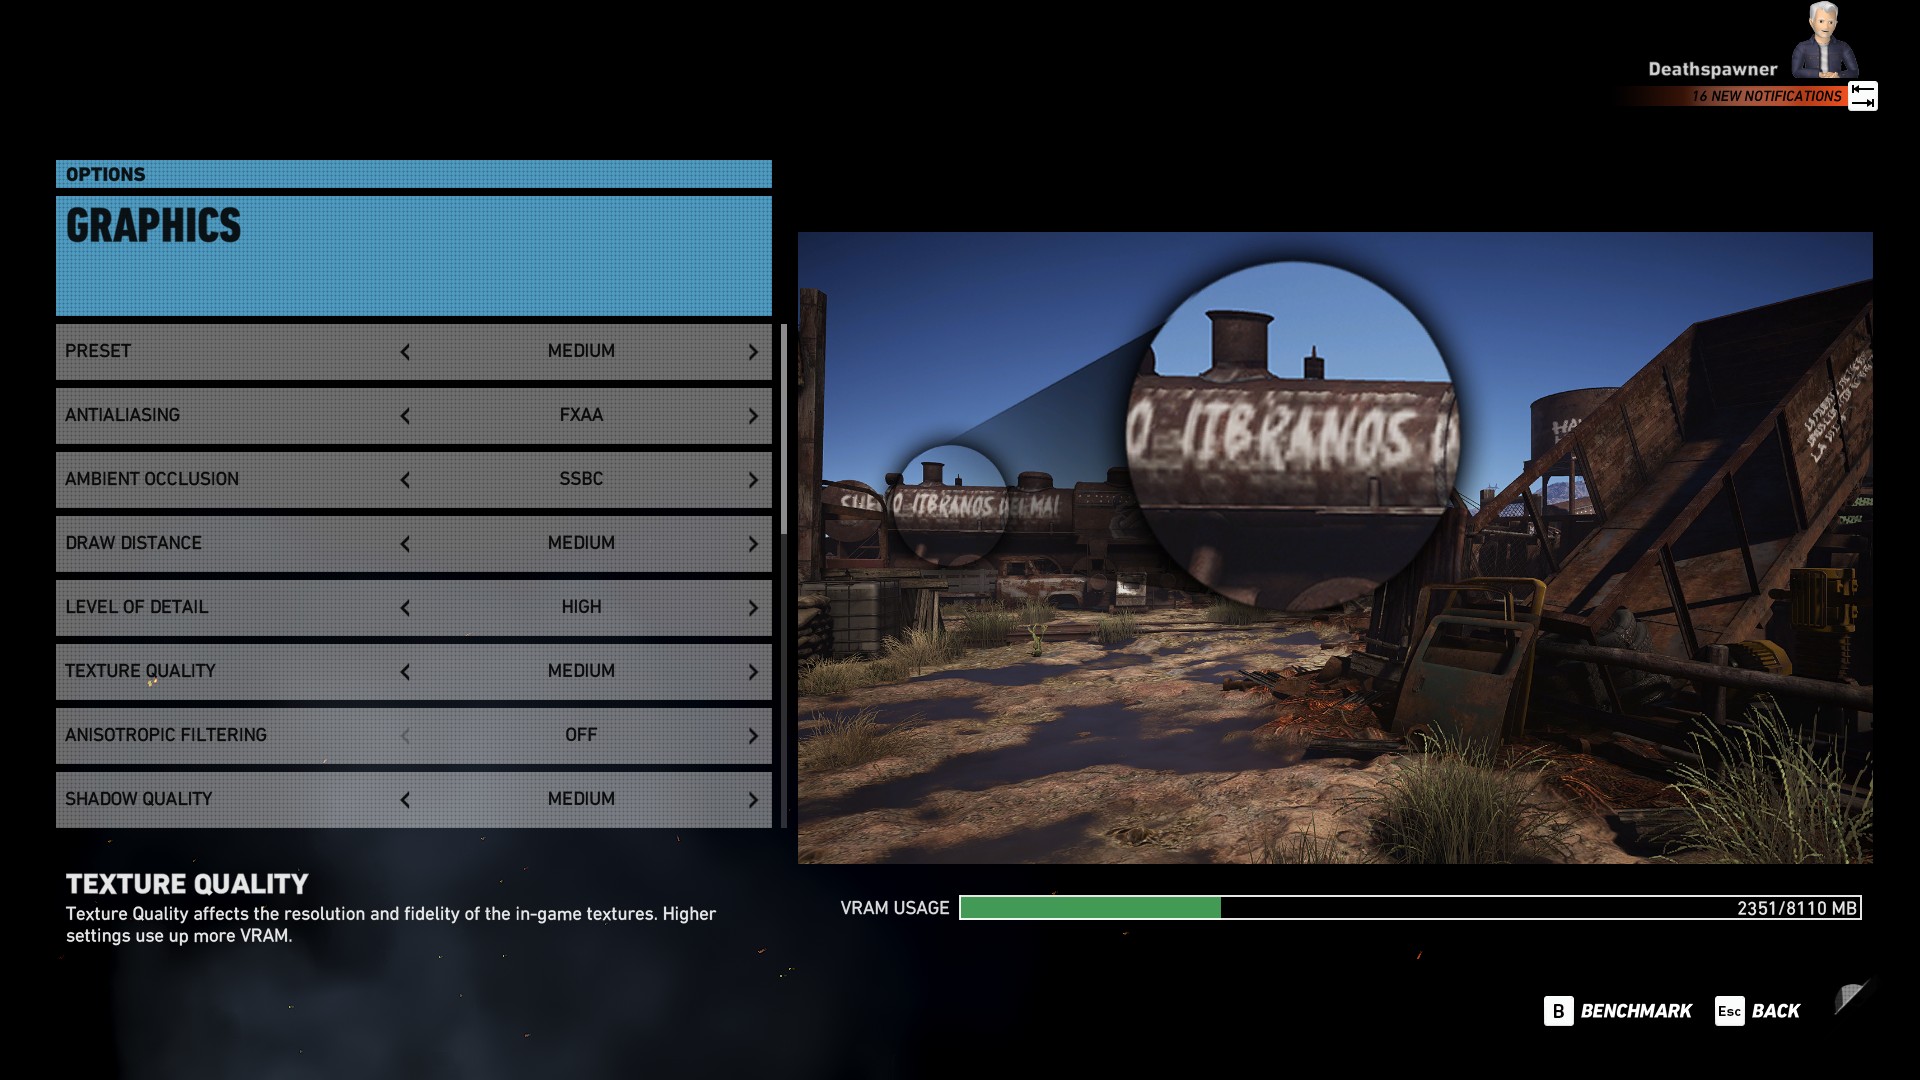
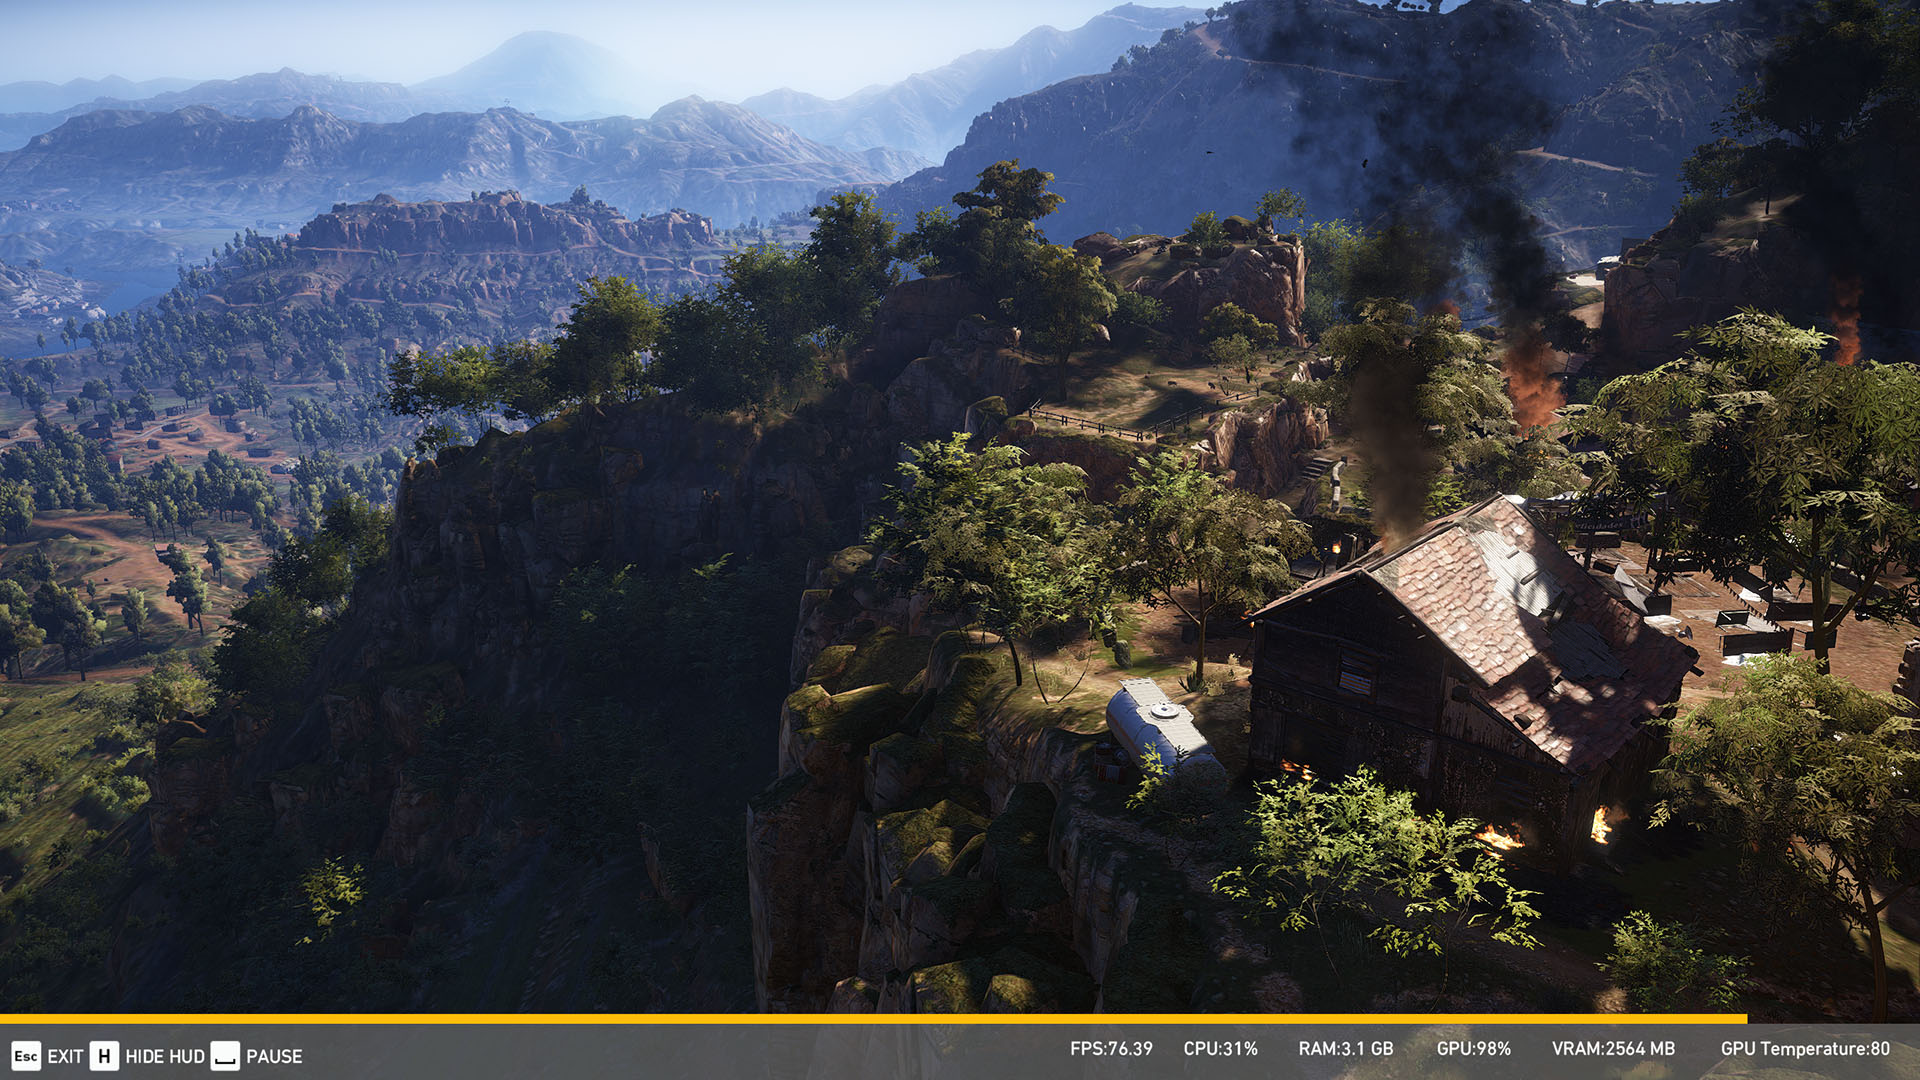
- Synthetic: Ghost Recon: Wildlands (CPU + GPU)
- Synthetic: Rise of the Tomb Raider (CPU + GPU)
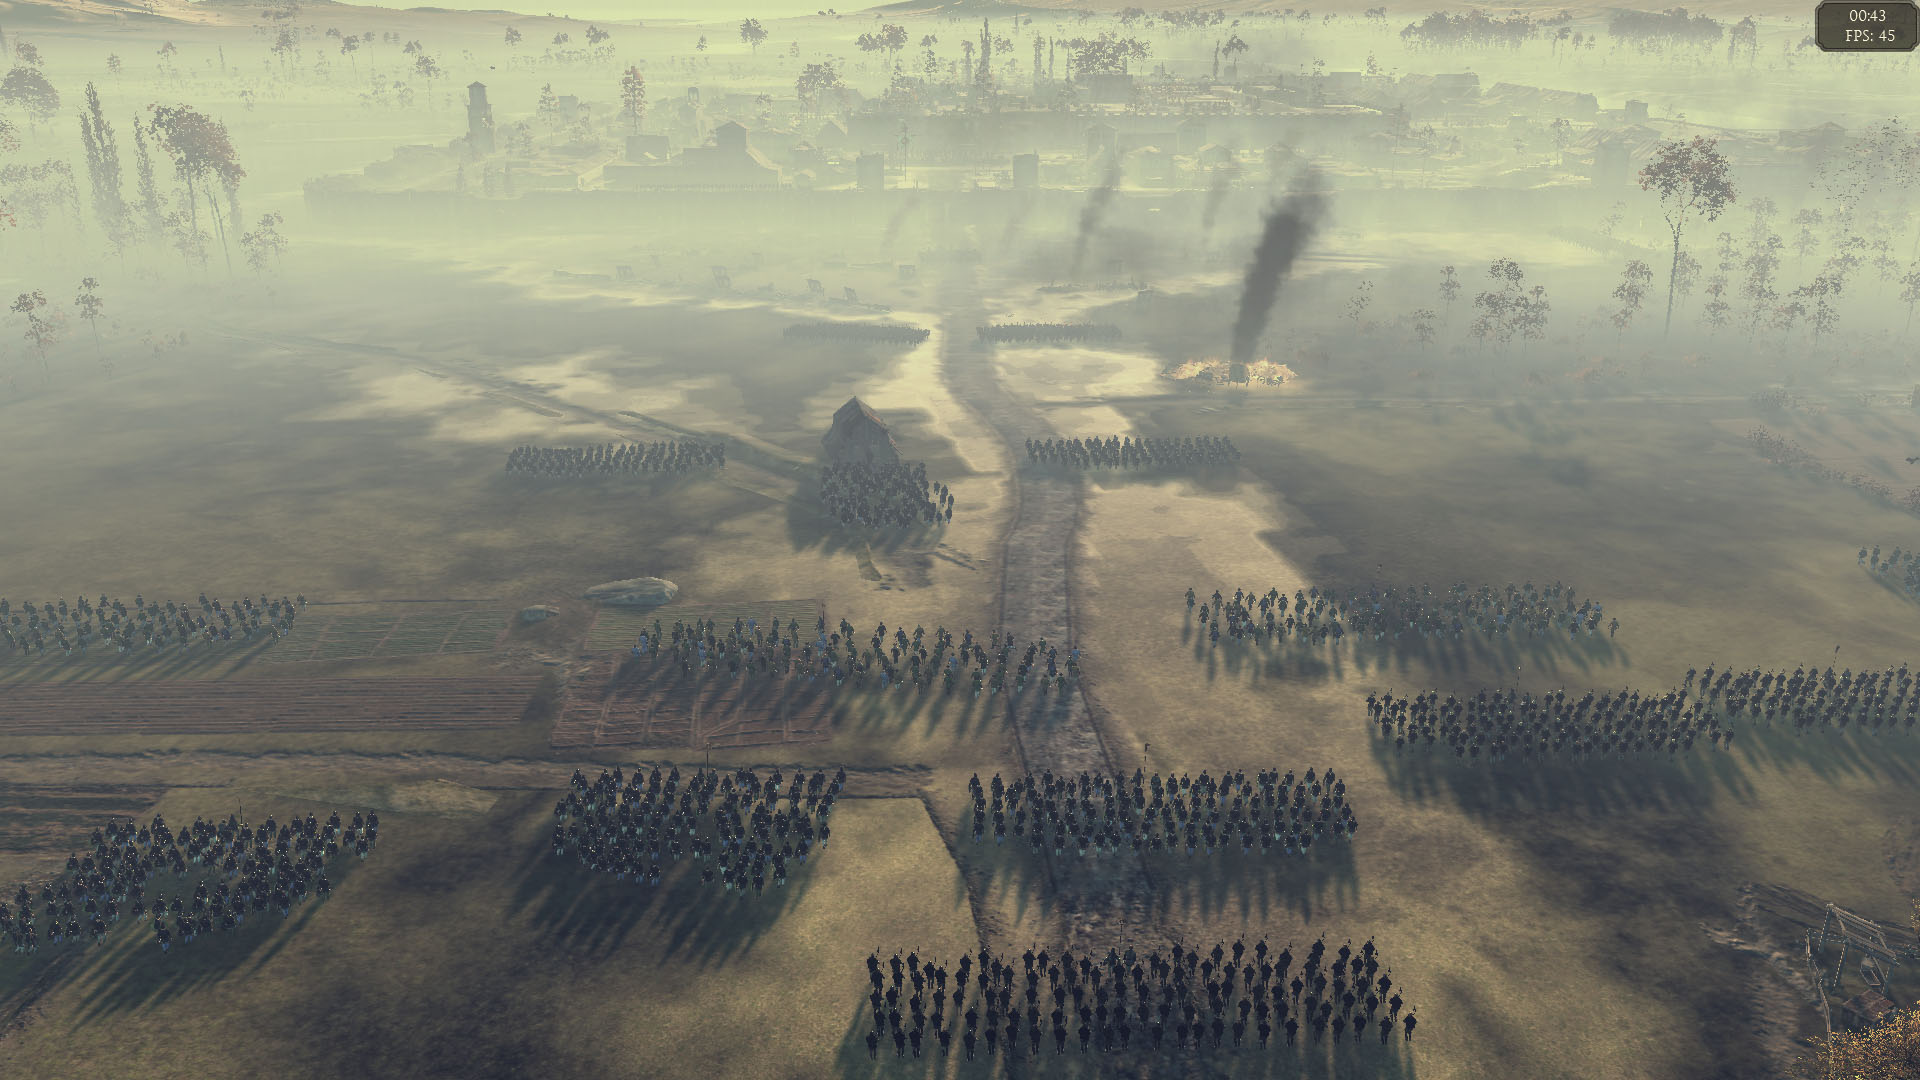
- Synthetic: Total War: ATTILA (CPU)
- Real-world: Watch Dogs 2 (CPU + GPU)
(Links go that benchmark)
Because Ashes offers the explicit ability to act only as a CPU benchmark, we opted to use that over the GPU version. The rest of the games aside from ATTILA are standard gaming benchmarks. While ATTILA can be used as a graphics benchmark, too, it’s incredibly CPU-bound, as the results will attest.
Linux Benchmarks
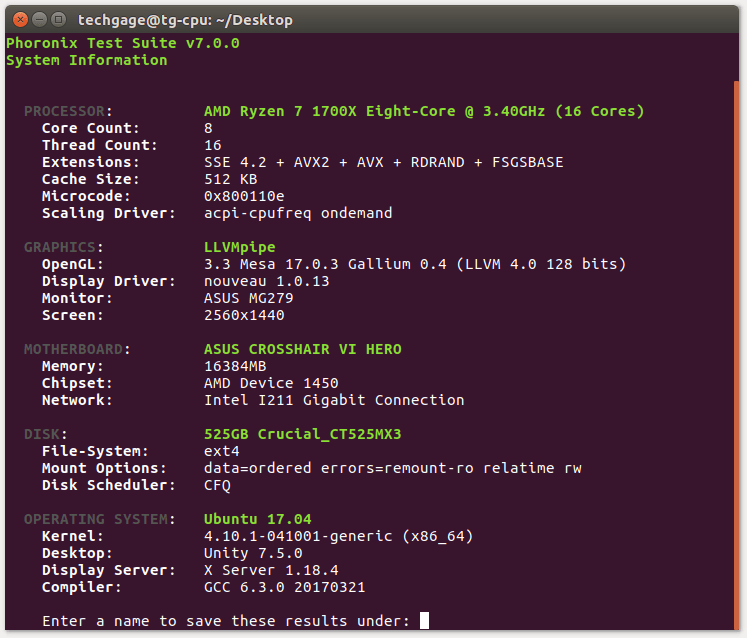
Ubuntu 17.04 is the OS of choice for our test bed, as it’s both simple to setup, and so de facto that everyone reading the results should feel at home. The OS is left as stock as possible, with the screen timeout disabled and open source Nouveau graphics driver used over the proprietary NVIDIA one.
- Rendering: Blender
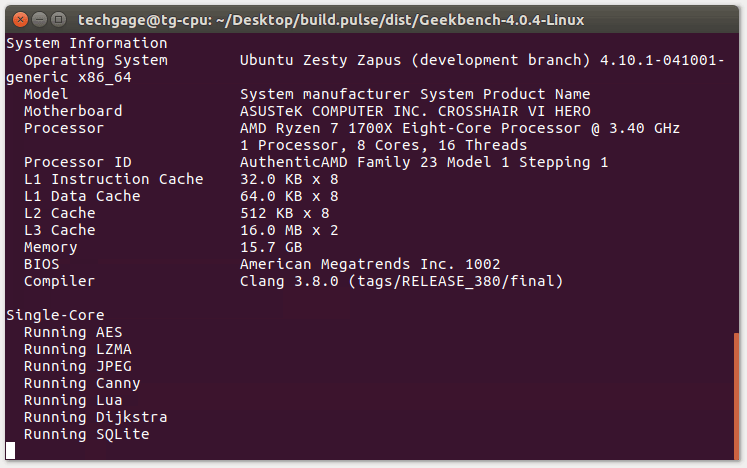
- System: GeekBench
- Media: HandBrake
- System: Phoronix Test Suite
(Links go that benchmark)
Both the Blender and HandBrake tests are shared with the Windows testing. Examples of the performance differences between two OS versions can be seen on the results page. Phoronix Test Suite is used for the bulk of our Linux testing, as it supplies the tests we need, and makes them easy to use.
If you think there’s some information lacking on this page, or you simply want clarification on anything in particular, don’t hesitate to leave a comment.
Support our efforts! With ad revenue at an all-time low for written websites, we're relying more than ever on reader support to help us continue putting so much effort into this type of content. You can support us by becoming a Patron, or by using our Amazon shopping affiliate links listed through our articles. Thanks for your support!


