- Qualcomm Launches Snapdragon 4 Gen 2 Mobile Platform
- AMD Launches Ryzen PRO 7000 Series Mobile & Desktop Platform
- Intel Launches Sleek Single-Slot Arc Pro A60 Workstation Graphics Card
- NVIDIA Announces Latest Ada Lovelace Additions: GeForce RTX 4060 Ti & RTX 4060
- Maxon Redshift With AMD Radeon GPU Rendering Support Now Available
Social & RSS Feeds
Latest Videos


Latest News
Battle of the 16-cores: Intel’s Core i9-7960X vs. AMD’s Threadripper 1950X
by Rob Williams on January 6, 2018 in Processors
It still feels a little hard to believe, but both AMD and Intel offer the enthusiast market their own take on a 16-core chip. Remember when quad-cores seemed overkill for desktops? At the top-end, the CPU you choose can greatly affect your workload for better or for worse. So, let’s see what these beefy chips are made of.
Page 2 – Test Systems & Methodologies
Benchmarking a CPU may sound like a simple enough task, but in order to deliver accurate, repeatable results, and not to mention results that don’t favor one vendor over another, strict guidelines need to be adhered to. That in turn makes for rigorous, time-consuming testing, but we feel that the effort is worth it.
This page exists so that we can be open about how we test, and give those who care about testing procedures an opportunity to review our methodology before flaming us in the comments. Here, you can see a breakdown of all of our test machines, specifics about the tests themselves, and other general information that might be useful.
Let’s start with a look at the test platforms, for AMD’s TR4, and Intel’s LGA2011-v3. We’re in the process of benchmarking every current-gen chip we have over, so for now, only six CPUs are included in these results.
The focus of this article is to compare the 16-core options from AMD and Intel, but since baselines are useful, a quad-, eight-, and ten-core have also been tested to see how our tests scale their way upward. Intel’s 18-core has also been included for good measure – and because it was the first chip tested.
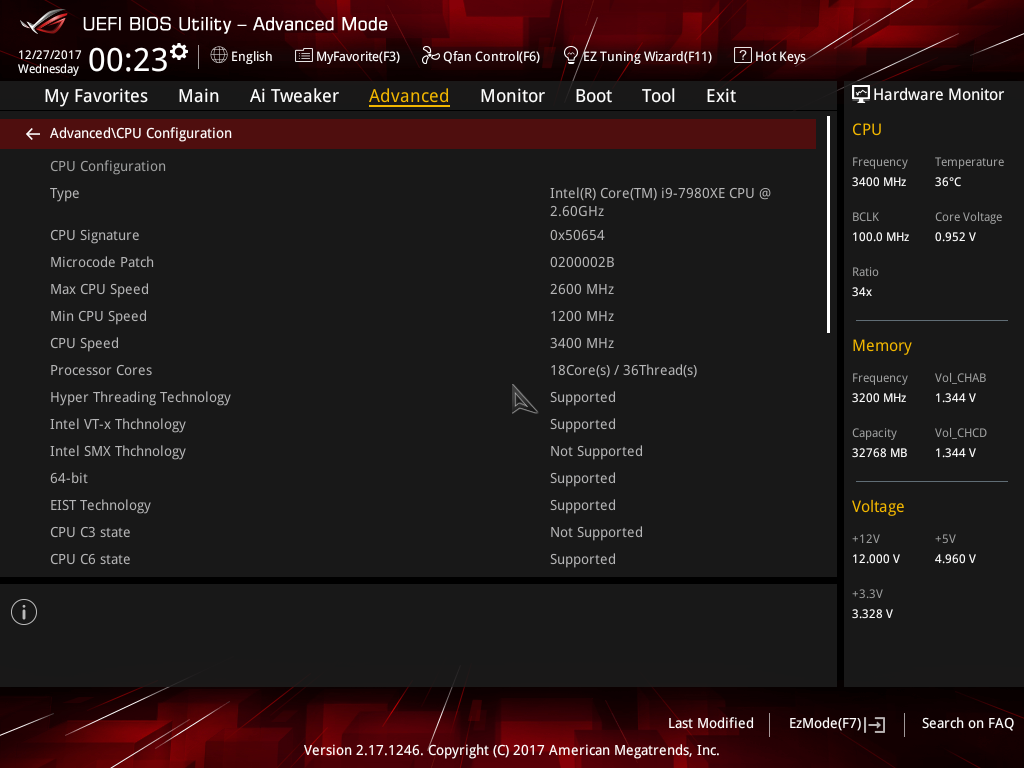
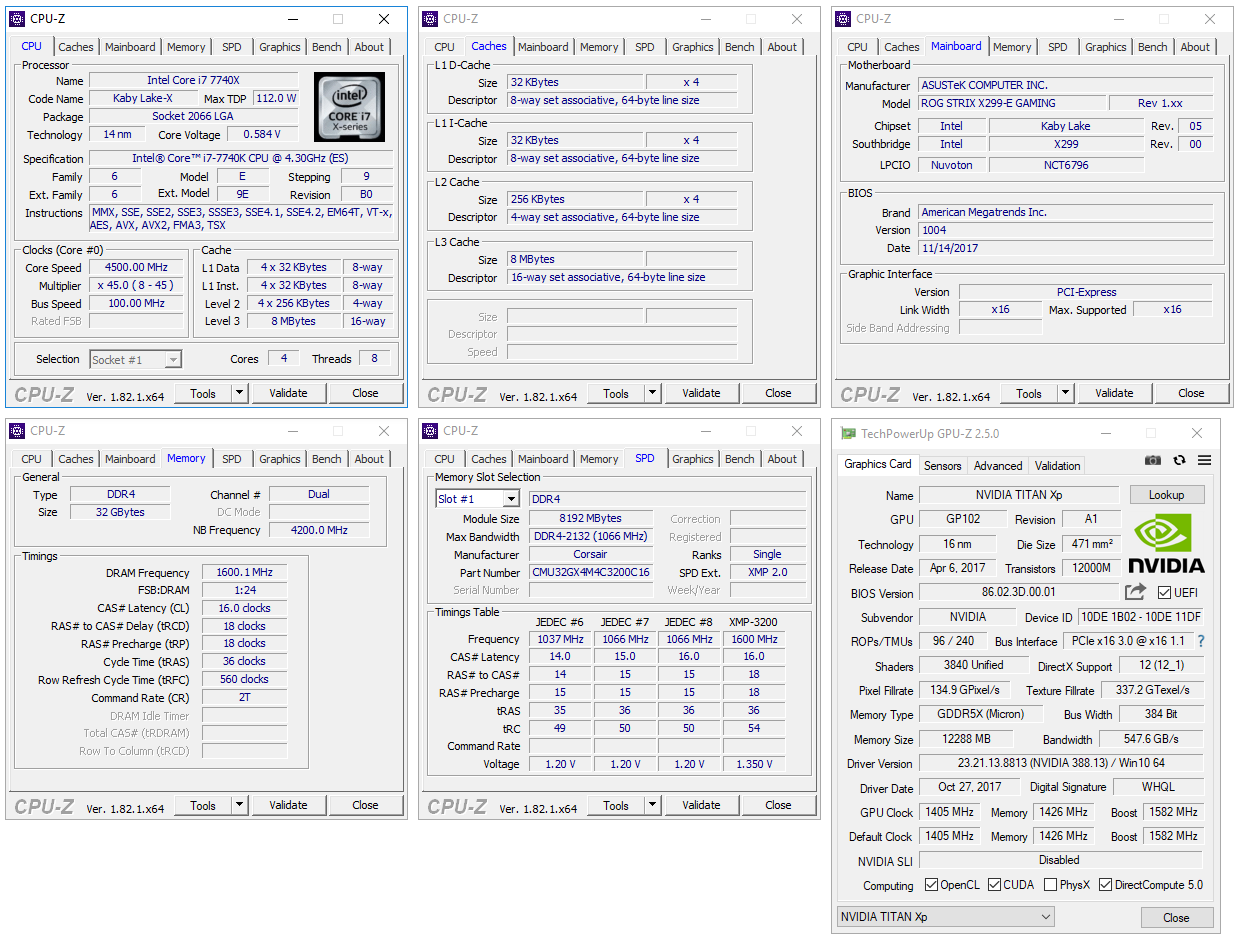
To prevent unexpected performance results, the “Multi-Core Enhancement” optimizations (effectively overclocking all cores to max turbo, instead of just two cores) offered by ASUS and GIGABYTE on their respective motherboards is disabled. All of the CPUs have been tested with the same memory modules, clocked at the same DDR4-3200 with 16-18-18 timings. The only caveat is with the odd duck i7-7740X, which is stuck to a dual-channel controller.
Techgage’s CPU Testing Platforms
| AMD TR4 Test Platform | |
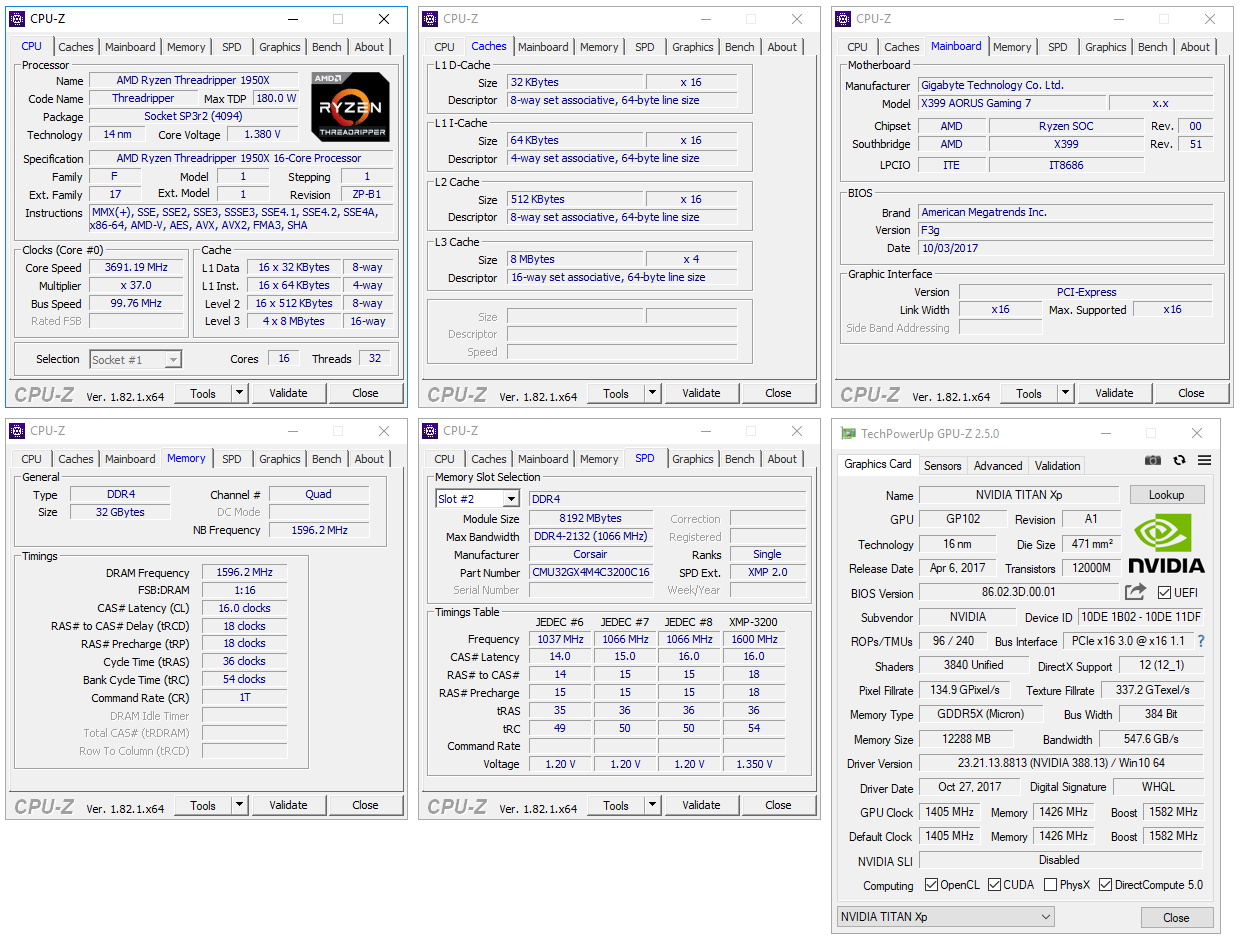
| Processor | AMD Ryzen Threadripper 1950X (3.4GHz, 8C/16T) |
| Motherboard | GIGABYTE X399 AORUS Gaming 7 CPU tested with BIOS F3g (Oct 13, 2017) |
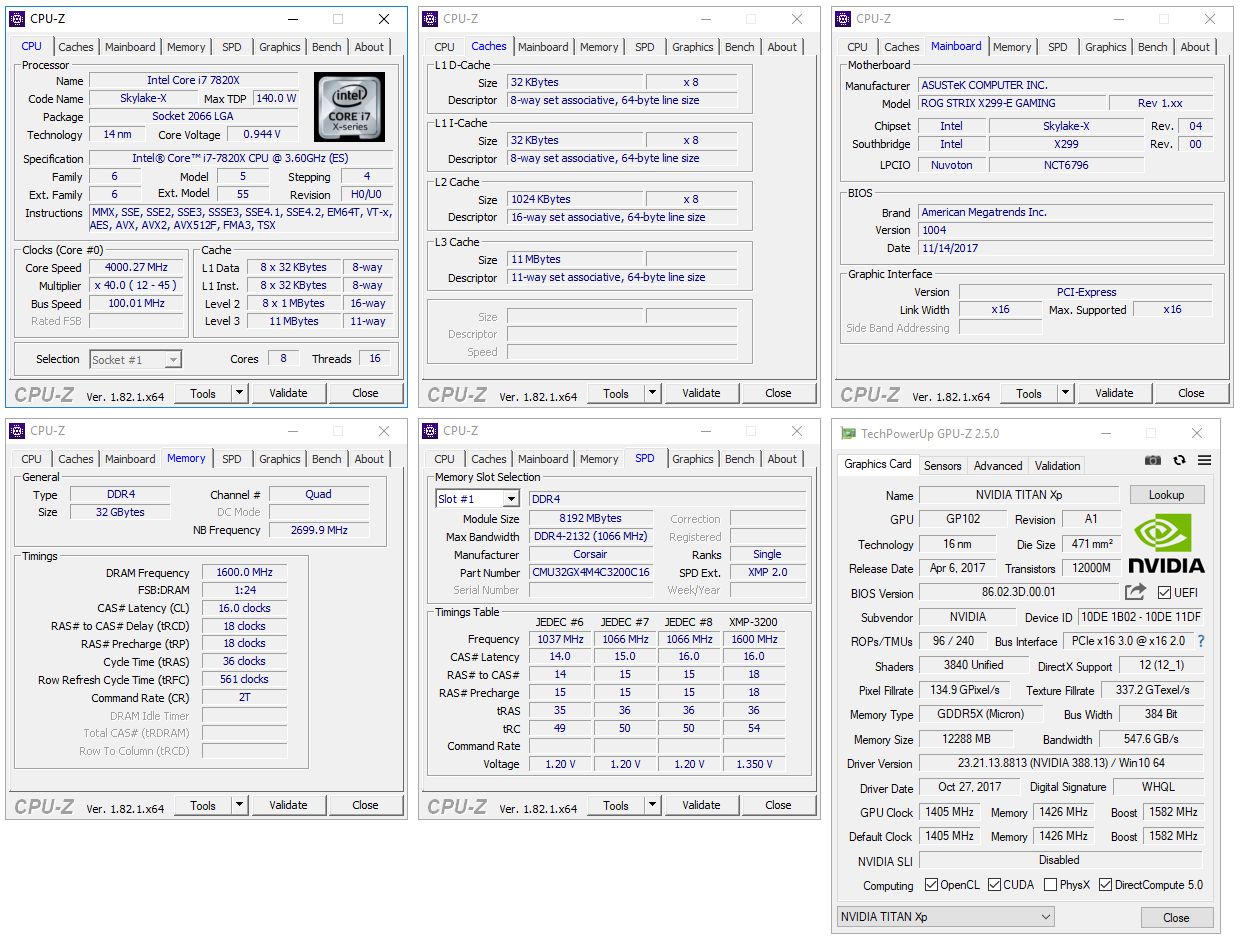
| Memory | Corsair VENGEANCE RGB (CMU32GX4M4C3200C16) 8GB x 4 Operates at DDR4-3200 16-18-18-36 (1.35V) |
| Graphics | NVIDIA TITAN Xp (12GB; GeForce 388.13) |
| Storage | Crucial MX300 525GB (SATA 6Gbps) |
| Power Supply | Enermax RevoBron 80+ Bronze (600W) |
| Chassis | Enermax Equilence |
| Cooling | Enermax Liqtech TR4 AIO (240mm) |
| Et cetera | Windows 10 Pro (Build 16299), Ubuntu 17.10 (4.13 kernel) |
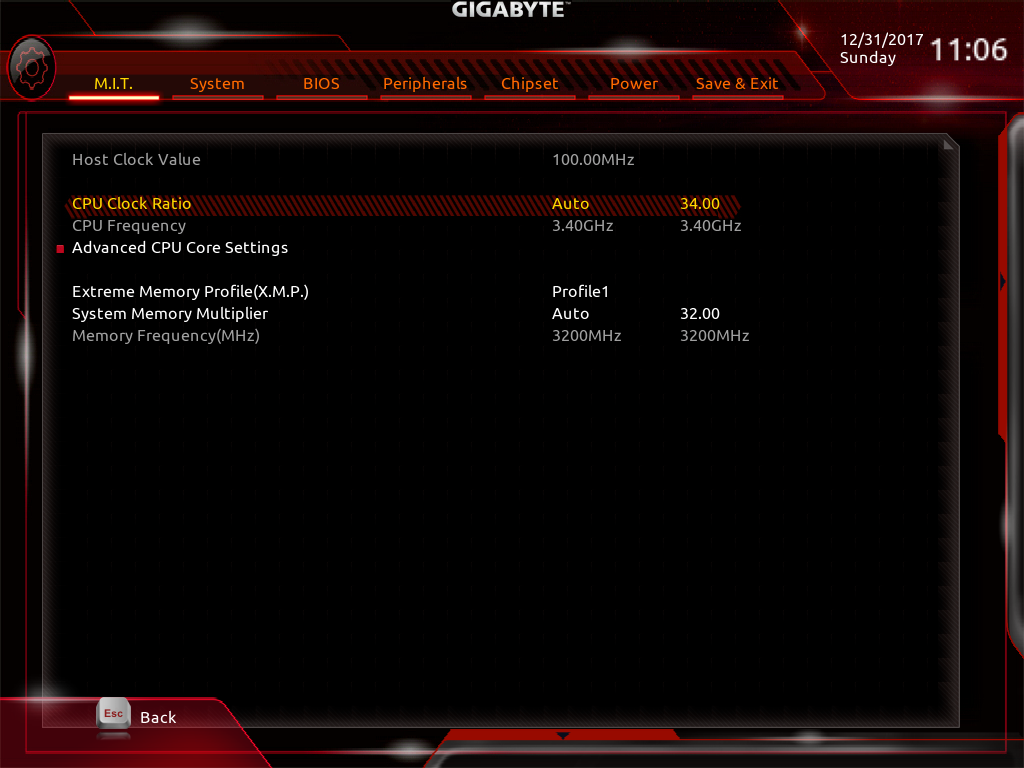

There’s not too much to say here, which is a good thing. While we didn’t find a huge difference to be made with the Core optimization left on (default), we disabled it to keep things as “reference” as possible. I truly dislike the EFI GIGABYTE has equipped on this board, as it’s pretty clunky, and in my opinion, disorganized. But, where it lacks in EFI polish, the board has made up for in stability.
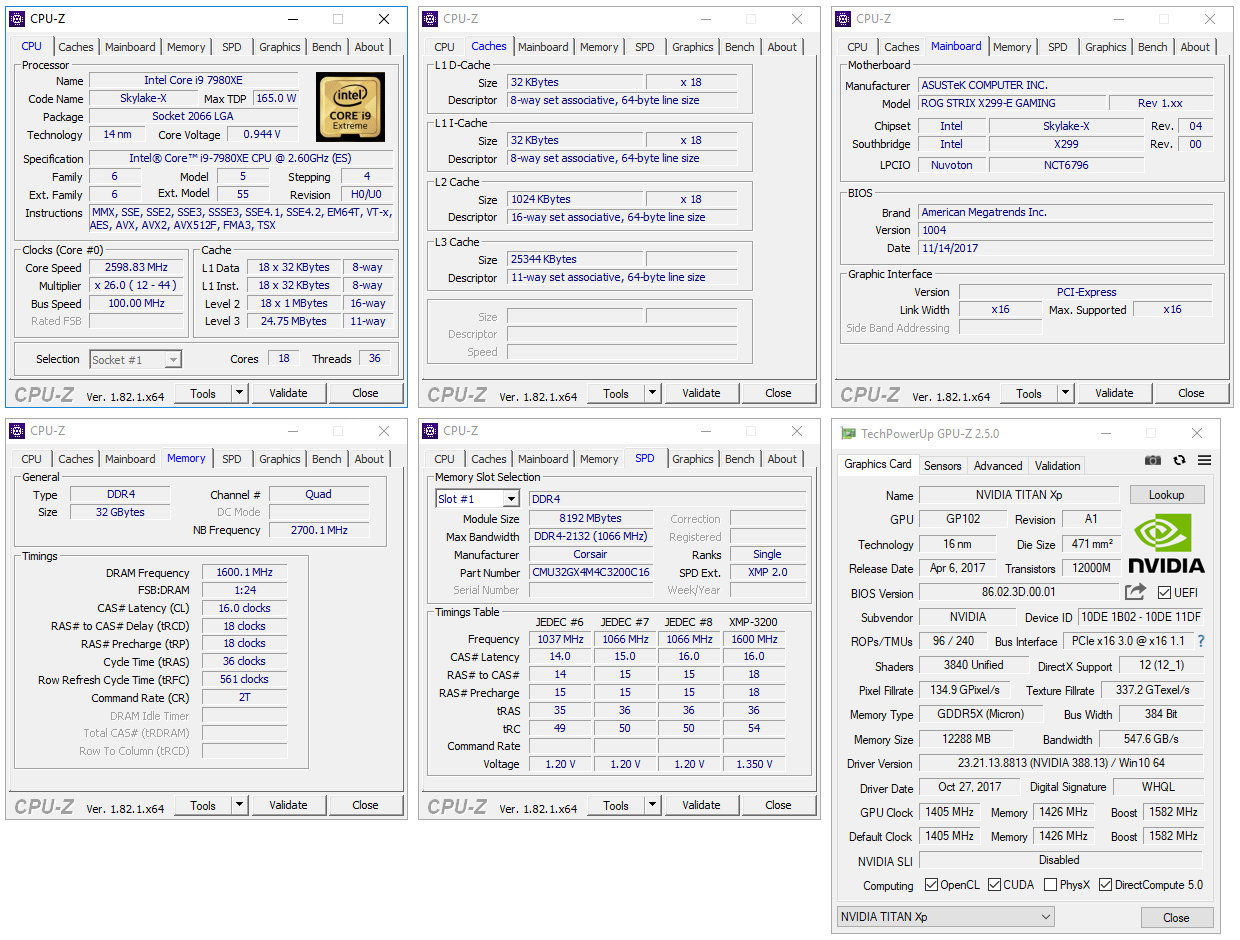
| Intel LGA2011-3 Test Platform | |
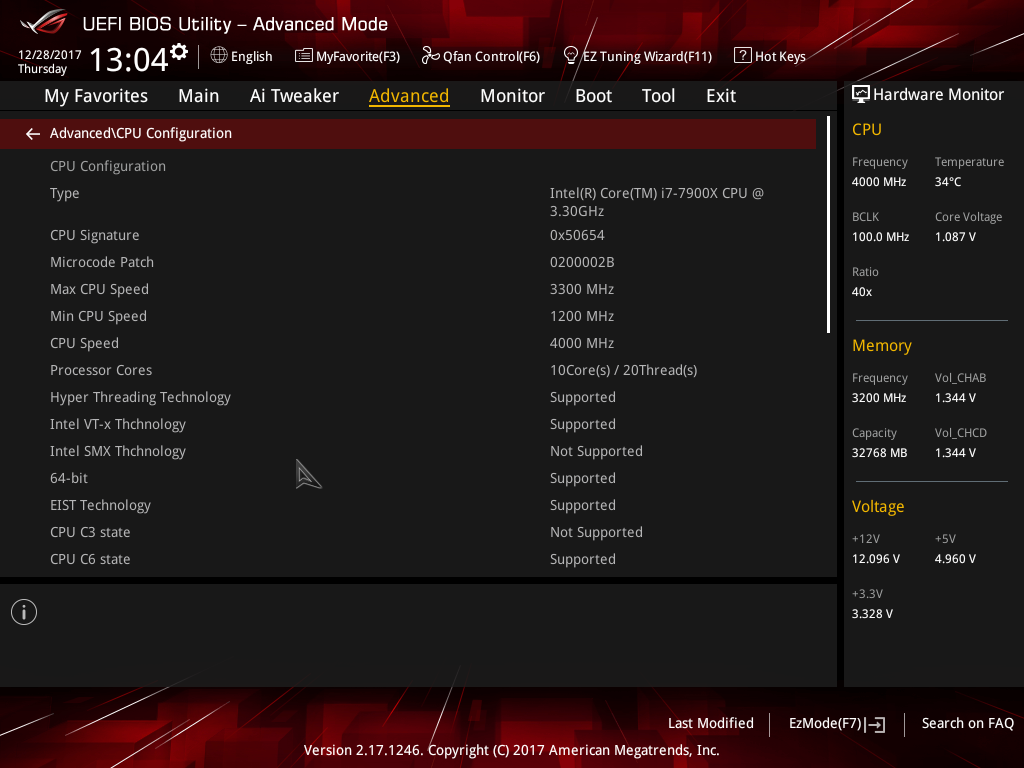
| Processors | Intel Core i9-7980XE (2.6GHz, 18C/36T) Intel Core i9-7960X (2.8GHz, 16C/32T) Intel Core i9-7900X (3.3GHz, 10C/20T) Intel Core i7-7820X (3.6GHz, 8C/16T) Intel Core i7-7740X (4.3GHz, 4C/8T) |
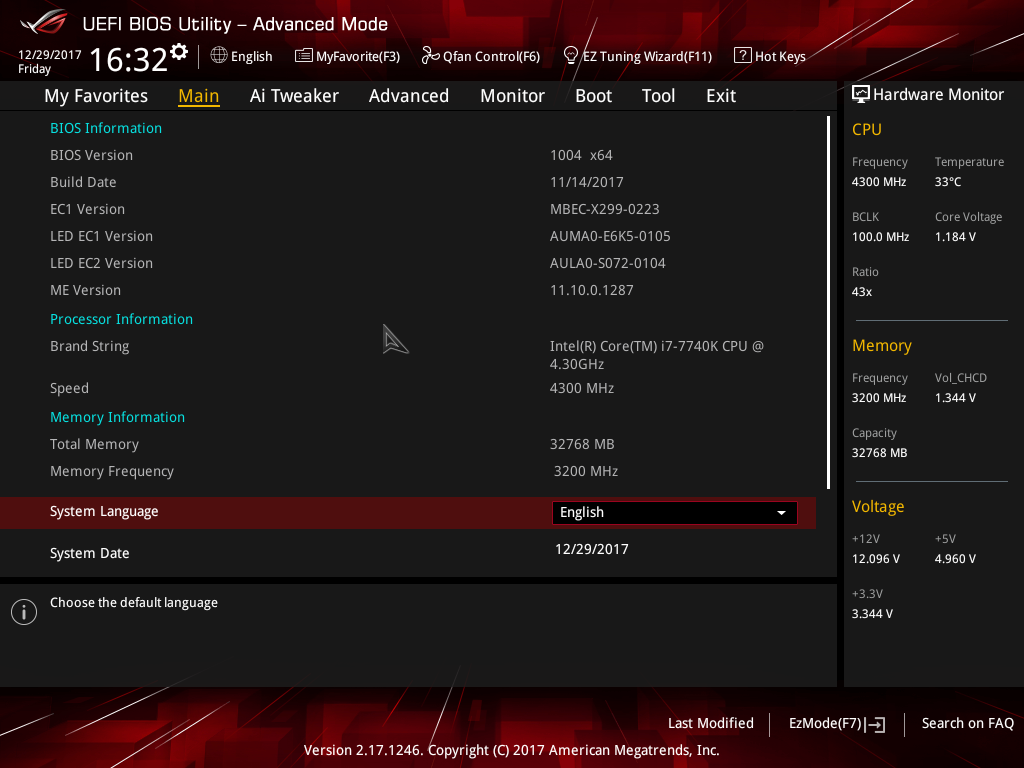
| Motherboard | ASUS ROG STRIX X299-E GAMING CPU tested with BIOS 1004 (Nov 14, 2017) |
| Memory | Corsair VENGEANCE RGB (CMU32GX4M4C3200C16) 8GB x 4 Operates at DDR4-3200 16-18-18-36 (1.35V) |
| Graphics | NVIDIA TITAN Xp (12GB; GeForce 388.13) |
| Storage | Crucial MX300 525GB (SATA 6Gbps) |
| Power Supply | Corsair Professional Series Gold AX1200 (1200W) |
| Chassis | Corsair Carbide 600C |
| Cooling | NZXT Kraken X62 AIO (280mm) |
| Et cetera | Windows 10 Pro (Build 16299), Ubuntu 17.10 (4.13 kernel) |

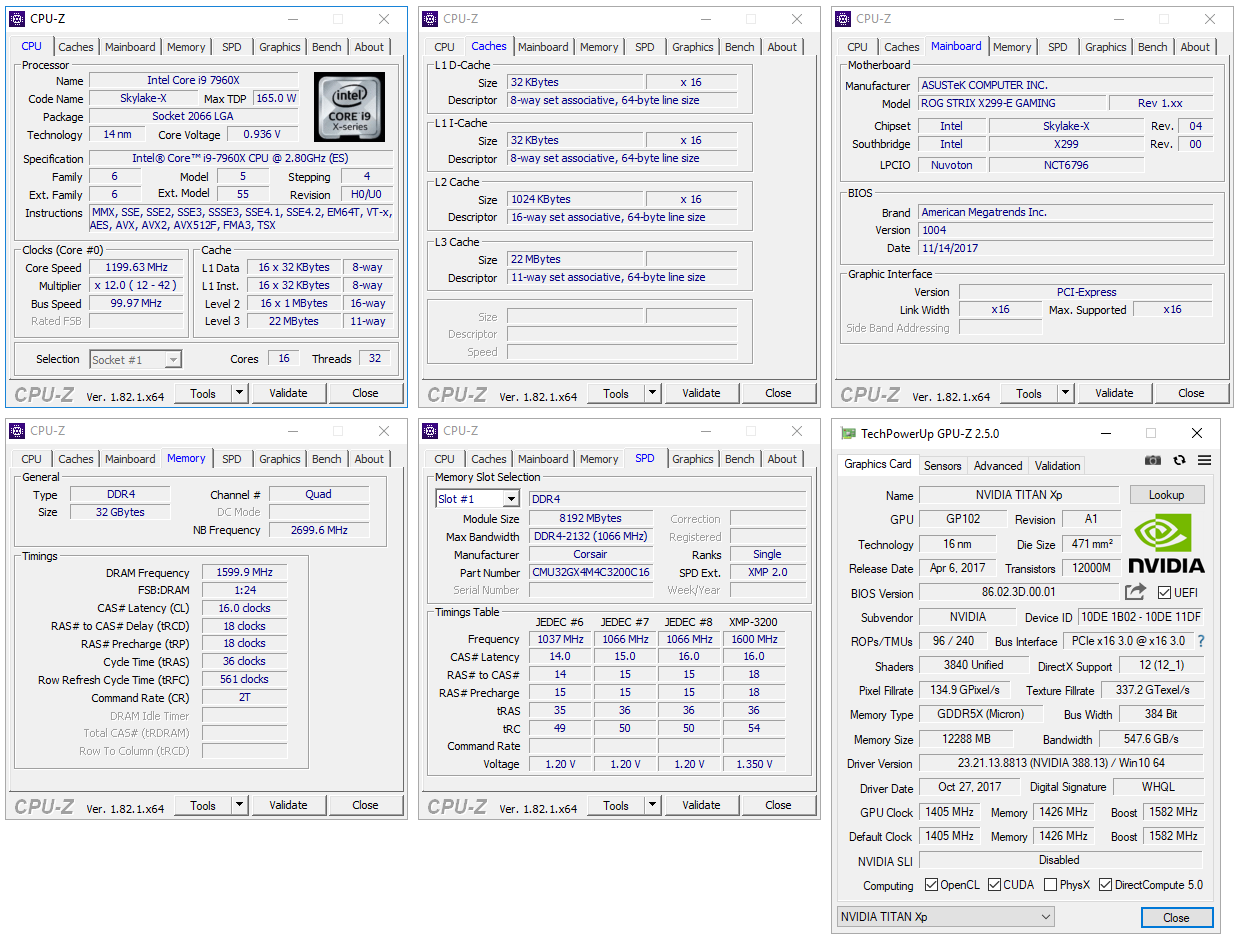


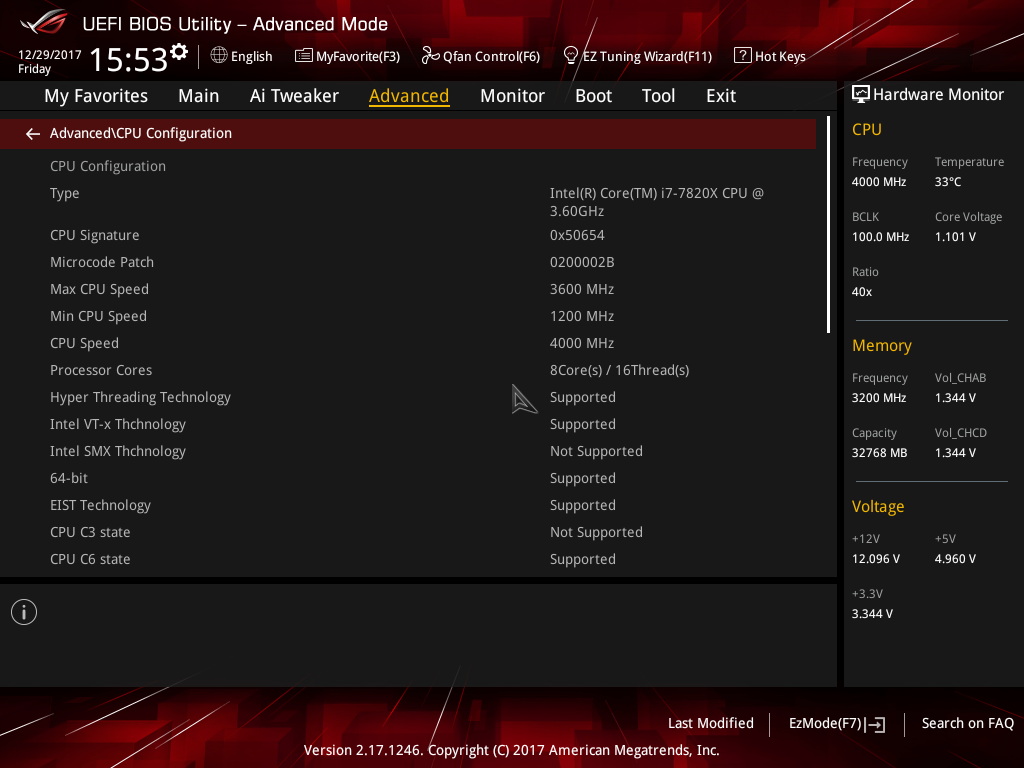


As with the TR4 platform, the Core “Enhancements” option is disabled on the LGA2011-v3 platform.
Windows Benchmarks
For the bulk of our testing, we use Windows 10 build 16299 with full updates as the base. After installation, LAN, audio, and chipset drivers are installed even if they are not explicitly needed (because Windows can use generic driver versions). Our basic guidelines beyond that are:
- Everything is disabled in “Customize settings” during OS install.
- 3D Vision and GeForce Experience are not installed with the graphics driver.
- Some services are disabled: search, User Account Control, Firewall, and Defender.
- The OneDrive app is changed to not start with Windows.
- The “Photos” app is removed, as it was found to hog CPU in the background
PowerShell: Get-AppxPackage *photos* | Remove-AppxPackage - The “Performance” power profile is used, with screen timeouts disabled.
- All notifications are disabled through the Settings screen.
- Desktop resolution is run at 2560×1440.
- Testing doesn’t begin until the PC is idle (keeps a steady minimum wattage).


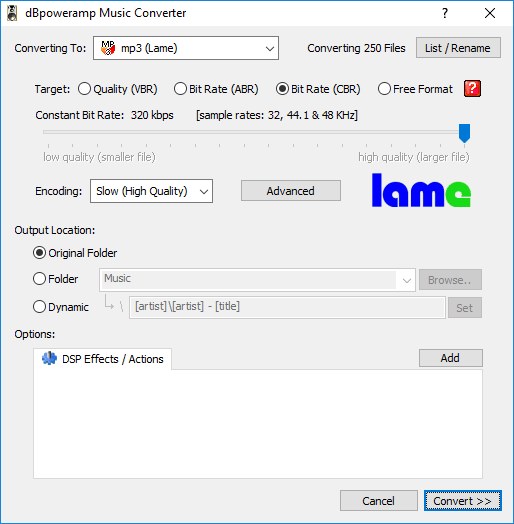
dBpoweramp R15.1


- Media: Adobe Lightroom
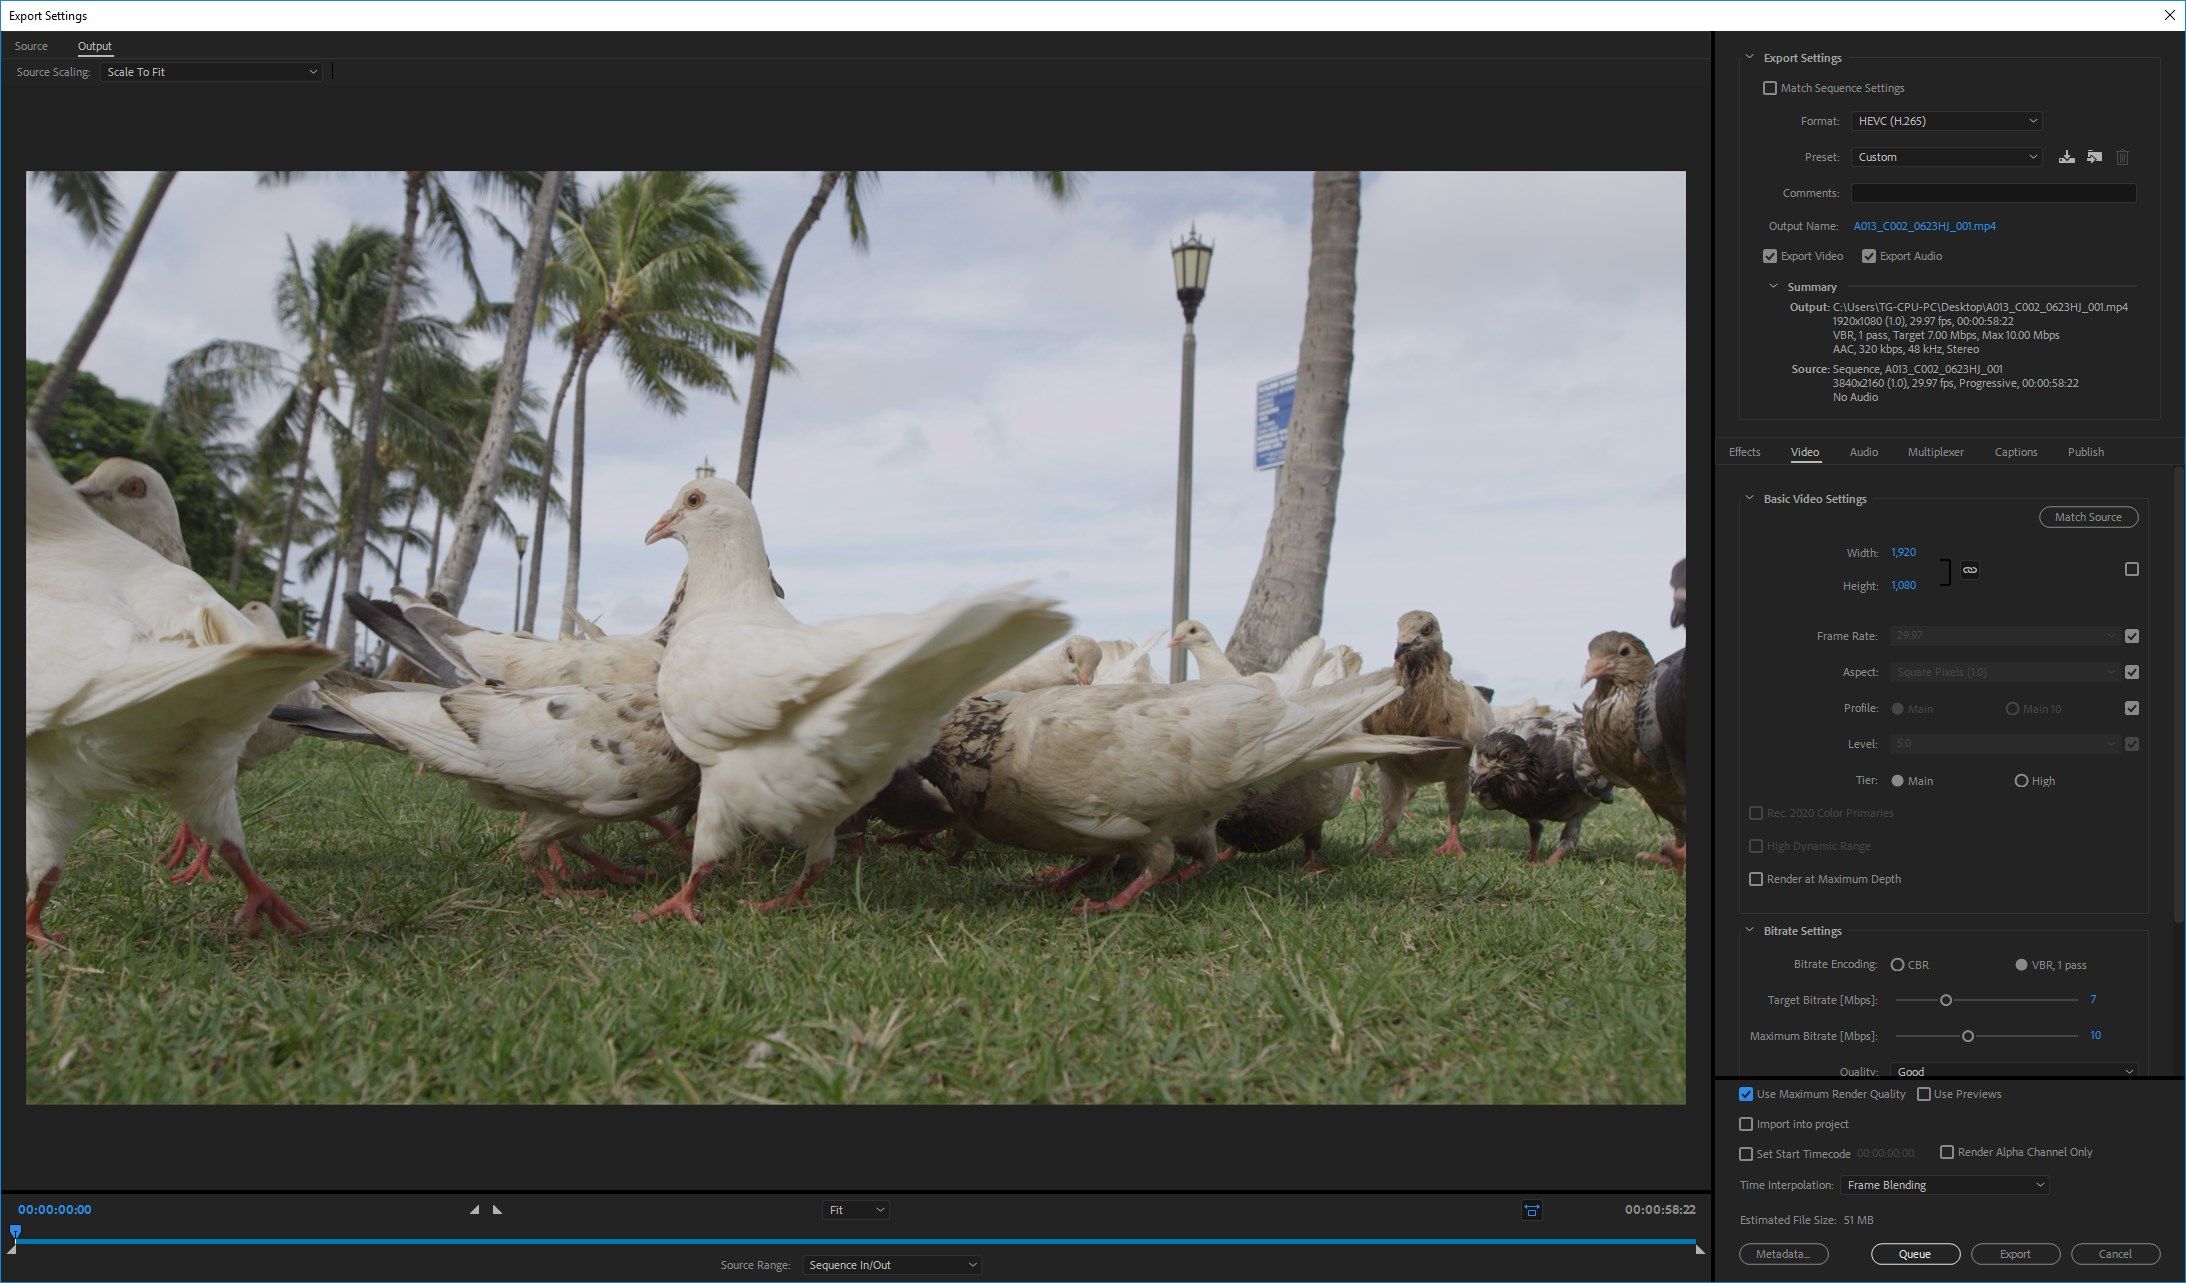
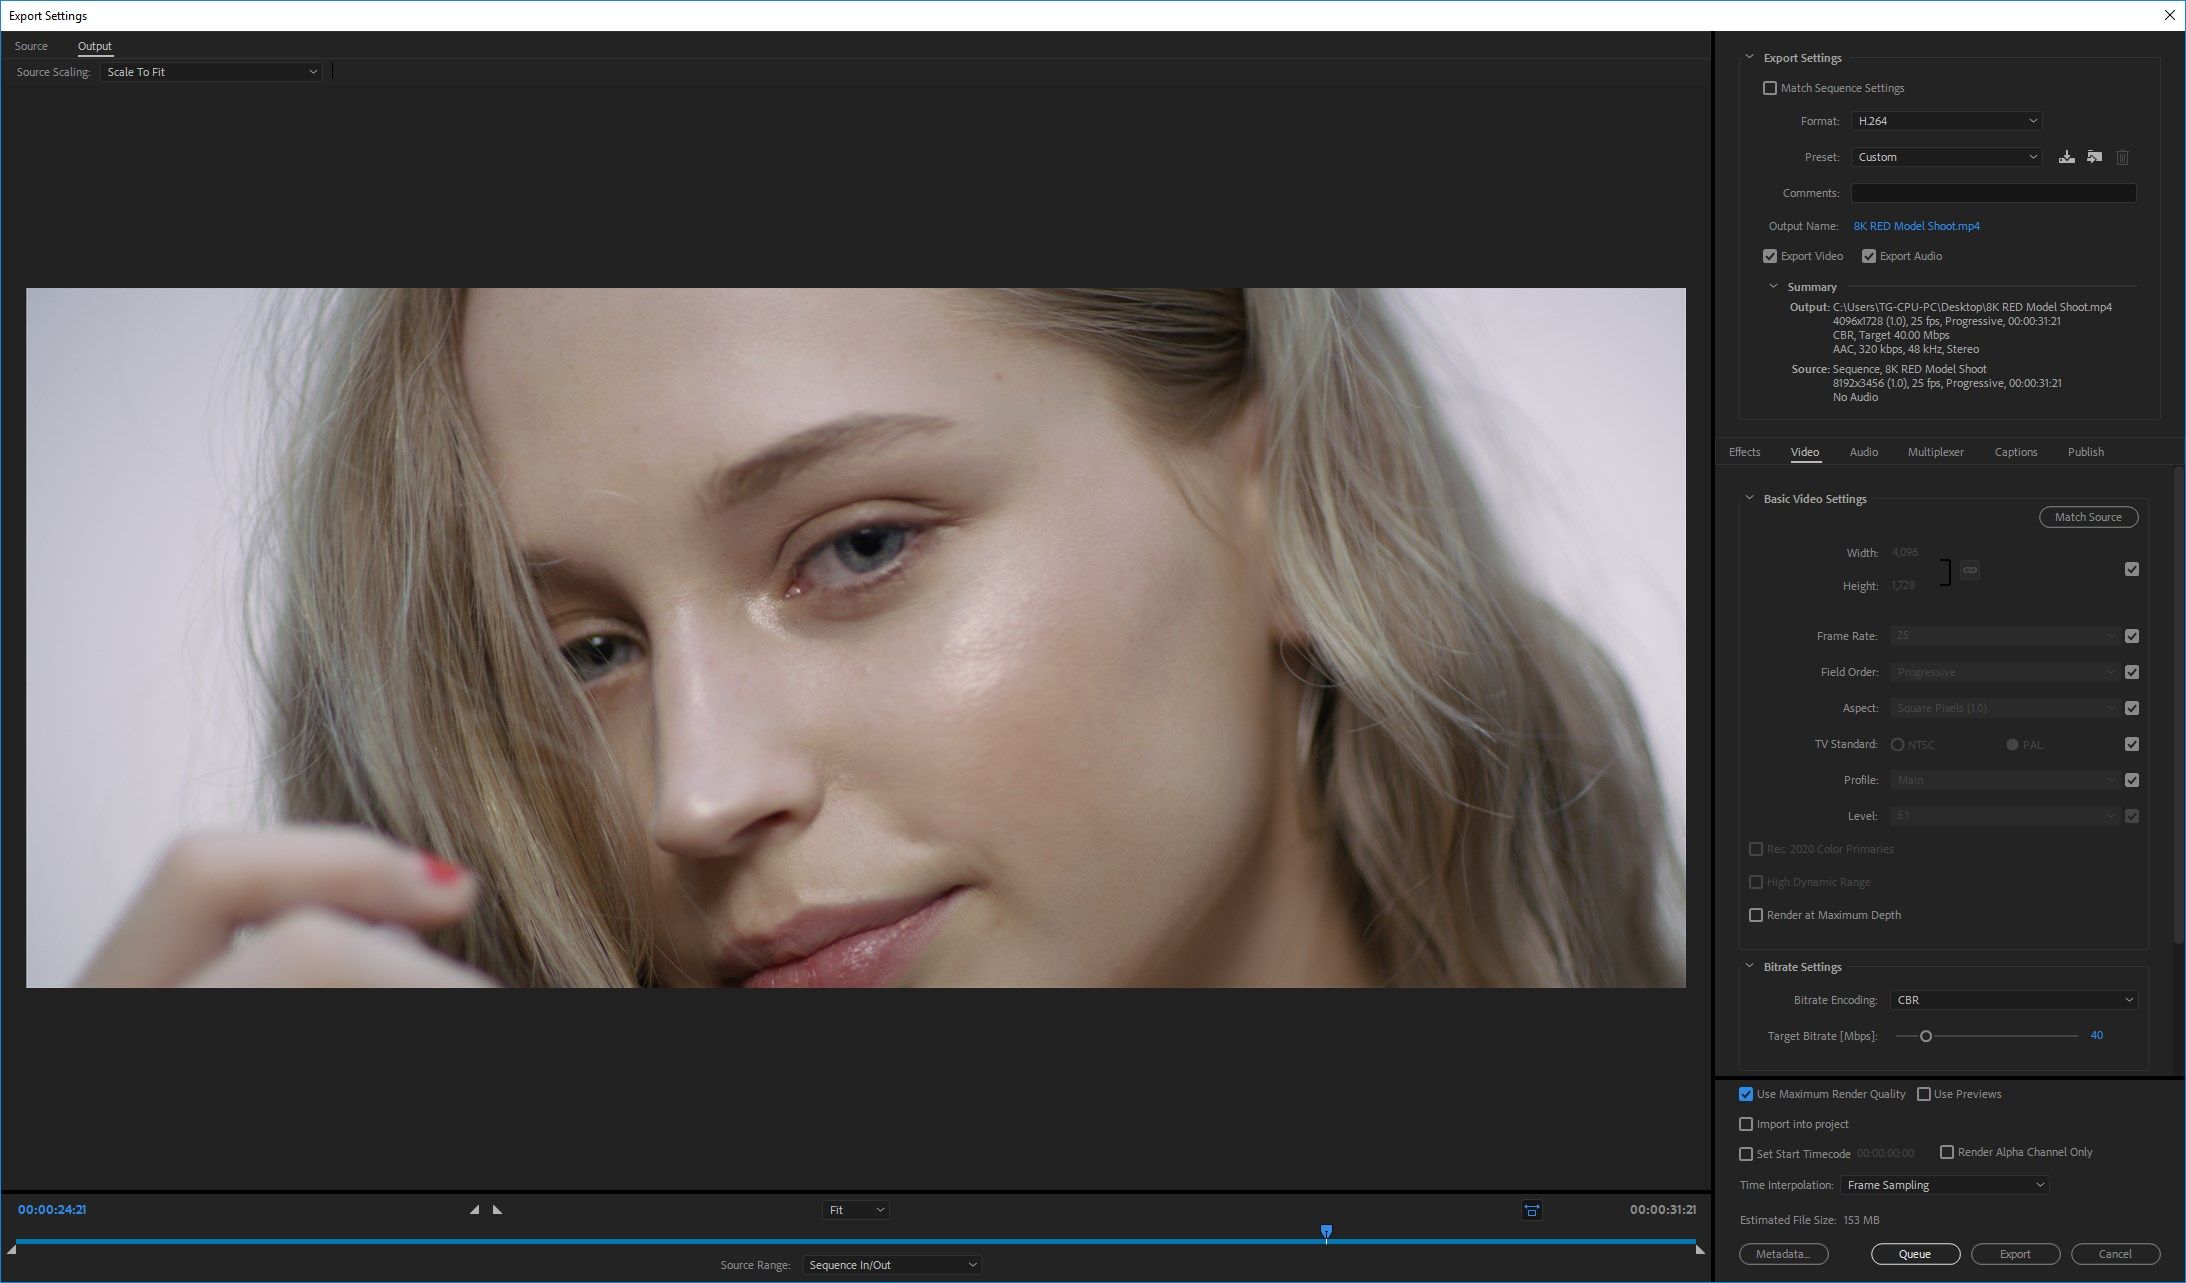
- Media: Adobe Premiere Pro
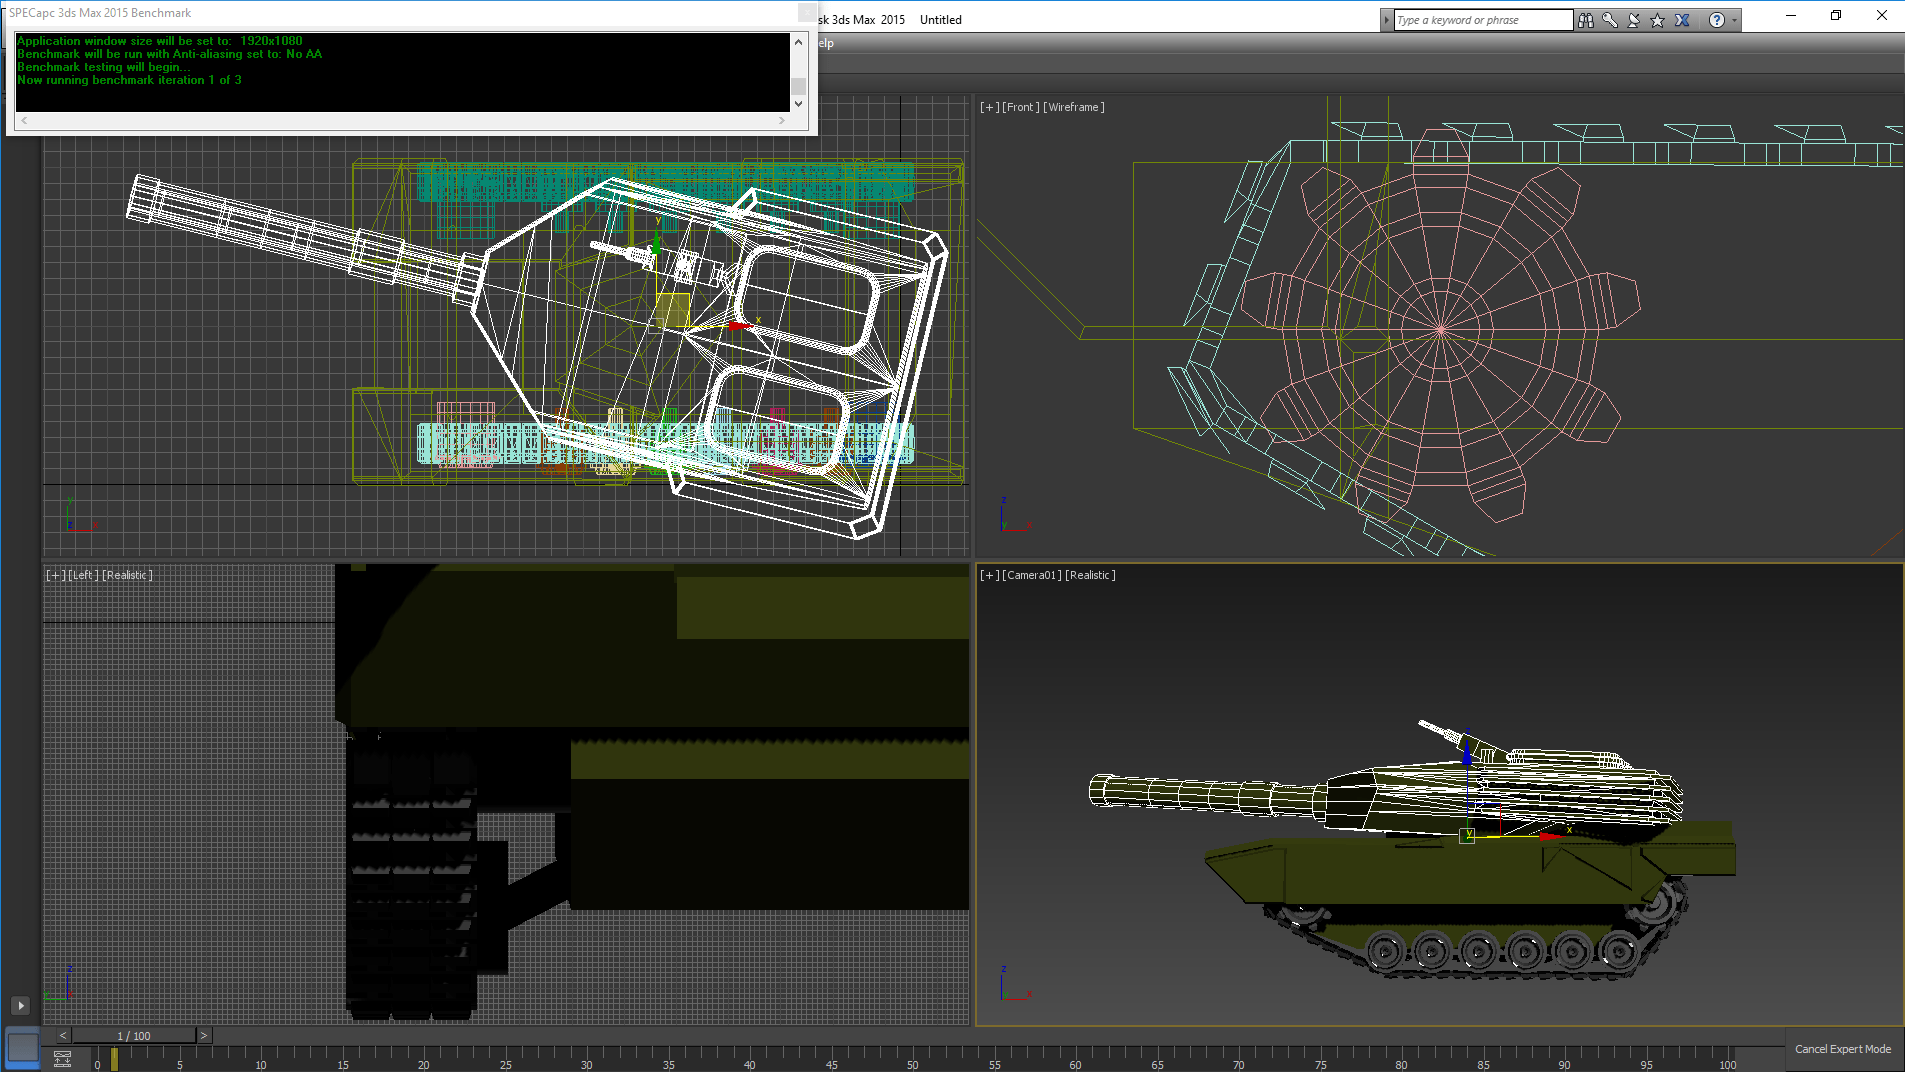
- Rendering: Autodesk 3ds Max 2015 (SPECapc) & 3ds Max 2018
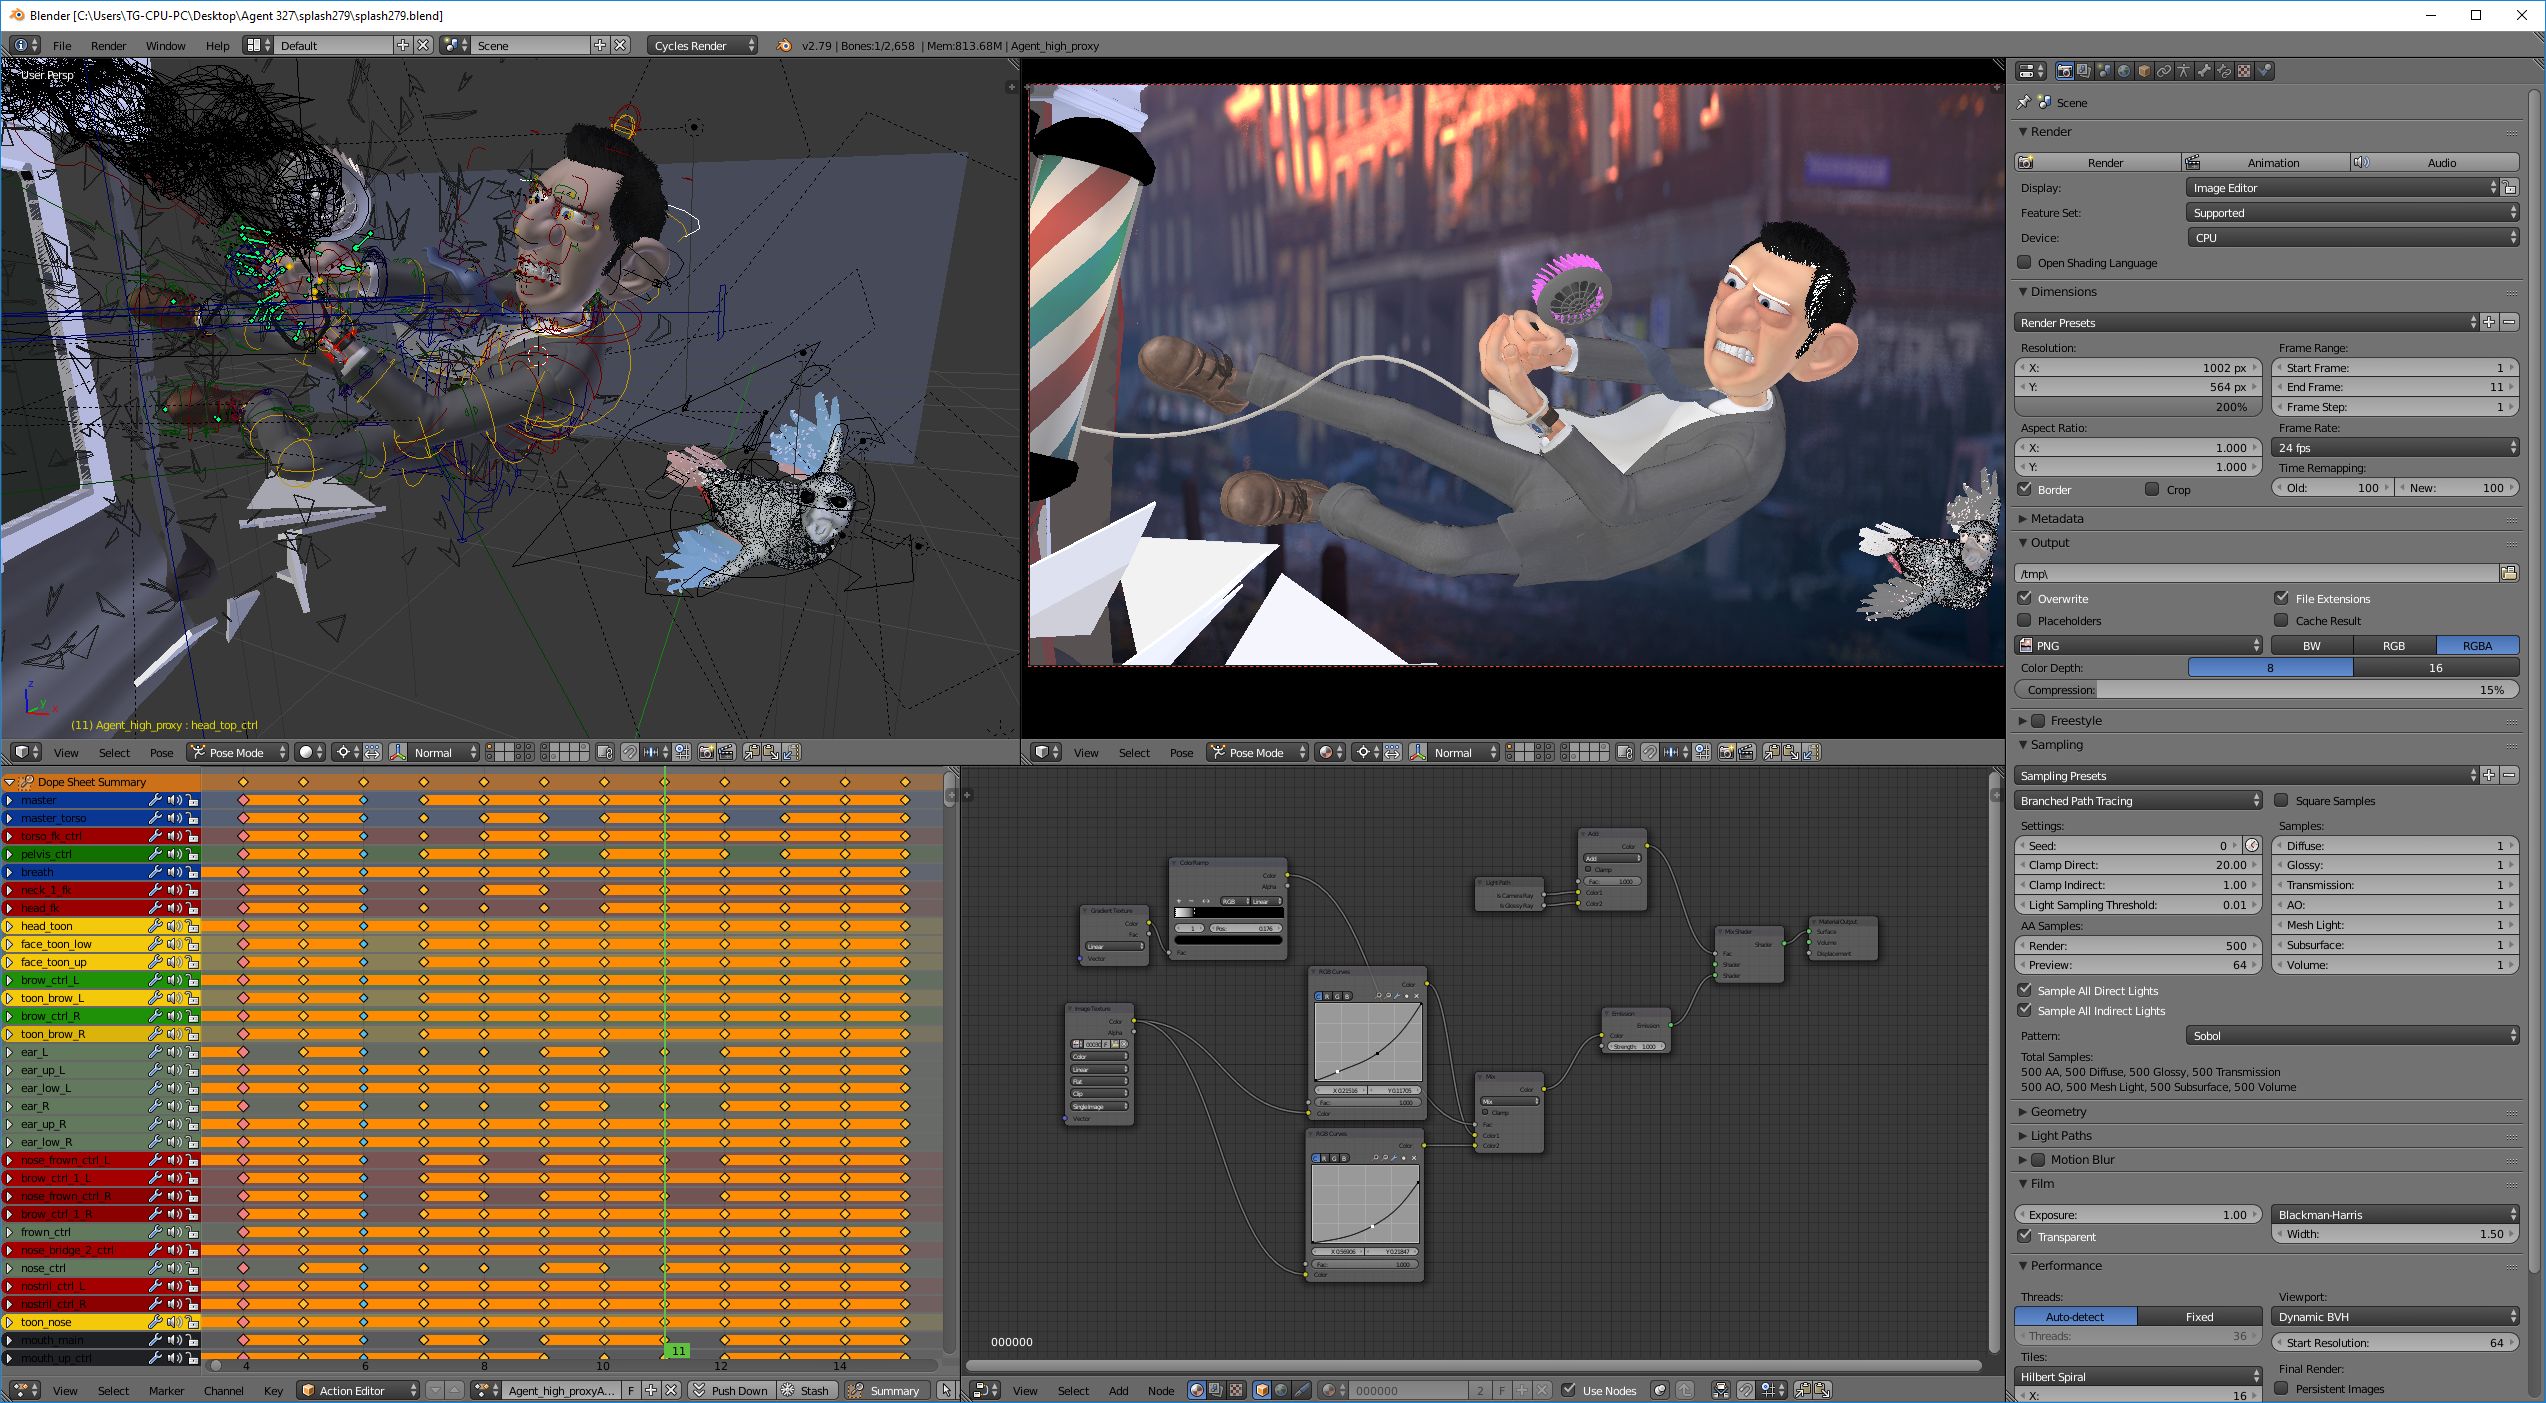
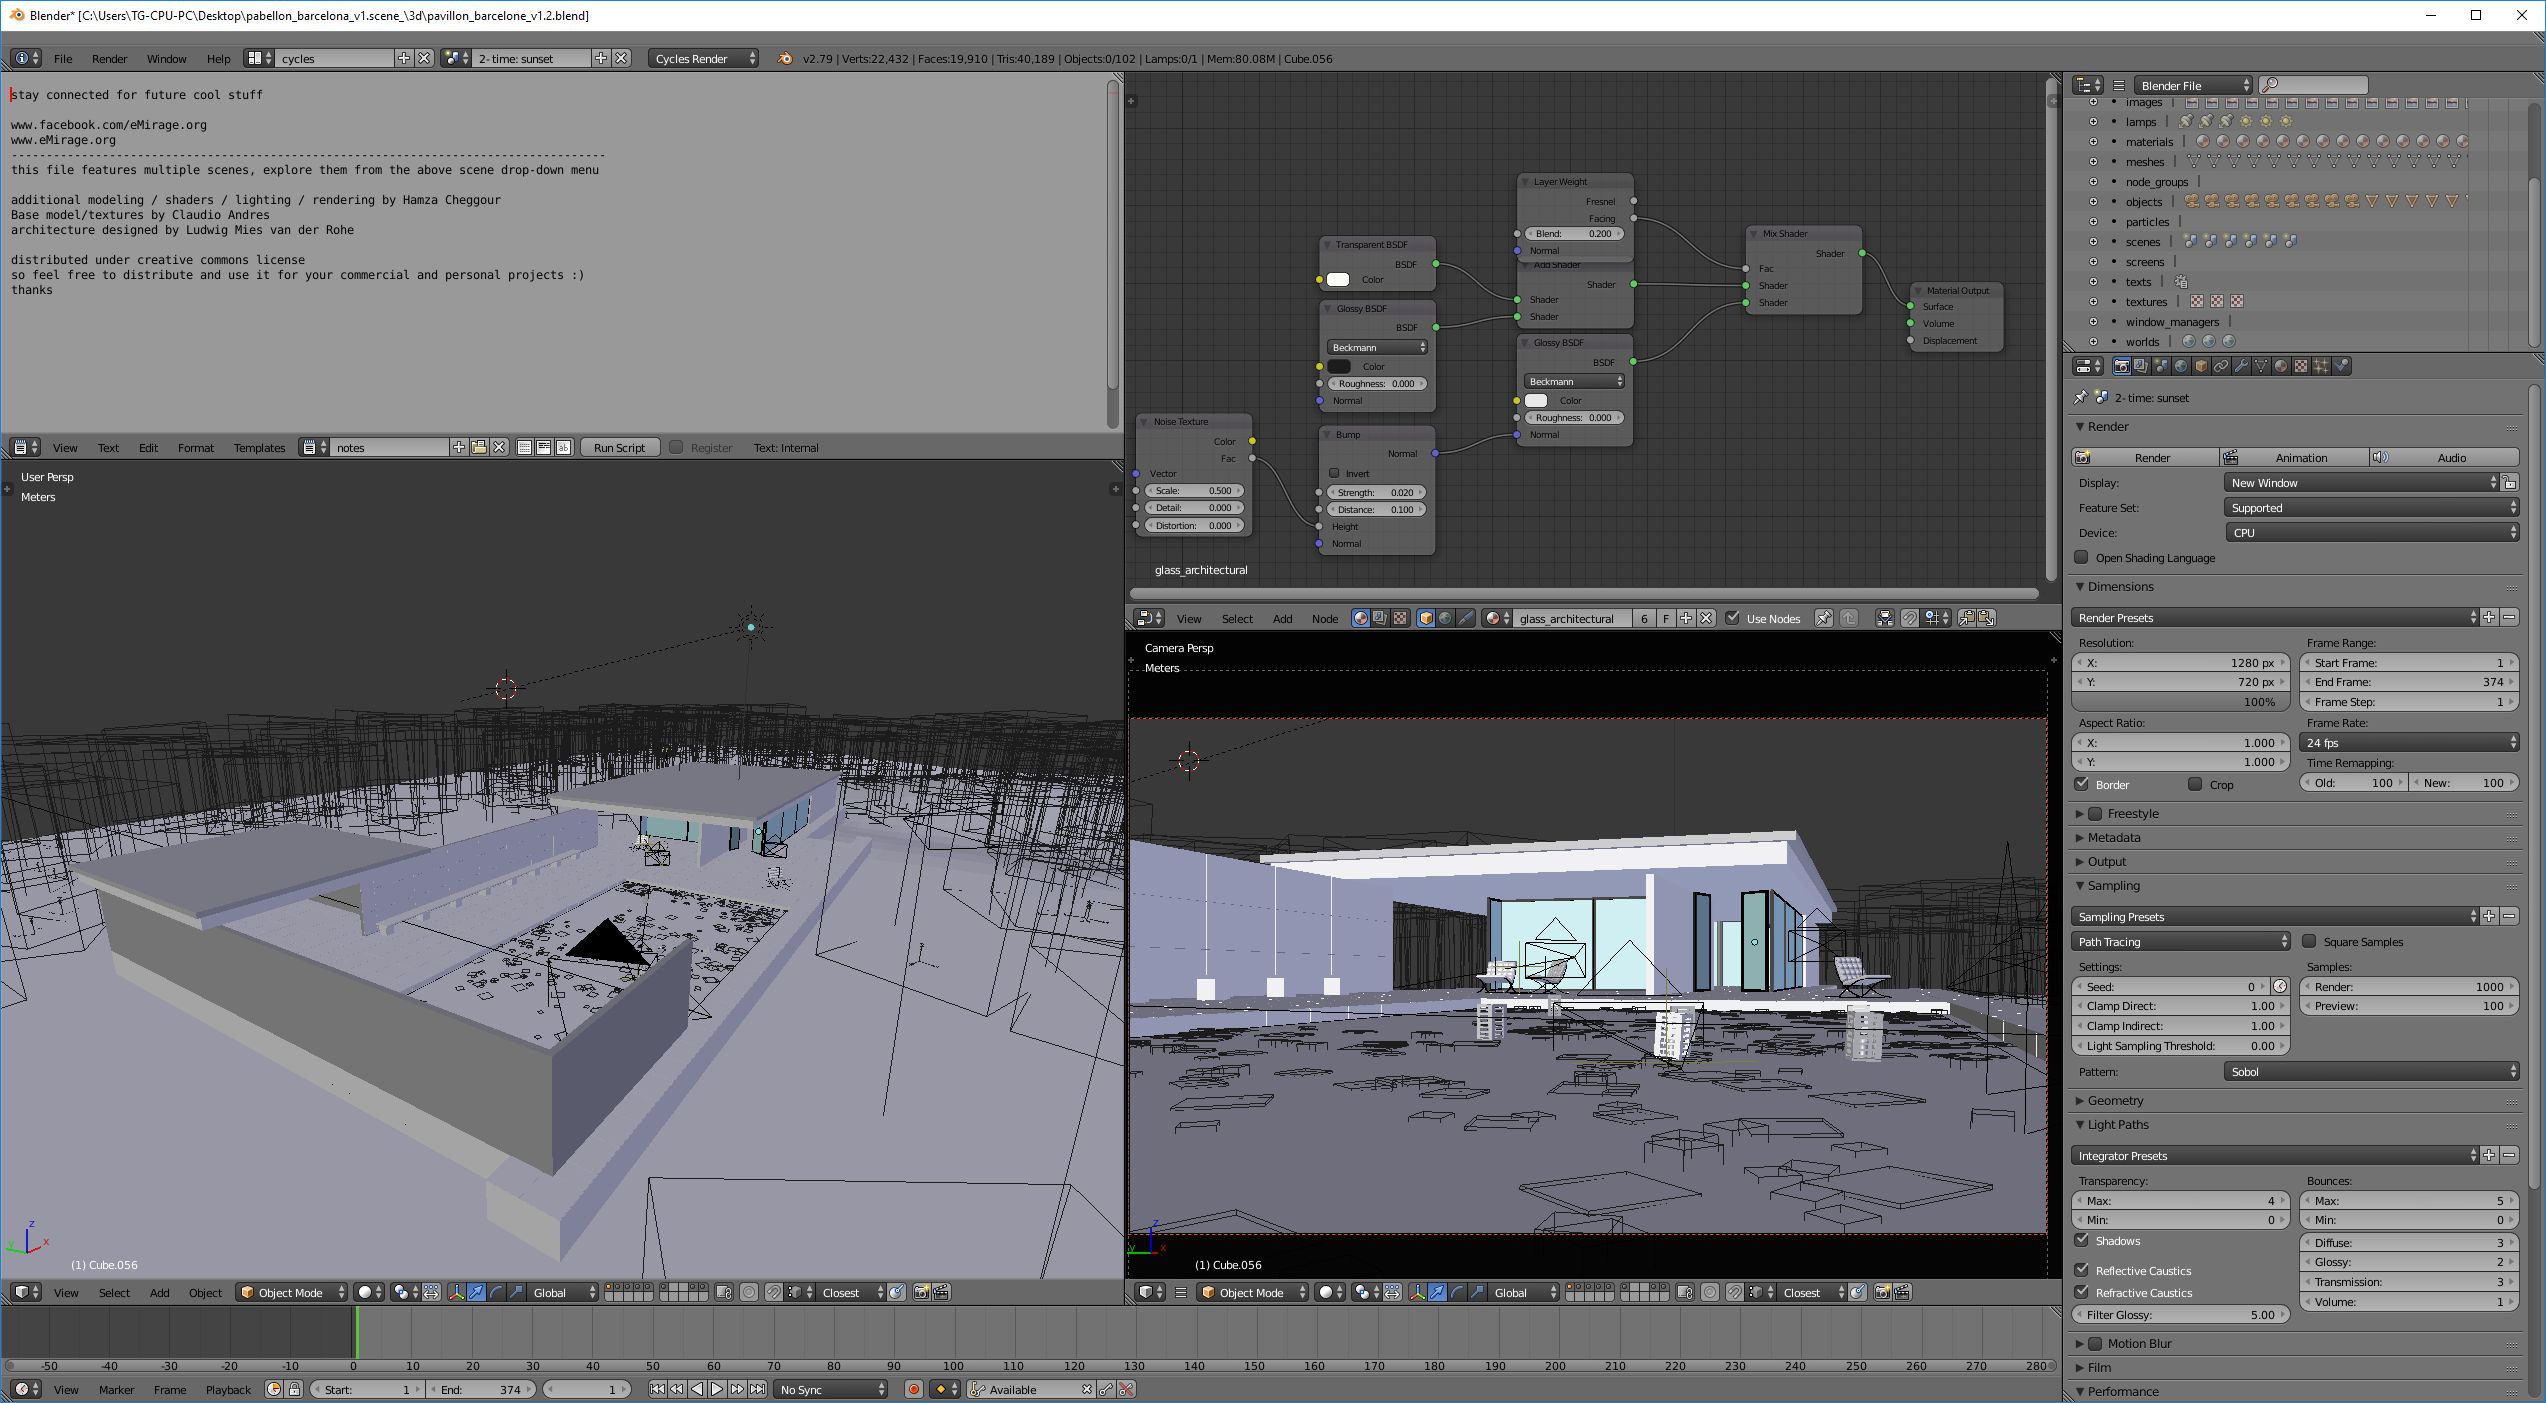
- Rendering: Blender
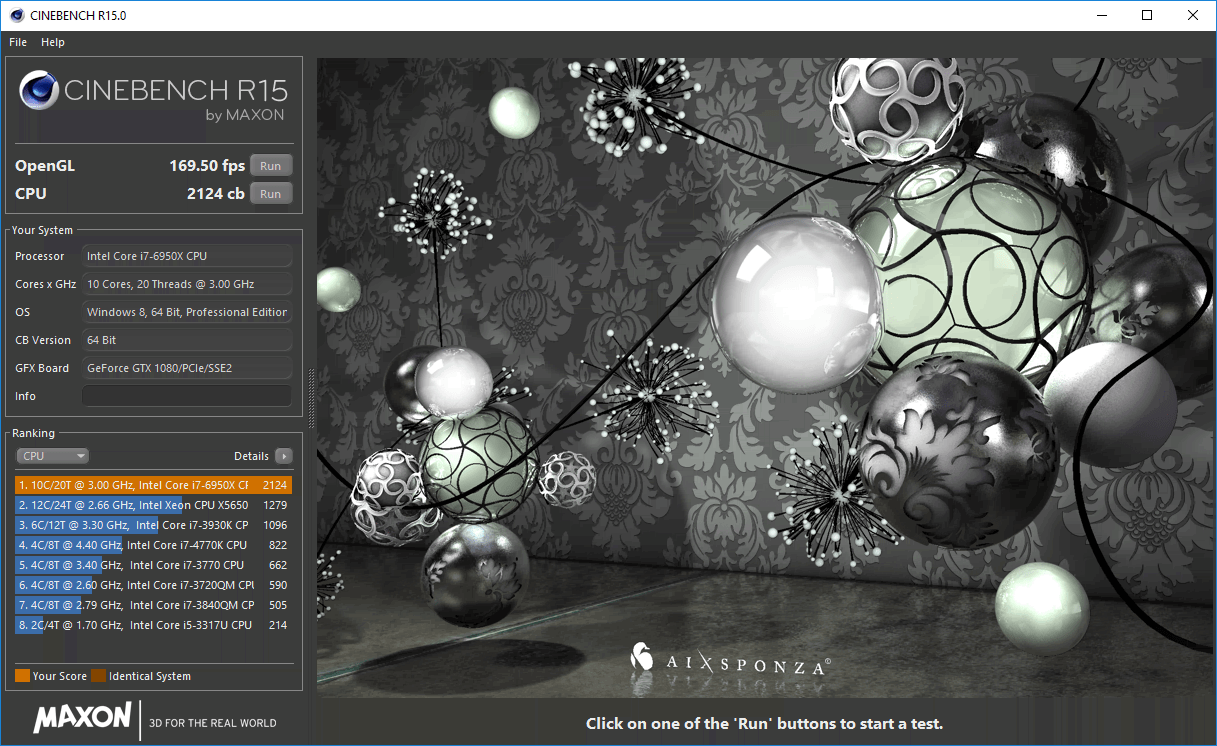
- Rendering: Cinebench
- Media: dBpoweramp
- Media: HandBrake
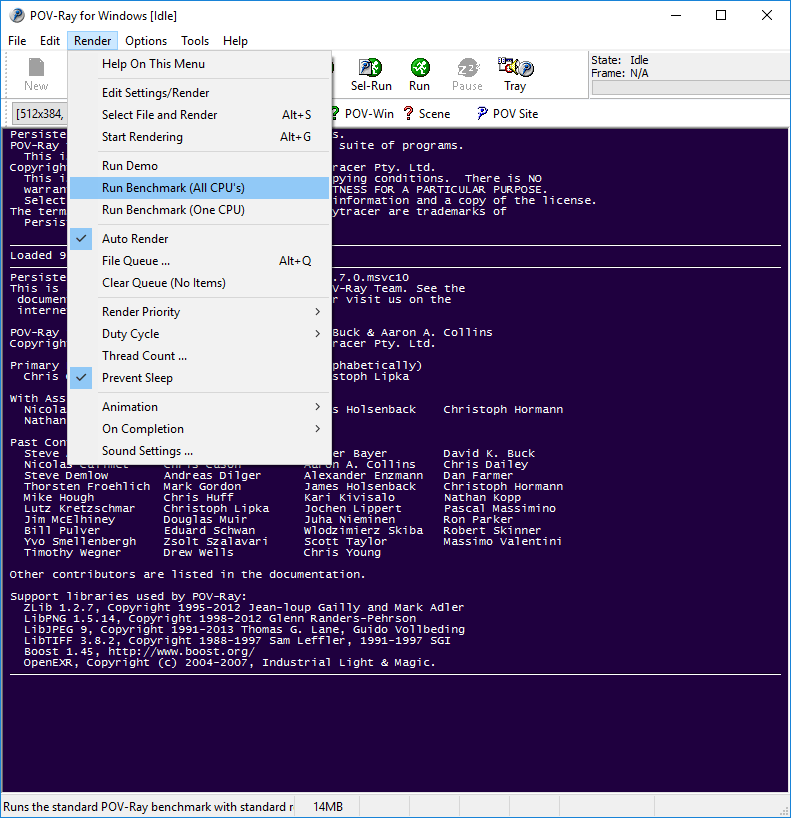
- Rendering: POV-Ray
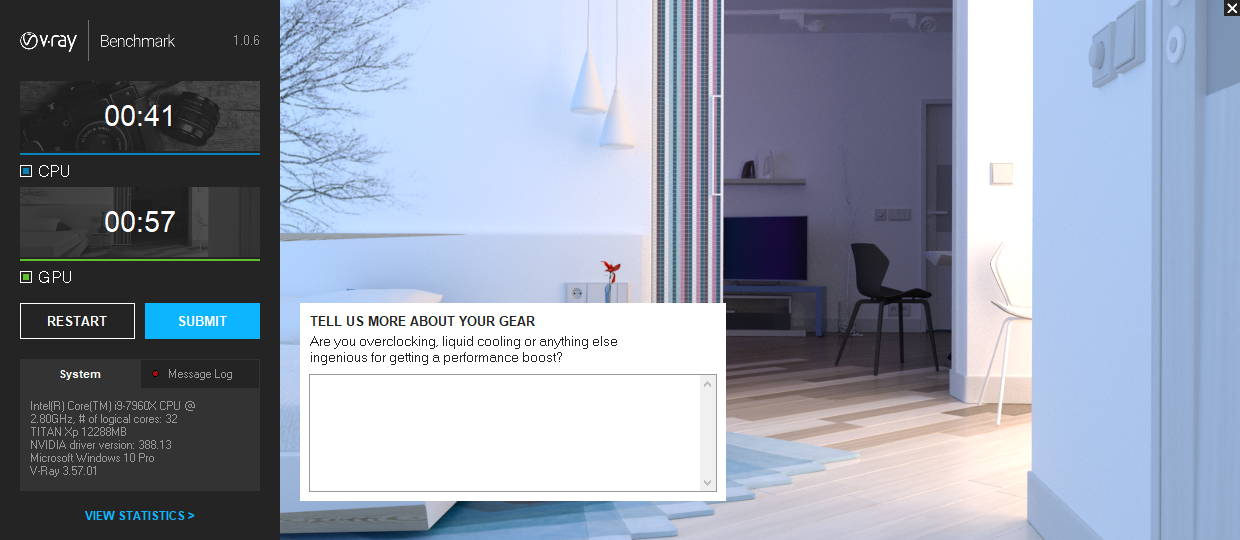
- Rendering: V-Ray Benchmark
- System: SiSoftware Sandra 2017
(Links go the benchmark result)
All of the tests shown above are used in their stock configuration. If you’re a Blender user and wish to compare your system’s performance to ours, you can download the project files for free here.
Gaming Benchmarks
Because the biggest bottleneck in a game is the graphics card, the workload needs to be put on the CPU as much as possible in order to better understand the raw performance scaling. As such, some of the games tested here were run at 1080p and 4K, with moderate detail levels.


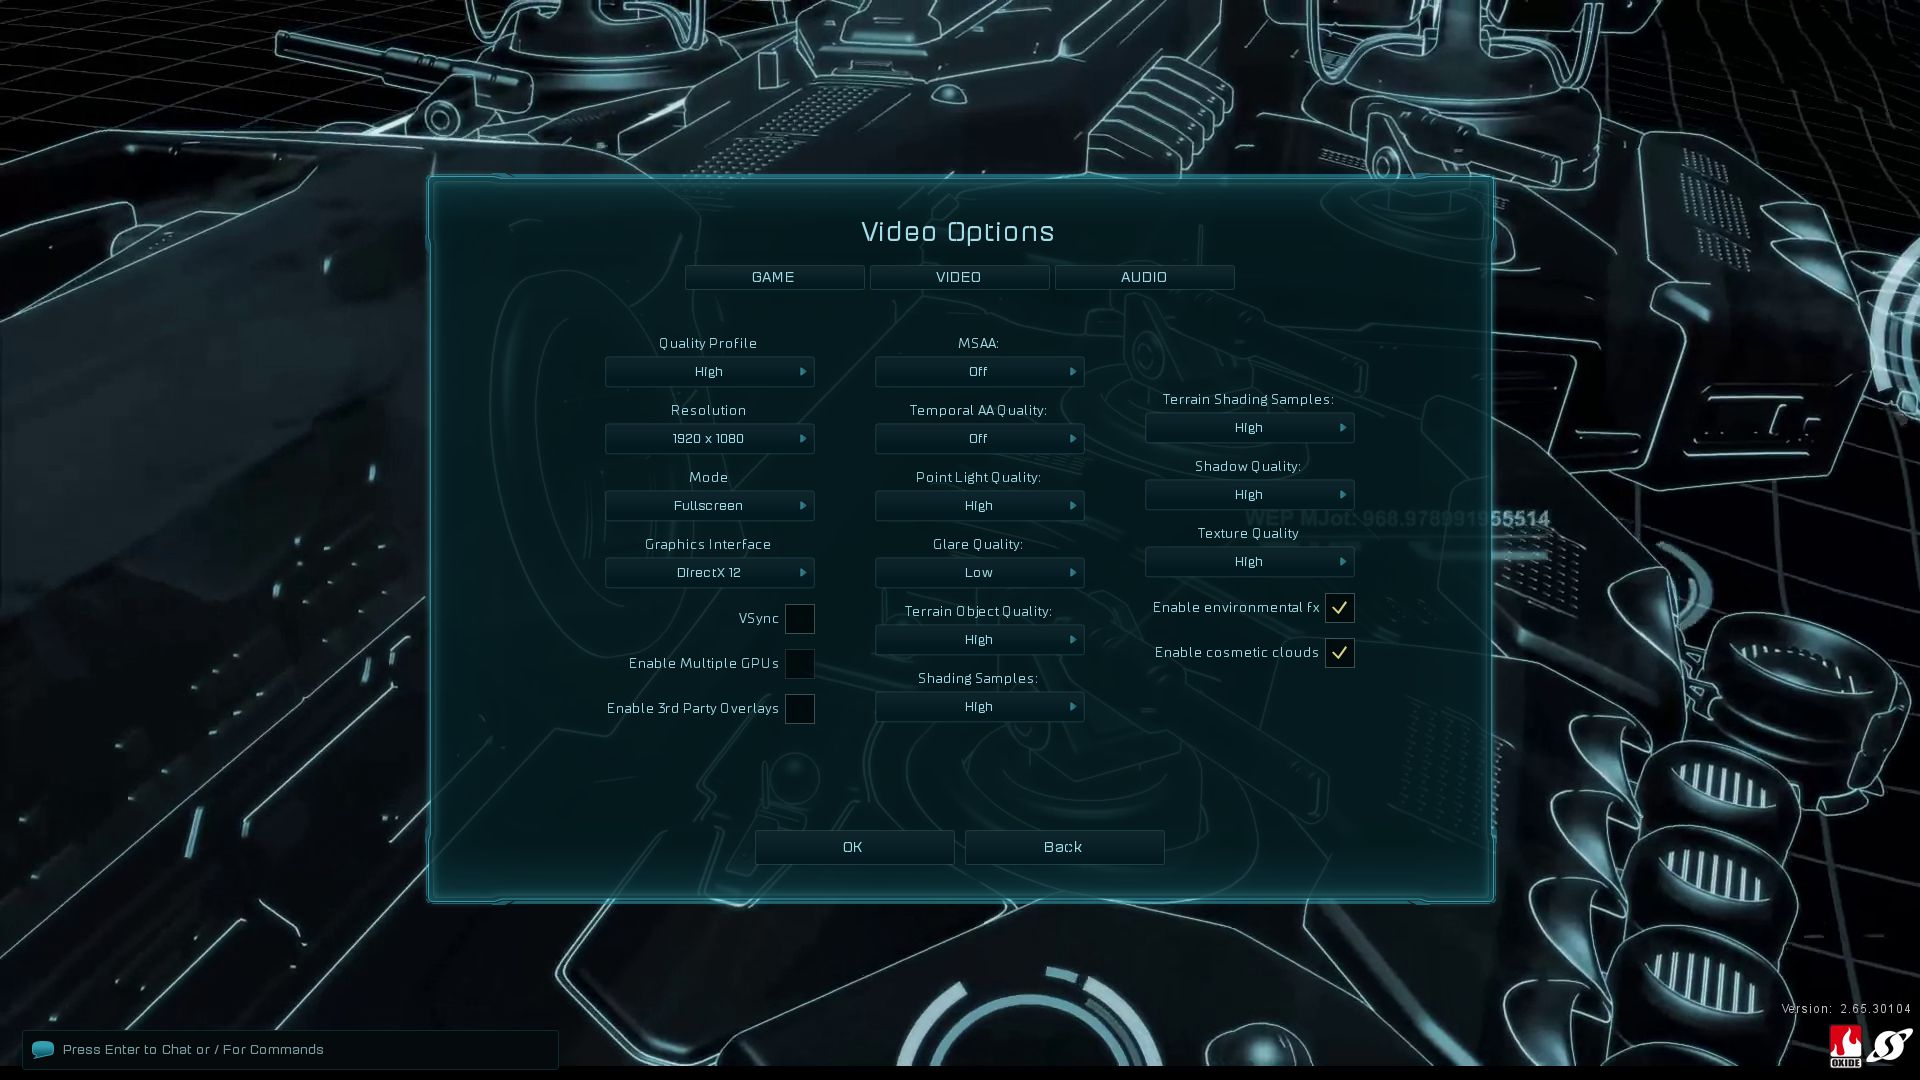


- Synthetic: Ashes of the Singularity (CPU)
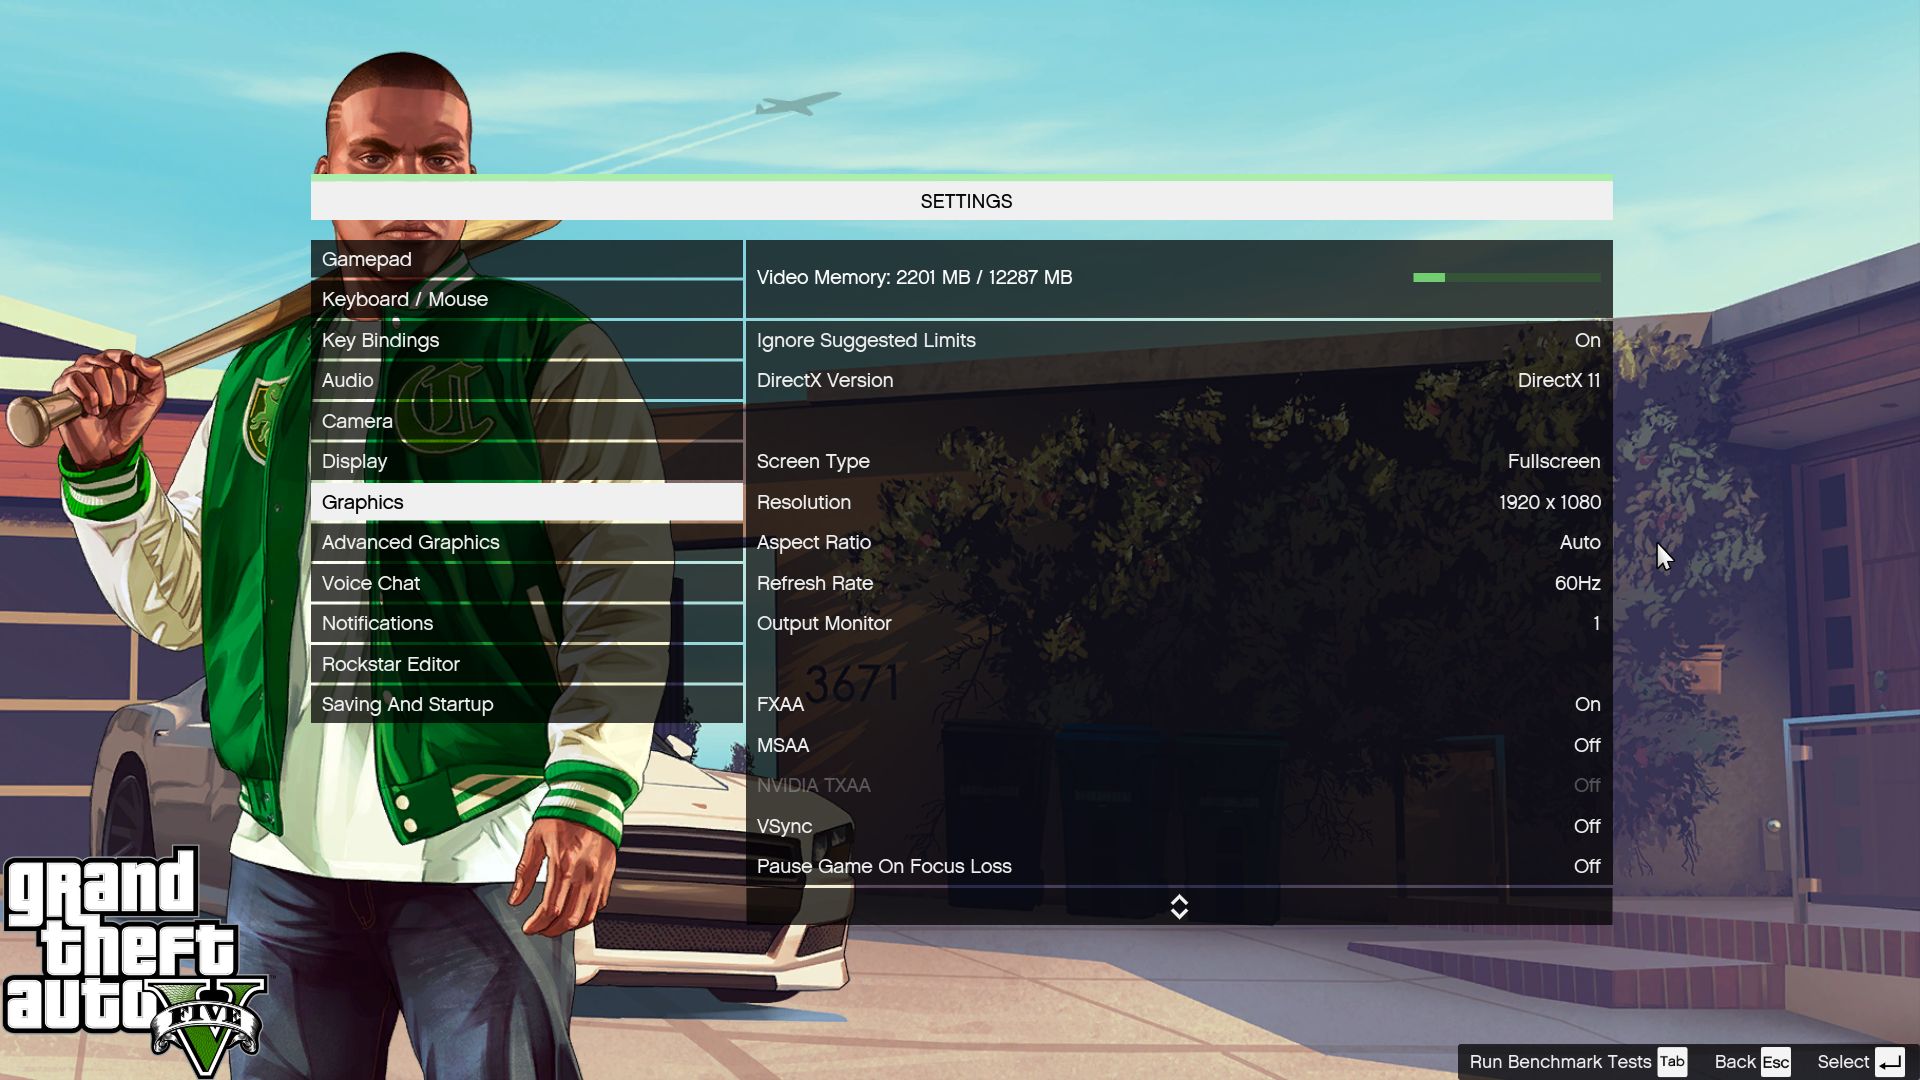
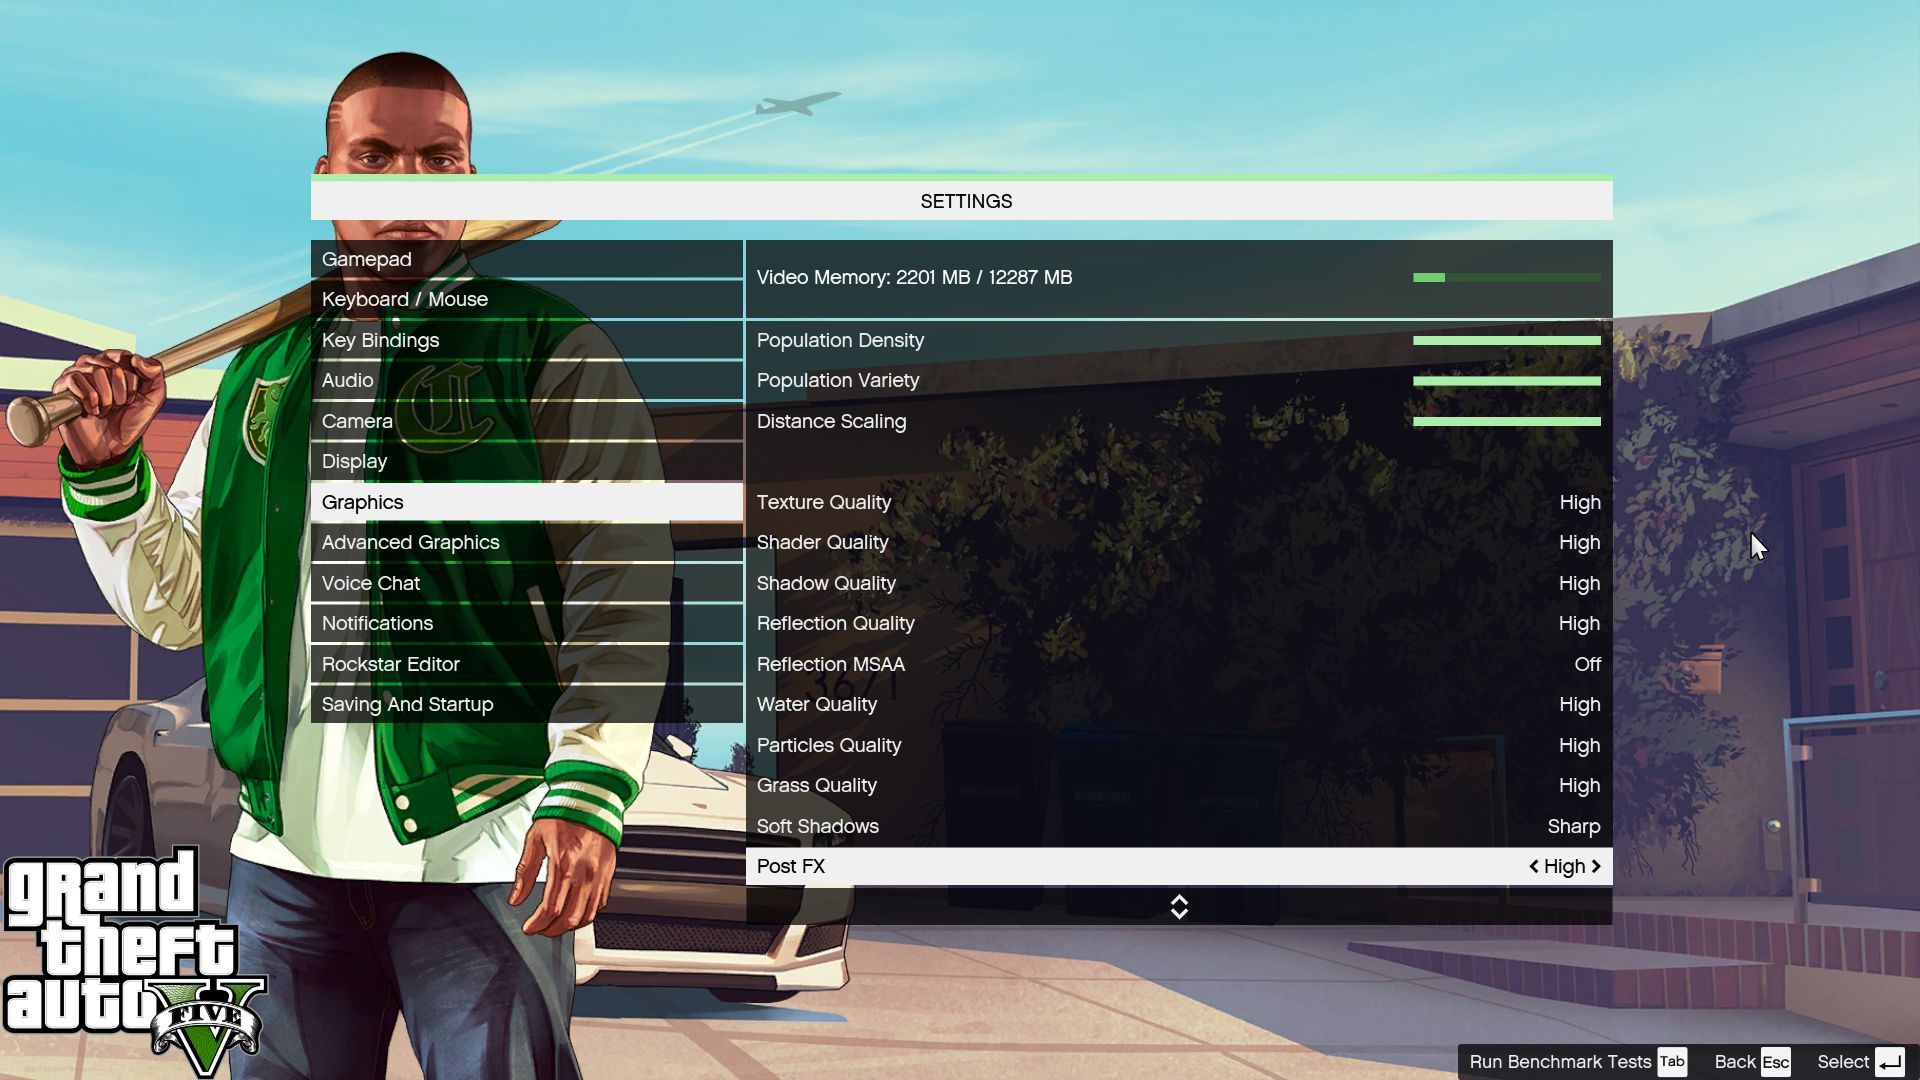
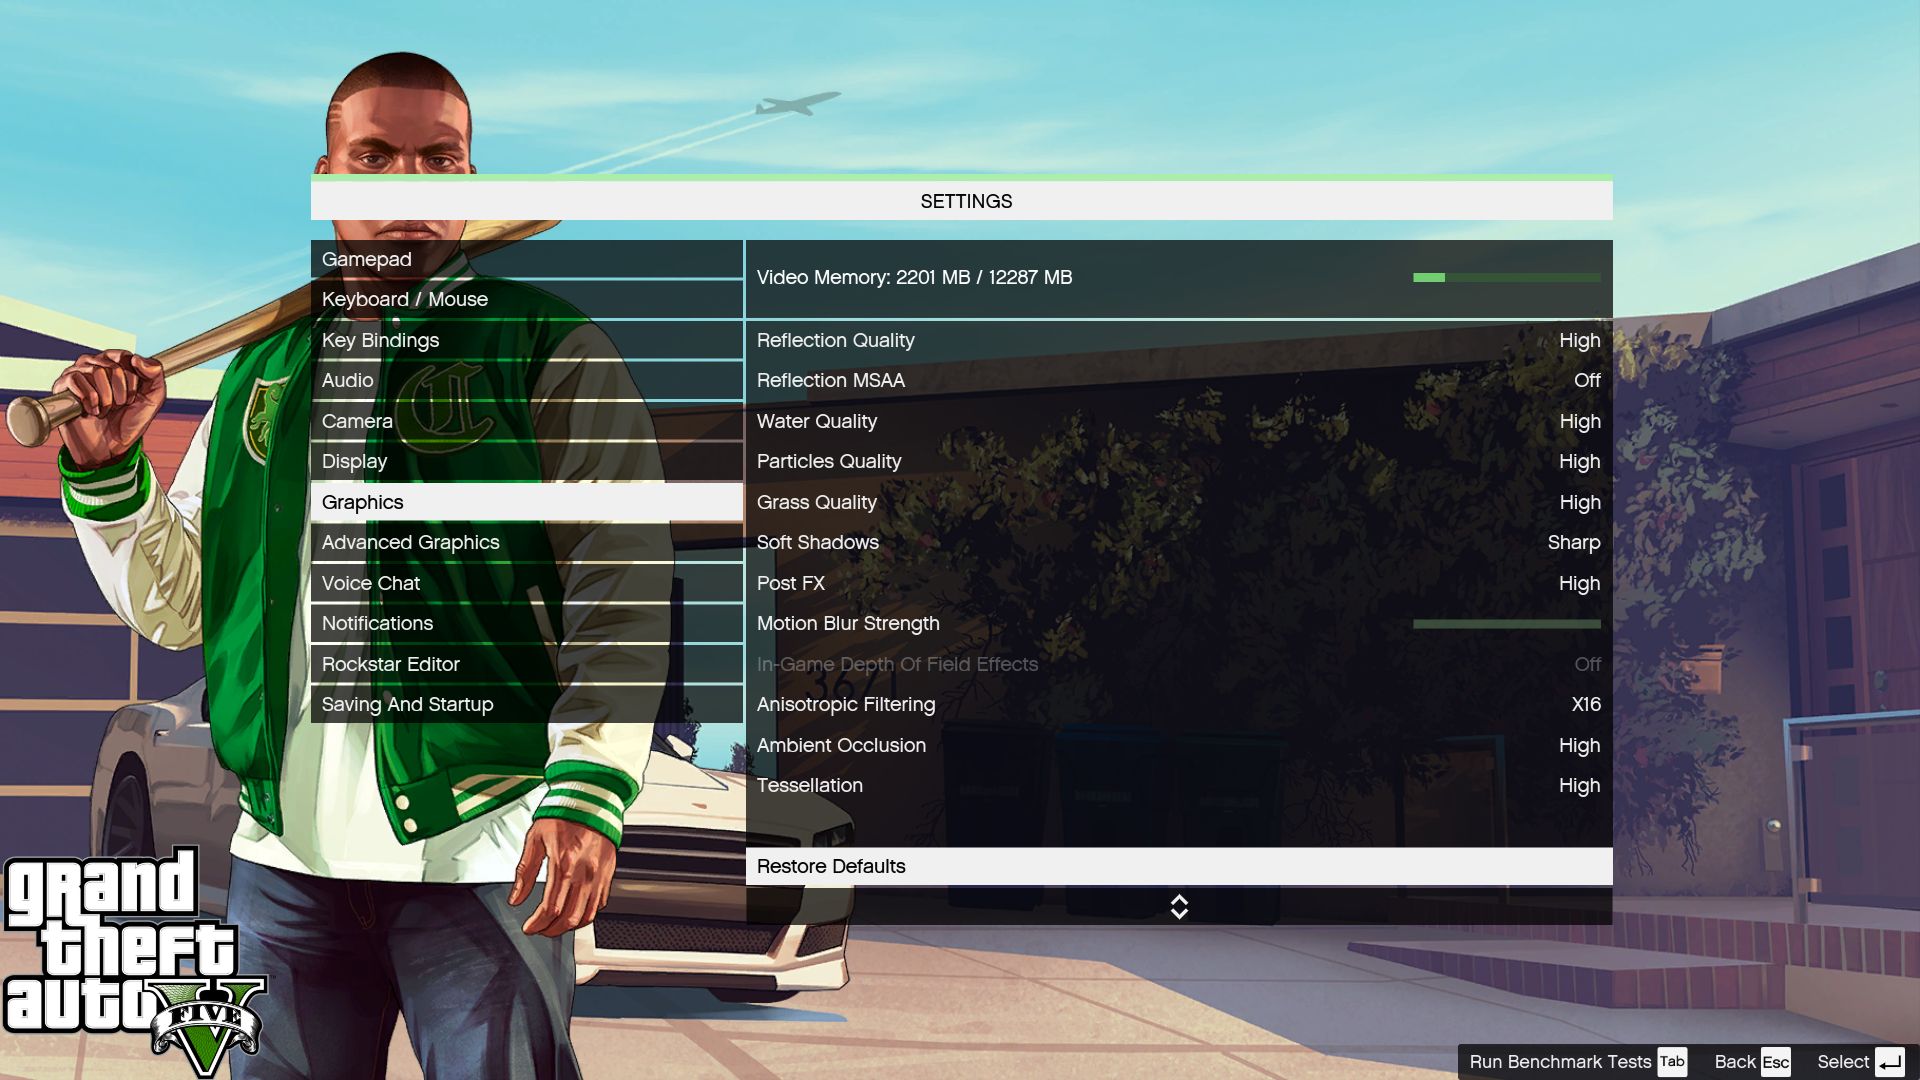
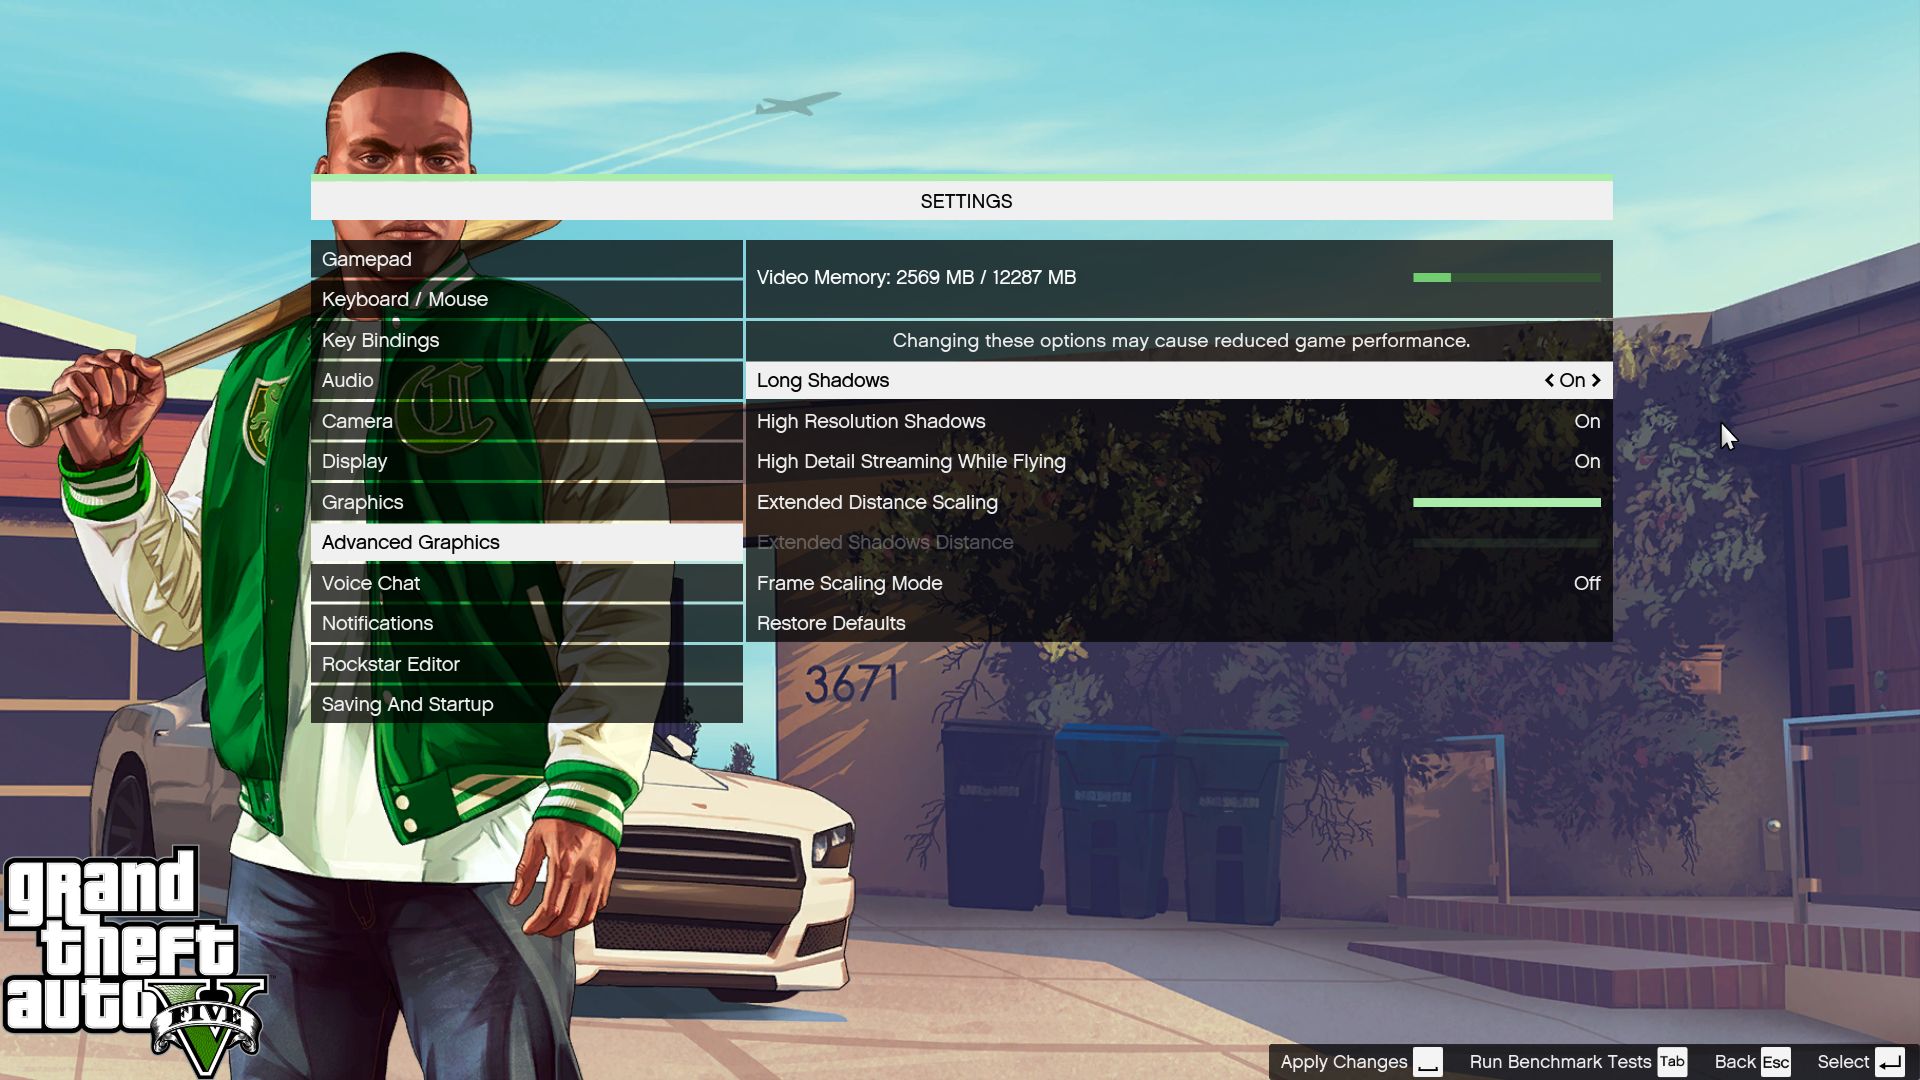
- Real-world: Grand Theft Auto V (CPU)
- Synthetic: Futuremark 3DMark (CPU + GPU)
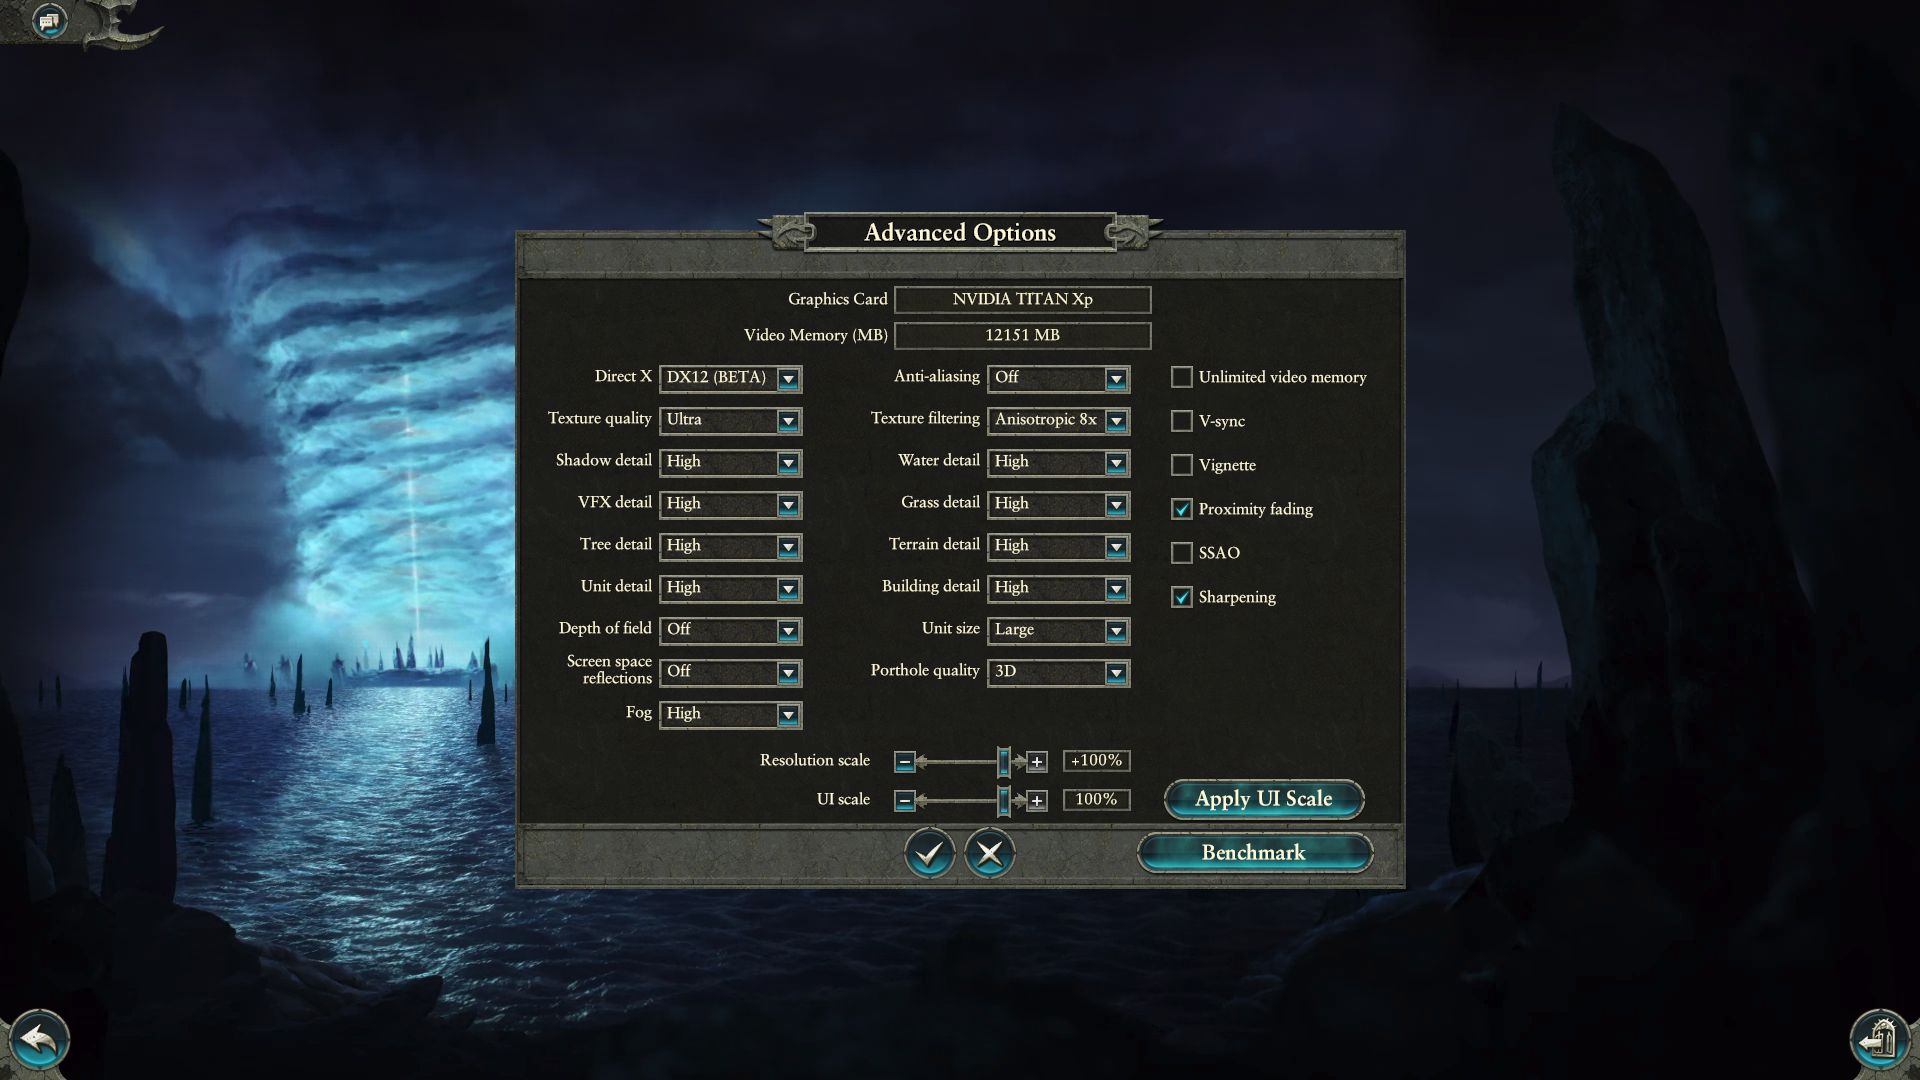
- Synthetic: Total War: WARHAMMER II (CPU + GPU)
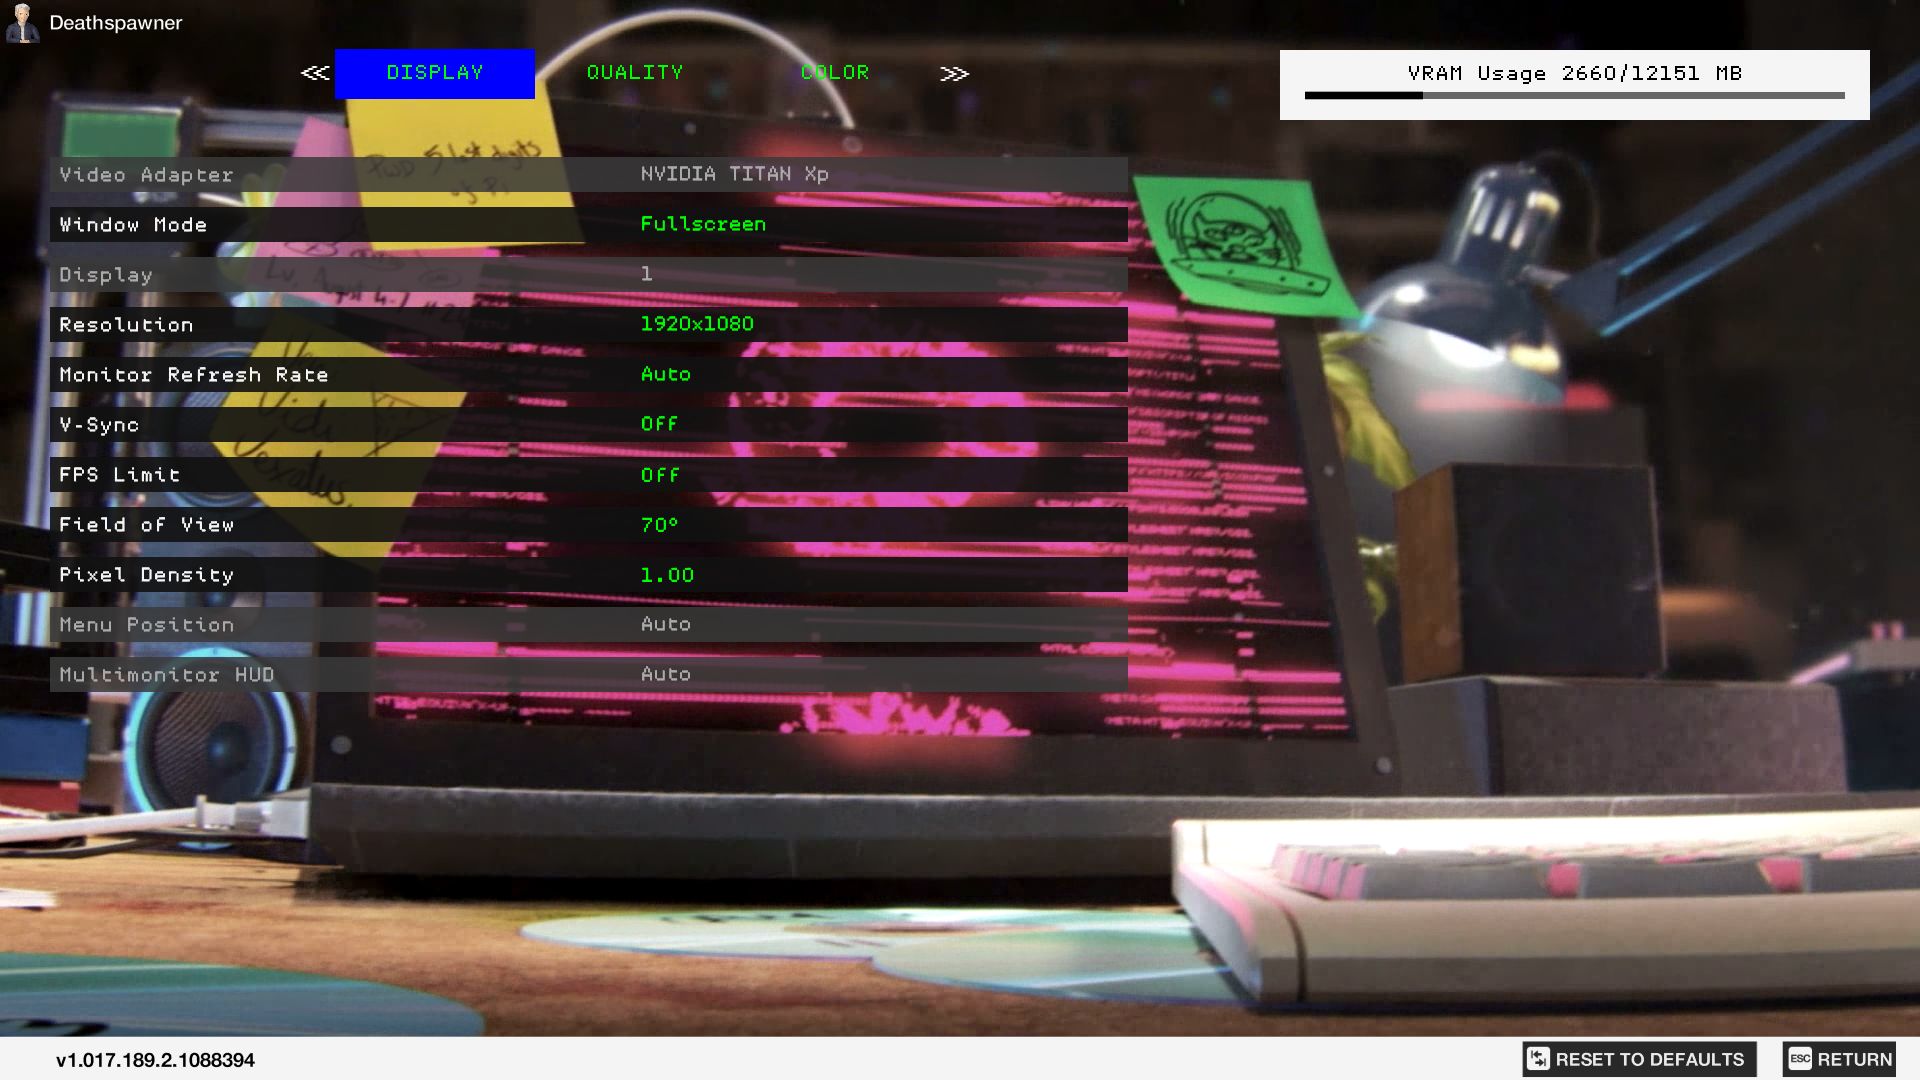
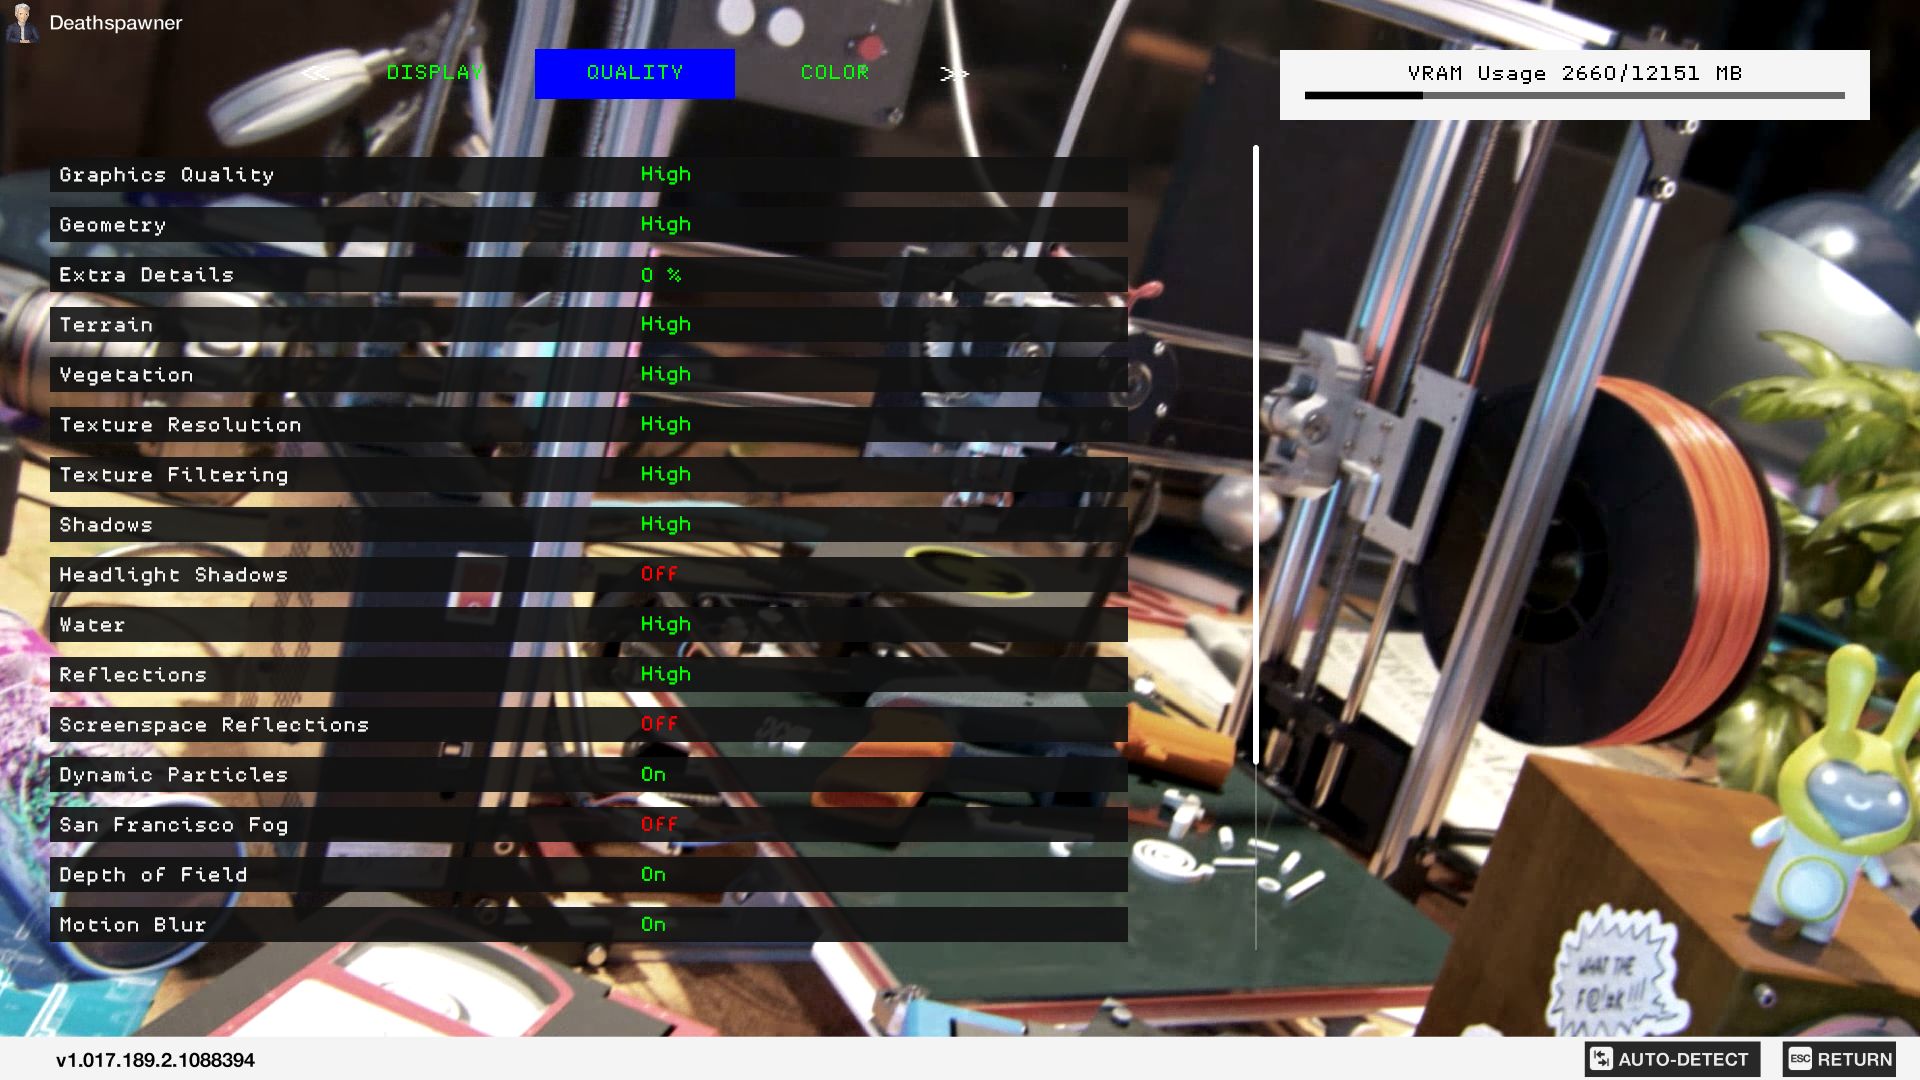
- Real-world: Watch_Dogs 2 (CPU + GPU)
(Links go the benchmark result)
Because Ashes offers the ability to act only as a CPU benchmark, it makes sense to use that for a CPU performance article. GTA V isn’t very GPU intensive, leading us to see similar results at both 1080p and 4K. As such, only 1080p is used for that title. WARHAMMER II and Watch_Dogs 2 are tested at 4K, as well as 1080p.
Linux Benchmarks
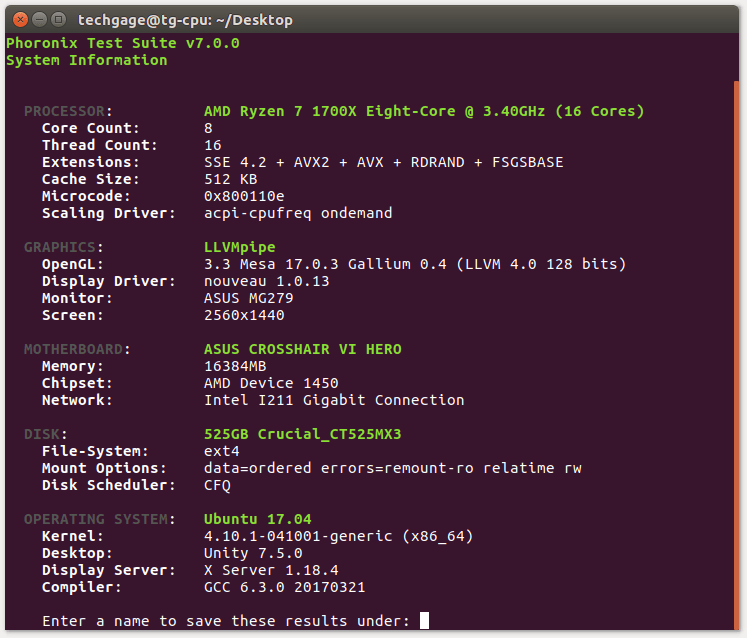
Ubuntu 17.10 is the OS of choice for our test bed, as it’s both simple to set up, and so de facto that everyone reading the results should feel at home. The OS is left as stock as possible, with minor software added, and everything updated.
Before testing begins, we take the Phoronix Test Suite suggestion of enabling the “performance” power profile; something that actually improved the encode test by 15%-ish. The command run (sudo):
echo performance | tee /sys/devices/system/cpu/cpu*/cpufreq/scaling_governor
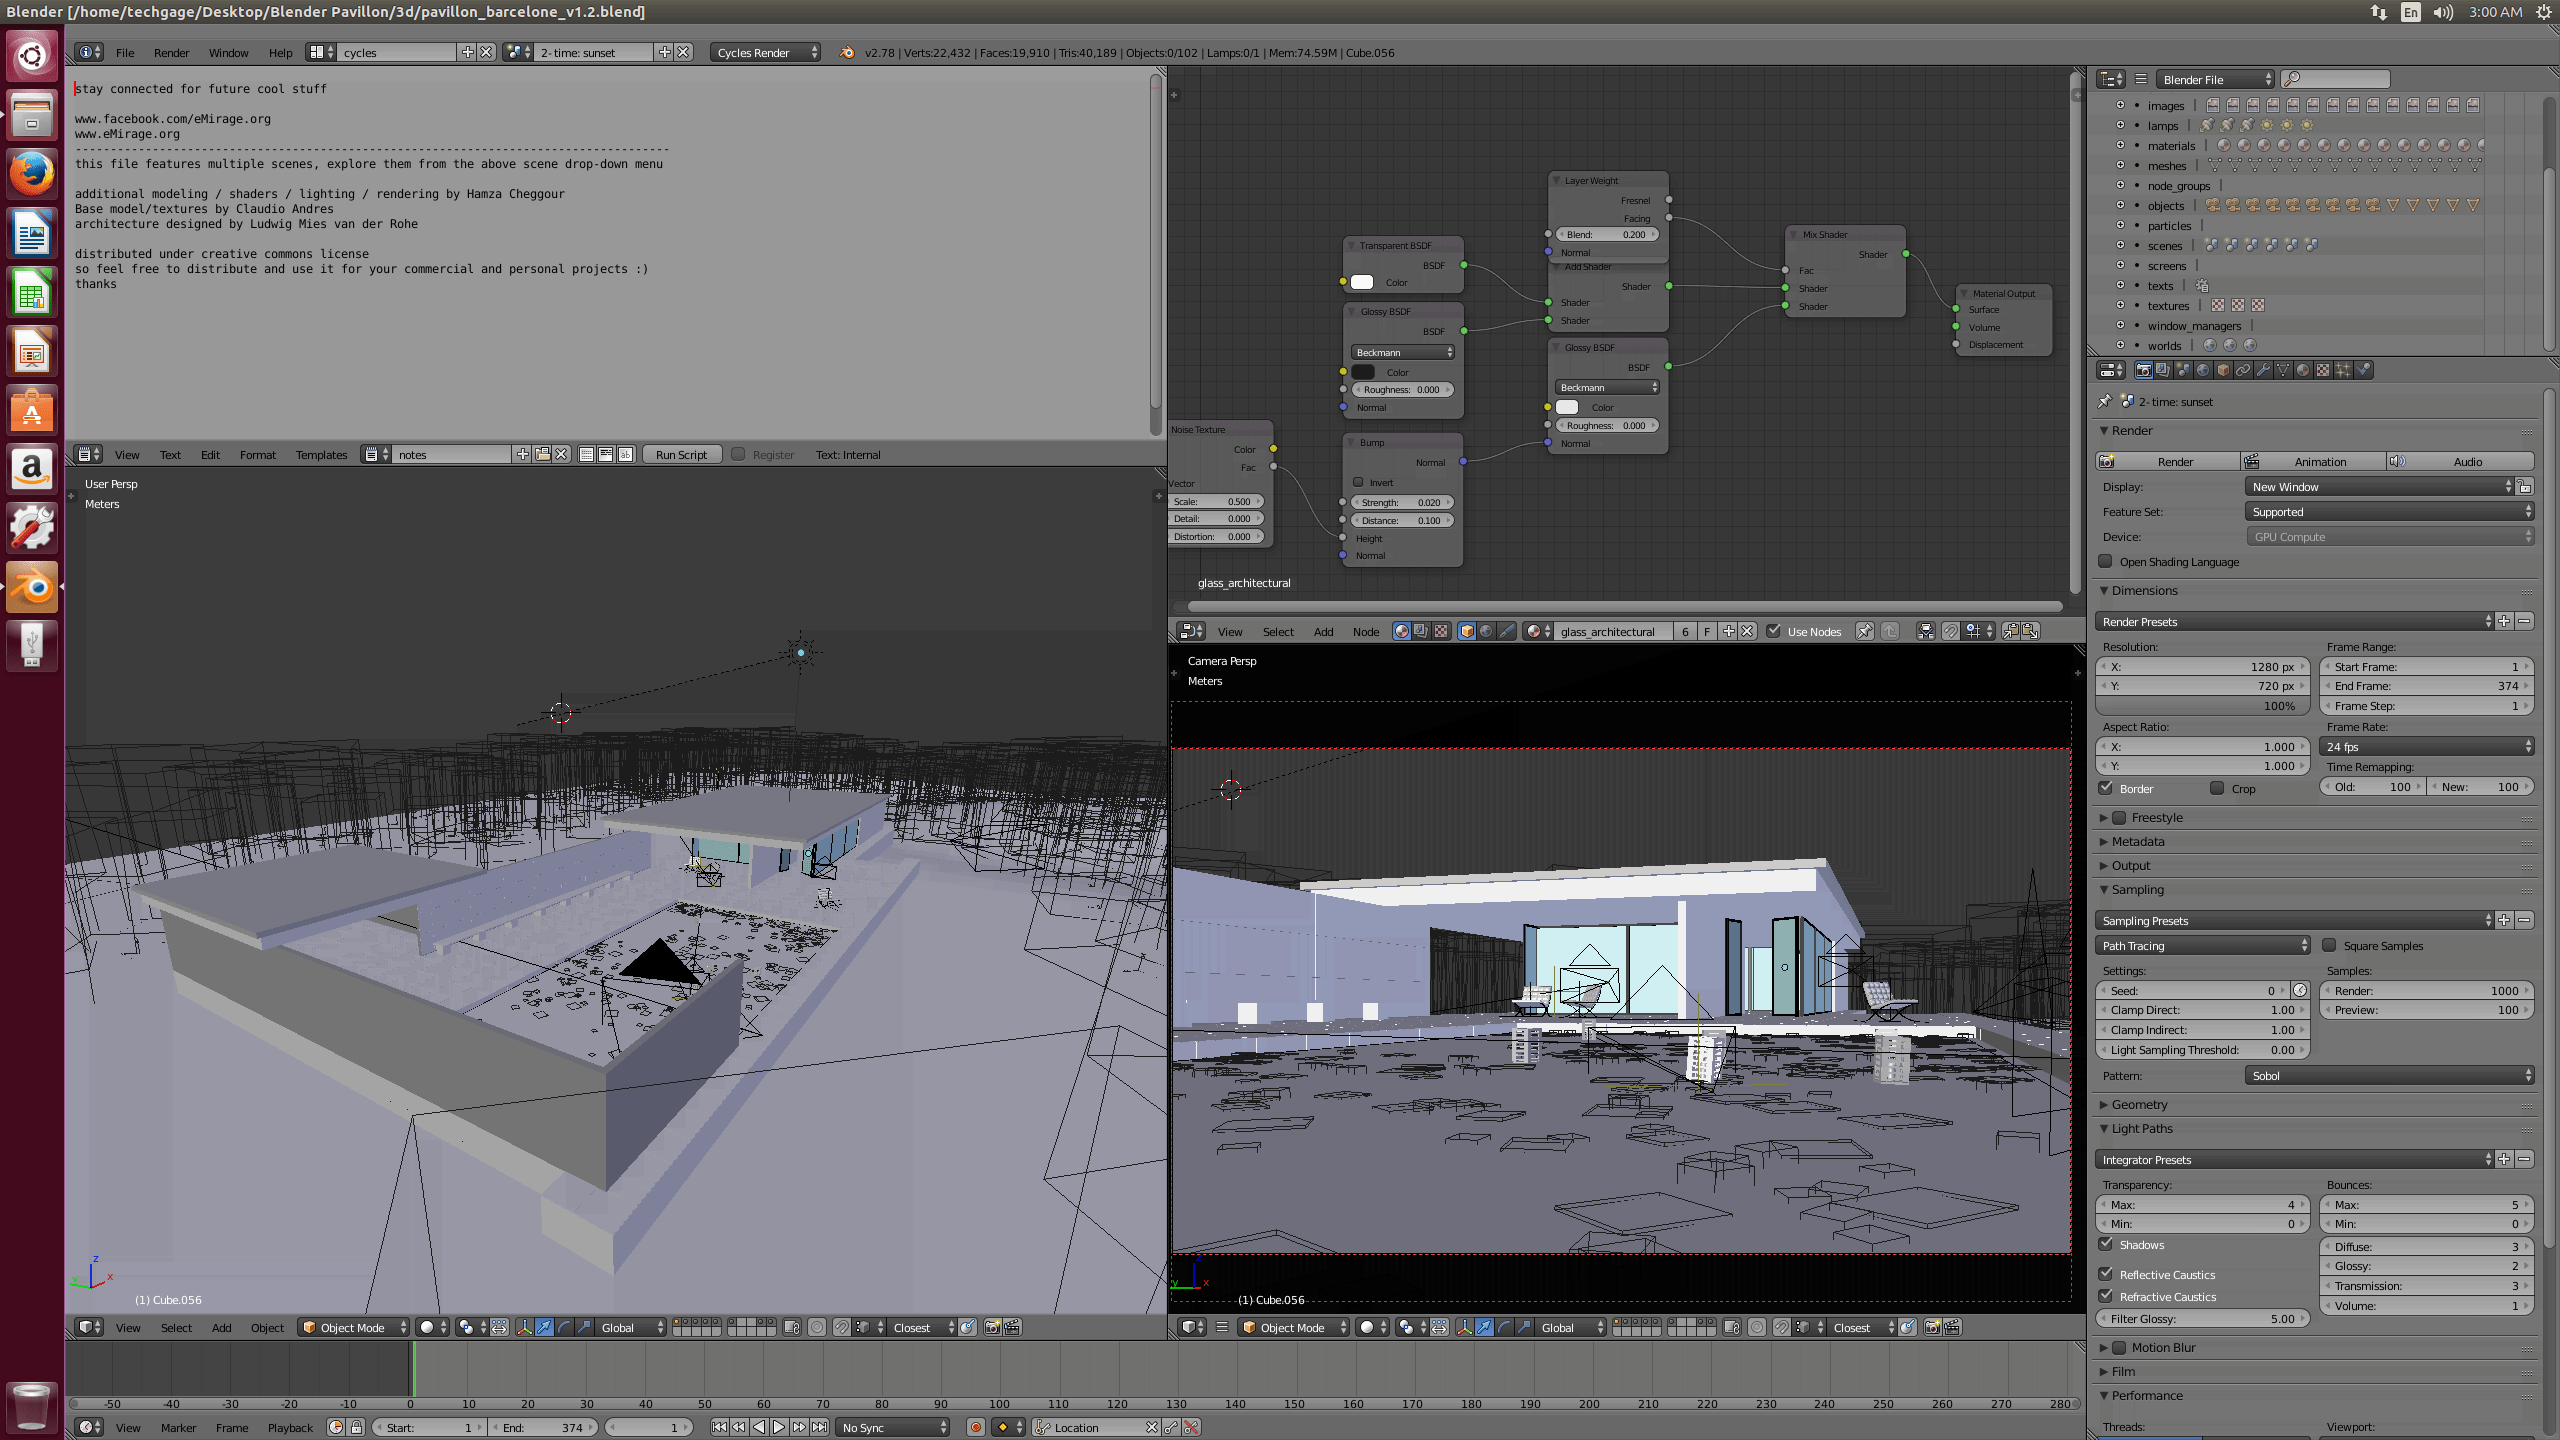

- Rendering: Blender
- Media: HandBrake
- System: Phoronix Test Suite
(Links go the benchmark result)
Both the Blender and HandBrake tests are shared with the Windows testing. Phoronix Test Suite is used for the bulk of our Linux testing, as it supplies the tests we need, and makes them easy to use.
If you think there’s some information lacking on this page, or you simply want clarification on anything in particular, don’t hesitate to leave a comment.

Support our efforts! With ad revenue at an all-time low for written websites, we're relying more than ever on reader support to help us continue putting so much effort into this type of content. You can support us by becoming a Patron, or by using our Amazon shopping affiliate links listed through our articles. Thanks for your support!

Rob Williams
Rob founded Techgage in 2005 to be an 'Advocate of the consumer', focusing on fair reviews and keeping people apprised of news in the tech world. Catering to both enthusiasts and businesses alike; from desktop gaming to professional workstations, and all the supporting software.


